Capileira Airbnb Market Analysis 2025: Short Term Rental Data & Vacation Rental Statistics in Andalusia, Spain
Is Airbnb profitable in Capileira in 2025? Explore comprehensive Airbnb analytics for Capileira, Andalusia, Spain to uncover income potential. This 2025 STR market report for Capileira, based on AirROI data from April 2024 to March 2025, reveals key trends in the niche market of 43 active listings.
Whether you're considering an Airbnb investment in Capileira, optimizing your existing vacation rental, or exploring rental arbitrage opportunities, understanding the Capileira Airbnb data is crucial. Navigating the high regulation landscape is key to maximizing your short term rental income potential. Let's dive into the specifics.
Key Capileira Airbnb Performance Metrics Overview
Monthly Airbnb Revenue Variations & Income Potential in Capileira (2025)
Understanding the monthly revenue variations for Airbnb listings in Capileira is key to maximizing your short term rental income potential. Seasonality significantly impacts earnings. Our analysis, based on data from the past 12 months, shows that the peak revenue month for STRs in Capileira is typically August, while March often presents the lowest earnings, highlighting opportunities for strategic pricing adjustments during shoulder and low seasons. Explore the typical Airbnb income in Capileira across different performance tiers:
- Best-in-class properties (Top 10%) achieve $2,518+ monthly, often utilizing dynamic pricing and superior guest experiences.
- Strong performing properties (Top 25%) earn $1,622 or more, indicating effective management and desirable locations/amenities.
- Typical properties (Median) generate around $985 per month, representing the average market performance.
- Entry-level properties (Bottom 25%) see earnings around $581, often with potential for optimization.
Average Monthly Airbnb Earnings Trend in Capileira
Capileira Airbnb Occupancy Rate Trends (2025)
Maximize your bookings by understanding the Capileira STR occupancy trends. Seasonal demand shifts significantly influence how often properties are booked. Typically, Augustsees the highest demand (peak season occupancy), while March experiences the lowest (low season). Effective strategies, like adjusting minimum stays or offering promotions, can boost occupancy during slower periods. Here's how different property tiers perform in Capileira:
- Best-in-class properties (Top 10%) achieve 68%+ occupancy, indicating high desirability and potentially optimized availability.
- Strong performing properties (Top 25%) maintain 53% or higher occupancy, suggesting good market fit and guest satisfaction.
- Typical properties (Median) have an occupancy rate around 31%.
- Entry-level properties (Bottom 25%) average 16% occupancy, potentially facing higher vacancy.
Average Monthly Occupancy Rate Trend in Capileira
Average Daily Rate (ADR) Airbnb Trends in Capileira (2025)
Effective short term rental pricing strategy in Capileira involves understanding monthly ADR fluctuations. The Average Daily Rate (ADR) for Airbnb in Capileira typically peaks in November and dips lowest during February. Leveraging Airbnb dynamic pricing tools or strategies based on this seasonality can significantly boost revenue. Here's a look at the typical nightly rates achieved:
- Best-in-class properties (Top 10%) command rates of $241+ per night, often due to premium features or locations.
- Strong performing properties (Top 25%) achieve nightly rates of $151 or more.
- Typical properties (Median) charge around $101 per night.
- Entry-level properties (Bottom 25%) earn around $85 per night.
Average Daily Rate (ADR) Trend by Month in Capileira
Get Live Capileira Market Intelligence 👇

Explore Real-time Analytics
Airbnb Seasonality Analysis & Trends in Capileira (2025)
Peak Season (August, December, September)
- Revenue averages $1,564 per month
- Occupancy rates average 44.3%
- Daily rates average $146
Shoulder Season
- Revenue averages $1,191 per month
- Occupancy maintains around 33.7%
- Daily rates hold near $148
Low Season (February, March, June)
- Revenue drops to average $982 per month
- Occupancy decreases to average 31.9%
- Daily rates adjust to average $145
Seasonality Insights for Capileira
- The Airbnb seasonality in Capileira shows moderate seasonality with distinct peak and low periods. While the sections above show seasonal averages, it's also insightful to look at the extremes:
- During the high season, the absolute peak month showcases Capileira's highest earning potential, with monthly revenues capable of climbing to $1,712, occupancy reaching a high of 47.3%, and ADRs peaking at $149.
- Conversely, the slowest single month of the year, typically falling within the low season, marks the market's lowest point. In this month, revenue might dip to $896, occupancy could drop to 27.7%, and ADRs may adjust down to $144.
- Understanding both the seasonal averages and these monthly peaks and troughs in revenue, occupancy, and ADR is crucial for maximizing your Airbnb profit potential in Capileira.
Seasonal Strategies for Maximizing Profit
- Peak Season: Maximize revenue through premium pricing and potentially longer minimum stays. Ensure high availability.
- Low Season: Offer competitive pricing, special promotions (e.g., extended stay discounts), and flexible cancellation policies. Target off-season travelers like remote workers or budget-conscious guests.
- Shoulder Seasons: Implement dynamic pricing that balances peak and low rates. Target weekend travelers or specific events. Offer slightly more flexible terms than peak season.
- Regularly analyze your own performance against these Capileira seasonality benchmarks and adjust your pricing and availability strategy accordingly.
Best Areas for Airbnb Investment in Capileira (2025)
Exploring the top neighborhoods for short-term rentals in Capileira? This section highlights key areas, outlining why they are attractive for hosts and guests, along with notable local attractions. Consider these locations based on your target guest profile and investment strategy.
| Neighborhood / Area | Why Host Here? (Target Guests & Appeal) | Key Attractions & Landmarks |
|---|---|---|
| Capileira Town Center | The heart of Capileira, offering easy access to local shops, restaurants, and cultural experiences. Visitors are drawn to the charming atmosphere and proximity to nature. | Bubion, Cultural events, Local artisan shops, Scenic viewpoints, Restaurants with local cuisine |
| Poqueira Gorge | Famous for its stunning landscapes and hiking routes, the Poqueira Gorge attracts outdoor enthusiasts and nature lovers. Ideal for guests looking to explore the Sierra Nevada. | Sierra Nevada National Park, Hiking trails, Natural pools, Breathtaking views, Flora and fauna diversity |
| Cultural Heritage Sites | Surrounding areas rich in history and architecture, perfect for travelers interested in the Andalusian culture and history. Options for guided tours enhance the experience. | Historic churches, Andalusian architecture, Local museums, Guided cultural tours, Traditional festivals |
| Sierra Nevada National Park | A major attraction for skiers and snowboarders in the winter, and hikers in the summer. Offers a variety of lodgings suitable for different types of travelers. | Ski slopes, Hiking trails, Natural parks, Flora and fauna diversity, Outdoor sports activities |
| Nearby Villages | Charming nearby villages like Bubión and Pampaneira offer authentic experiences and local festivals, appealing to guests looking for a more intimate and cultural stay. | Bubión, Pampaneira, Local markets, Traditional Andalusian cuisine, Cultural festivals |
| Alpujarras Region | The entire Alpujarras region is known for its unique architecture and extensive hiking routes, attracting those who want to explore Andalusian culture and nature. | Whitewashed villages, Mountain landscapes, Scenic hikes, Local cuisine, Cultural experiences |
| Local Wine Tours | The surrounding areas offer wine tours and tastings, attracting visitors interested in the local wine production and gastronomy. | Wine tastings, Vineyard tours, Local culinary experiences, Gastronomic festivals, Wine production education |
| Wellness Retreats | Increasing interest in wellness and retreat experiences in the region, making it attractive for guests looking for relaxation and rejuvenation in nature. | Yoga retreats, Spa treatments, Meditation sessions, Nature walks, Healthy cuisine |
Understanding Airbnb License Requirements & STR Laws in Capileira (2025)
Yes, Capileira, Andalusia, Spain enforces high STR regulations. Obtaining a license and ensuring compliance is almost certainly required according to current 2025 STR laws. Always verify the latest short term rental regulations and Airbnb license requirements directly with local government authorities for Capileira to ensure full compliance before hosting.
(Source: AirROI data, 2025, based on 79% licensed listings)
Top Performing Airbnb Properties in Capileira (2025)
Benchmark your potential! Explore examples of top-performing Airbnb properties in Capileirabased on Trailing Twelve Month (TTM) revenue. Analyze their characteristics, revenue, occupancy rate, and ADR to understand what drives success in this market.
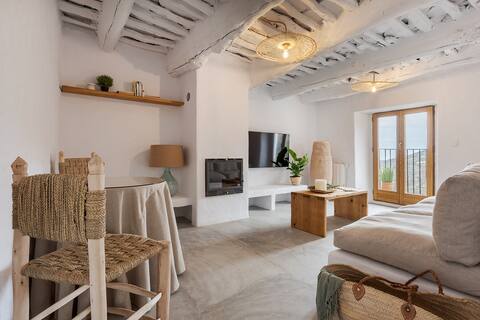
Casa Santiago House Boutique 3
Entire Place • 3 bedrooms

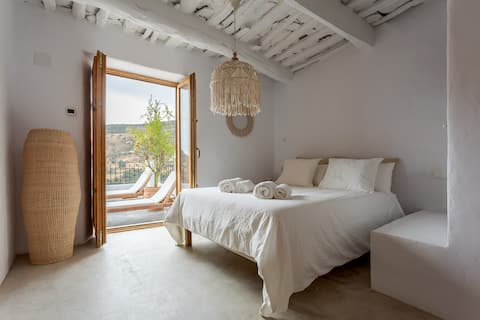
LA PARRA
Entire Place • 3 bedrooms
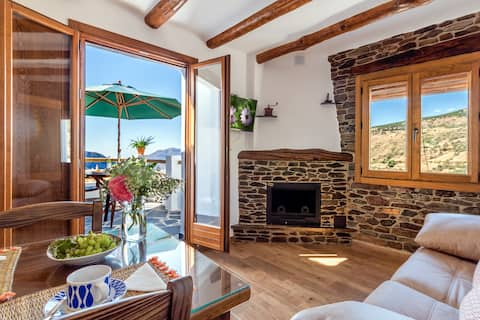
Casa Santiago House Boutique 2
Entire Place • 3 bedrooms

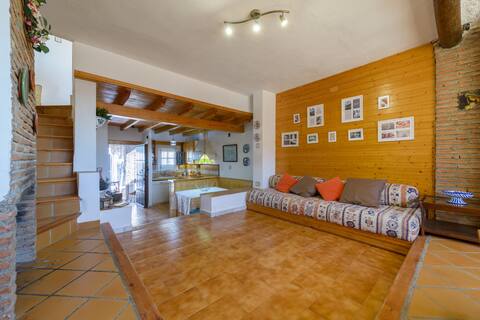
Casa Baraka Capileira
Entire Place • 2 bedrooms
Between Trails 3
Entire Place • 1 bedroom
Alojamiento rural "Cuatro Estaciones"
Entire Place • 4 bedrooms
Note: Performance varies based on location, size, amenities, seasonality, and management quality. Data reflects the past 12 months.
Top Performing Airbnb Hosts in Capileira (2025)
Learn from the best! This table showcases top-performing Airbnb hosts in Capileira based on the number of properties managed and estimated total revenue over the past year. Analyze their scale and performance metrics.
| Host Name | Properties | Grossing Revenue | Stay Reviews | Avg Rating |
|---|---|---|---|---|
| Elena | 5 | $78,229 | 222 | 4.97/5.0 |
| Alicia | 4 | $69,866 | 285 | 4.88/5.0 |
| Elena Del Carmen | 7 | $65,878 | 180 | 4.66/5.0 |
| Casa Santiago House Boutique | 3 | $64,781 | 19 | 3.25/5.0 |
| Alberto | 4 | $42,662 | 146 | 4.98/5.0 |
| Bea | 1 | $23,389 | 17 | 4.94/5.0 |
| Maricruz | 1 | $22,296 | 24 | 4.96/5.0 |
| Amanda & Andy | 1 | $19,483 | 119 | 4.92/5.0 |
| Jose Antonio | 1 | $17,545 | 70 | 4.91/5.0 |
| Host #13991419 | 1 | $17,249 | 0 | 0.00/5.0 |
Analyzing the strategies of top hosts, such as their property selection, pricing, and guest communication, can offer valuable lessons for optimizing your own Airbnb operations in Capileira.
Dive Deeper: Advanced Capileira STR Market Data (2025)
Ready to unlock more insights? AirROI provides access to advanced metrics and comprehensive Airbnb data for Capileira. Explore detailed analytics beyond this report to refine your investment strategy, optimize pricing, and maximize your vacation rental profits.
Explore Advanced MetricsCapileira Short-Term Rental Market Composition (2025): Property & Room Types
Room Type Distribution
Property Type Distribution
Market Composition Insights for Capileira
- The Capileira Airbnb market composition is heavily skewed towards Entire Home/Apt listings, which make up 79.1% of the 43 active rentals. This indicates strong guest preference for privacy and space.
- Looking at the property type distribution in Capileira, House properties are the most common (53.5%), reflecting the local real estate landscape.
- Houses represent a significant 53.5% portion, catering likely to families or larger groups.
- The presence of 9.3% Hotel/Boutique listings indicates integration with traditional hospitality.
- Smaller segments like outdoor/unique (combined 2.3%) offer potential for unique stay experiences.
Capileira Airbnb Room Capacity Analysis (2025): Bedroom Distribution
Distribution of Listings by Number of Bedrooms
Room Capacity Insights for Capileira
- The dominant room capacity in Capileira is 1 bedroom listings, making up 37.2% of the market. This suggests a strong demand for properties suitable for couples or solo travelers.
- Together, 1 bedroom and 2 bedrooms properties represent 69.8% of the active Airbnb listings in Capileira, indicating a high concentration in these sizes.
- A significant 28.0% of listings offer 3+ bedrooms, catering to larger groups and families seeking more space in Capileira.
Capileira Vacation Rental Guest Capacity Trends (2025)
Distribution of Listings by Guest Capacity
Guest Capacity Insights for Capileira
- The most common guest capacity trend in Capileira vacation rentals is listings accommodating 4 guests (27.9%). This suggests the primary traveler segment is likely small families or groups.
- Properties designed for 4 guests and 2 guests dominate the Capileira STR market, accounting for 55.8% of listings.
- 23.3% of properties accommodate 6+ guests, serving the market segment for larger families or group travel in Capileira.
- On average, properties in Capileira are equipped to host 3.5 guests.
Capileira Airbnb Booking Patterns (2025): Available vs. Booked Days
Available Days Distribution
Booked Days Distribution
Booking Pattern Insights for Capileira
- The most common availability pattern in Capileira falls within the 271-366 days range, representing 44.2% of listings. This suggests many properties have significant open periods on their calendars.
- Approximately 79.1% of listings show high availability (181+ days open annually), indicating potential for increased bookings or specific owner usage patterns.
- For booked days, the 91-180 days range is most frequent in Capileira (34.9%), reflecting common guest stay durations or potential owner blocking patterns.
- A notable 20.9% of properties secure long booking periods (181+ days booked per year), highlighting successful long-term rental strategies or significant owner usage.
Capileira Airbnb Minimum Stay Requirements Analysis
Distribution of Listings by Minimum Night Requirement
1 Night
4 listings
9.8% of total
2 Nights
24 listings
58.5% of total
3 Nights
1 listings
2.4% of total
4-6 Nights
1 listings
2.4% of total
30+ Nights
11 listings
26.8% of total
Key Insights
- The most prevalent minimum stay requirement in Capileira is 2 Nights, adopted by 58.5% of listings. This highlights the market's preference for shorter, flexible bookings.
- A strong majority (68.3%) of the Capileira Airbnb data shows acceptance of very short stays (1-2 nights), indicating a dynamic, high-turnover market.
- A significant segment (26.8%) caters to monthly stays (30+ nights) in Capileira, pointing to opportunities in the extended-stay market.
Recommendations
- Align with the market by considering a 2 Nights minimum stay, as 58.5% of Capileira hosts use this setting.
- If feasible, allowing 1-night stays, especially midweek or during low season, could capture last-minute bookings, as only 9.8% currently do.
- A 2-night minimum appears standard (58.5%). Consider this for weekends or peak periods.
- Explore offering discounts for stays of 30+ nights to attract the 26.8% of the market seeking extended stays.
- Adjust minimum nights based on seasonality – potentially shorter during low season and longer during peak demand periods in Capileira.
Capileira Airbnb Cancellation Policy Trends Analysis (2025)
Flexible
10 listings
27% of total
Moderate
18 listings
48.6% of total
Firm
3 listings
8.1% of total
Strict
6 listings
16.2% of total
Cancellation Policy Insights for Capileira
- The prevailing Airbnb cancellation policy trend in Capileira is Moderate, used by 48.6% of listings.
- The market strongly favors guest-friendly terms, with 75.6% of listings offering Flexible or Moderate policies. This suggests guests in Capileira may expect booking flexibility.
Recommendations for Hosts
- Consider adopting a Moderate policy to align with the 48.6% market standard in Capileira.
- Regularly review your cancellation policy against competitors and market demand shifts in Capileira.
Capileira STR Booking Lead Time Analysis (2025)
Average Booking Lead Time by Month
Booking Lead Time Insights for Capileira
- The overall average booking lead time for vacation rentals in Capileira is 68 days.
- Guests book furthest in advance for stays during June (average 96 days), likely coinciding with peak travel demand or local events.
- The shortest booking windows occur for stays in February (average 48 days), indicating more last-minute travel plans during this time.
- Seasonally, Spring (82 days avg.) sees the longest lead times, while Winter (55 days avg.) has the shortest, reflecting typical travel planning cycles.
Recommendations for Hosts
- Use the overall average lead time (68 days) as a baseline for your pricing and availability strategy in Capileira.
- For June stays, consider implementing length-of-stay discounts or slightly higher rates for bookings made less than 96 days out to capitalize on advance planning.
- Target marketing efforts for the Spring season well in advance (at least 82 days) to capture early planners.
- Monitor your own booking lead times against these Capileira averages to identify opportunities for dynamic pricing adjustments.
Popular & Essential Airbnb Amenities in Capileira (2025)
Amenity Prevalence
Amenity Insights for Capileira
- Essential amenities in Capileira that guests expect include: Essentials, Kitchen, Wifi. Lacking these (any) could significantly impact bookings.
- Popular amenities like Indoor fireplace, Hot water, Hangers are common but not universal. Offering these can provide a competitive edge.
Recommendations for Hosts
- Ensure your listing includes all essential amenities for Capileira: Essentials, Kitchen, Wifi.
- Prioritize adding missing essentials: Kitchen, Wifi.
- Consider adding popular differentiators like Indoor fireplace or Hot water to increase appeal.
- Highlight unique or less common amenities you offer (e.g., hot tub, dedicated workspace, EV charger) in your listing description and photos.
- Regularly check competitor amenities in Capileira to stay competitive.
Capileira Airbnb Guest Demographics & Profile Analysis (2025)
Guest Profile Summary for Capileira
- The typical guest profile for Airbnb in Capileira consists of a mix of domestic (36%) and international guests, with top international origins including United Kingdom, typically belonging to the Post-2000s (Gen Z/Alpha) group (50%), primarily speaking English or Spanish.
- Domestic travelers account for 36.2% of guests.
- Key international markets include Spain (36.2%) and United Kingdom (19.4%).
- Top languages spoken are English (39.8%) followed by Spanish (26.2%).
- A significant demographic segment is the Post-2000s (Gen Z/Alpha) group, representing 50% of guests.
Recommendations for Hosts
- Focus marketing internationally, particularly towards travelers from United Kingdom.
- Tailor amenities and listing descriptions to appeal to the dominant Post-2000s (Gen Z/Alpha) demographic (e.g., highlight fast WiFi, smart home features, local guides).
- Highlight unique local experiences or amenities relevant to the primary guest profile.
- Consider seasonal promotions aligned with peak travel times for key origin markets.
Nearby Short-Term Rental Market Comparison
How does the Capileira Airbnb market stack up against its neighbors? Compare key performance metrics like average monthly revenue, ADR, and occupancy rates in surrounding areas to understand the broader regional STR landscape.
| Market | Active Properties | Monthly Revenue | Daily Rate | Avg. Occupancy |
|---|---|---|---|---|
| Alhaurín de la Torre | 203 | $3,368 | $287.14 | 47% |
| Alhaurín el Grande | 281 | $3,026 | $290.27 | 45% |
| Cártama | 56 | $2,829 | $300.39 | 43% |
| Marbella | 4,981 | $2,613 | $321.31 | 43% |
| Málaga | 7,038 | $2,217 | $162.86 | 54% |
| Coín | 113 | $2,208 | $261.43 | 43% |
| Moclinejo | 10 | $2,155 | $231.35 | 51% |
| Villa de Otura | 18 | $2,141 | $299.92 | 34% |
| Carcabuey | 30 | $2,139 | $215.30 | 32% |
| Almogía | 47 | $2,115 | $261.12 | 38% |