Armilla Airbnb Market Analysis 2025: Short Term Rental Data & Vacation Rental Statistics in Andalusia, Spain
Is Airbnb profitable in Armilla in 2025? Explore comprehensive Airbnb analytics for Armilla, Andalusia, Spain to uncover income potential. This 2025 STR market report for Armilla, based on AirROI data from April 2024 to March 2025, reveals key trends in the niche market of 31 active listings.
Whether you're considering an Airbnb investment in Armilla, optimizing your existing vacation rental, or exploring rental arbitrage opportunities, understanding the Armilla Airbnb data is crucial. Navigating the high regulation landscape is key to maximizing your short term rental income potential. Let's dive into the specifics.
Key Armilla Airbnb Performance Metrics Overview
Monthly Airbnb Revenue Variations & Income Potential in Armilla (2025)
Understanding the monthly revenue variations for Airbnb listings in Armilla is key to maximizing your short term rental income potential. Seasonality significantly impacts earnings. Our analysis, based on data from the past 12 months, shows that the peak revenue month for STRs in Armilla is typically April, while November often presents the lowest earnings, highlighting opportunities for strategic pricing adjustments during shoulder and low seasons. Explore the typical Airbnb income in Armilla across different performance tiers:
- Best-in-class properties (Top 10%) achieve $2,586+ monthly, often utilizing dynamic pricing and superior guest experiences.
- Strong performing properties (Top 25%) earn $1,959 or more, indicating effective management and desirable locations/amenities.
- Typical properties (Median) generate around $1,293 per month, representing the average market performance.
- Entry-level properties (Bottom 25%) see earnings around $760, often with potential for optimization.
Average Monthly Airbnb Earnings Trend in Armilla
Armilla Airbnb Occupancy Rate Trends (2025)
Maximize your bookings by understanding the Armilla STR occupancy trends. Seasonal demand shifts significantly influence how often properties are booked. Typically, Augustsees the highest demand (peak season occupancy), while December experiences the lowest (low season). Effective strategies, like adjusting minimum stays or offering promotions, can boost occupancy during slower periods. Here's how different property tiers perform in Armilla:
- Best-in-class properties (Top 10%) achieve 83%+ occupancy, indicating high desirability and potentially optimized availability.
- Strong performing properties (Top 25%) maintain 69% or higher occupancy, suggesting good market fit and guest satisfaction.
- Typical properties (Median) have an occupancy rate around 49%.
- Entry-level properties (Bottom 25%) average 26% occupancy, potentially facing higher vacancy.
Average Monthly Occupancy Rate Trend in Armilla
Average Daily Rate (ADR) Airbnb Trends in Armilla (2025)
Effective short term rental pricing strategy in Armilla involves understanding monthly ADR fluctuations. The Average Daily Rate (ADR) for Airbnb in Armilla typically peaks in December and dips lowest during August. Leveraging Airbnb dynamic pricing tools or strategies based on this seasonality can significantly boost revenue. Here's a look at the typical nightly rates achieved:
- Best-in-class properties (Top 10%) command rates of $155+ per night, often due to premium features or locations.
- Strong performing properties (Top 25%) achieve nightly rates of $128 or more.
- Typical properties (Median) charge around $95 per night.
- Entry-level properties (Bottom 25%) earn around $67 per night.
Average Daily Rate (ADR) Trend by Month in Armilla
Get Live Armilla Market Intelligence 👇

Explore Real-time Analytics
Airbnb Seasonality Analysis & Trends in Armilla (2025)
Peak Season (April, January, August)
- Revenue averages $1,881 per month
- Occupancy rates average 55.8%
- Daily rates average $104
Shoulder Season
- Revenue averages $1,505 per month
- Occupancy maintains around 48.6%
- Daily rates hold near $104
Low Season (February, September, November)
- Revenue drops to average $1,216 per month
- Occupancy decreases to average 42.2%
- Daily rates adjust to average $102
Seasonality Insights for Armilla
- The Airbnb seasonality in Armilla shows moderate seasonality with distinct peak and low periods. While the sections above show seasonal averages, it's also insightful to look at the extremes:
- During the high season, the absolute peak month showcases Armilla's highest earning potential, with monthly revenues capable of climbing to $2,109, occupancy reaching a high of 63.5%, and ADRs peaking at $120.
- Conversely, the slowest single month of the year, typically falling within the low season, marks the market's lowest point. In this month, revenue might dip to $1,160, occupancy could drop to 40.0%, and ADRs may adjust down to $97.
- Understanding both the seasonal averages and these monthly peaks and troughs in revenue, occupancy, and ADR is crucial for maximizing your Airbnb profit potential in Armilla.
Seasonal Strategies for Maximizing Profit
- Peak Season: Maximize revenue through premium pricing and potentially longer minimum stays. Ensure high availability.
- Low Season: Offer competitive pricing, special promotions (e.g., extended stay discounts), and flexible cancellation policies. Target off-season travelers like remote workers or budget-conscious guests.
- Shoulder Seasons: Implement dynamic pricing that balances peak and low rates. Target weekend travelers or specific events. Offer slightly more flexible terms than peak season.
- Regularly analyze your own performance against these Armilla seasonality benchmarks and adjust your pricing and availability strategy accordingly.
Best Areas for Airbnb Investment in Armilla (2025)
Exploring the top neighborhoods for short-term rentals in Armilla? This section highlights key areas, outlining why they are attractive for hosts and guests, along with notable local attractions. Consider these locations based on your target guest profile and investment strategy.
| Neighborhood / Area | Why Host Here? (Target Guests & Appeal) | Key Attractions & Landmarks |
|---|---|---|
| Centro de Armilla | The heart of Armilla with local cafes, shops, and close access to Granada. It attracts tourists wanting to explore the local culture and history while being near Granada's attractions. | Parque de la Ermita, Plaza de las Culturas, Shopping centers, Local restaurants, Cultural events |
| Las Gabias | A suburban area that offers a tranquil environment and easy access to the Sierra Nevada, ideal for those looking to escape the city while still being close to amenities. | Cerro de la Cruz, Sierra Nevada views, Local hiking trails, Parks, Community events |
| Albolote | A growing town with a variety of amenities and close access to Granada. Popular for families and travelers who prefer a quieter atmosphere with city access. | Parque de Albolote, Historic sites, Local marketplaces, Sierra de Huetor |
| Churriana de la Vega | A charming town with a mix of urban and rural feel, great for those seeking a relaxing getaway while still being within reach of Granada's attractions. | Local parks, Cultural heritage sites, Traditional Spanish cuisine, Walking trails |
| Otura | Known for its peaceful living and proximity to nature, Otura is great for those looking to explore the outdoors and enjoy a slower pace while being near Granada. | Natural parks, Outdoor activities, Local vineyards, Historic churches |
| Peligros | A quiet residential area perfect for families and longer stays, with good transport links to Granada and nearby attractions. | Local parks, Cultural sites, Family activities, Community events |
| Armilla Norte | A quieter part of Armilla with easy access to amenities and close proximity to public transport, making it ideal for visitors who prefer a more laid-back environment. | Neighborhood parks, Local shops, Cafes, Access to public transport |
| Las Torres | A small neighborhood with a rustic charm and local community feel. It offers a unique glimpse into Andalusian life while being conveniently close to larger urban areas. | Historical landmarks, Local festivals, Walking paths, Traditional markets |
Understanding Airbnb License Requirements & STR Laws in Armilla (2025)
Yes, Armilla, Andalusia, Spain enforces high STR regulations. Obtaining a license and ensuring compliance is almost certainly required according to current 2025 STR laws. Always verify the latest short term rental regulations and Airbnb license requirements directly with local government authorities for Armilla to ensure full compliance before hosting.
(Source: AirROI data, 2025, based on 77% licensed listings)
Top Performing Airbnb Properties in Armilla (2025)
Benchmark your potential! Explore examples of top-performing Airbnb properties in Armillabased on Trailing Twelve Month (TTM) revenue. Analyze their characteristics, revenue, occupancy rate, and ADR to understand what drives success in this market.
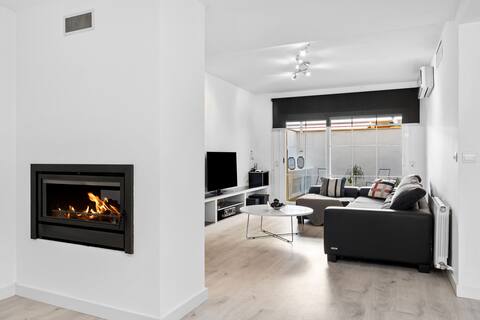
Casa Sierra Nevada
Entire Place • 3 bedrooms
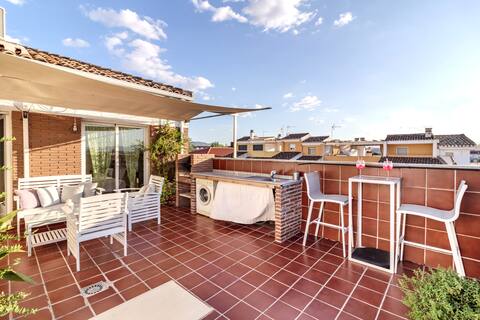
WOW!!! 5*PRIVATE TERRACE+BBQ, METRO, PARKING, MALL
Entire Place • 2 bedrooms
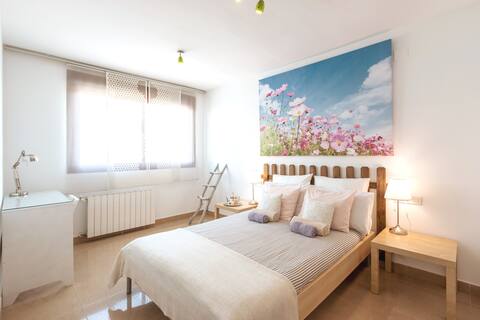
HOUSE. IDEAL BASE. PROFESIONAL CLEANNING
Entire Place • 3 bedrooms

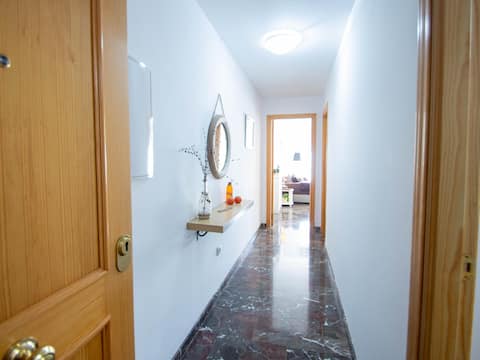
New, Attic Granada, Private Parking and Solarium.
Entire Place • 1 bedroom
Moon Apartment
Entire Place • 2 bedrooms
Casa Nevada en Granada
Entire Place • 4 bedrooms
Note: Performance varies based on location, size, amenities, seasonality, and management quality. Data reflects the past 12 months.
Top Performing Airbnb Hosts in Armilla (2025)
Learn from the best! This table showcases top-performing Airbnb hosts in Armilla based on the number of properties managed and estimated total revenue over the past year. Analyze their scale and performance metrics.
| Host Name | Properties | Grossing Revenue | Stay Reviews | Avg Rating |
|---|---|---|---|---|
| Javier | 1 | $41,240 | 7 | 4.43/5.0 |
| Almudena | 2 | $39,252 | 24 | 4.54/5.0 |
| Victoria | 1 | $25,877 | 157 | 4.84/5.0 |
| Paz | 1 | $24,162 | 77 | 4.90/5.0 |
| Alvaro | 1 | $23,144 | 58 | 4.98/5.0 |
| Mar | 1 | $21,965 | 42 | 4.95/5.0 |
| Sakina | 1 | $21,342 | 124 | 4.85/5.0 |
| Anguiano José | 1 | $20,652 | 41 | 4.98/5.0 |
| Dairo | 1 | $17,933 | 10 | 4.90/5.0 |
| Host #47044541 | 1 | $16,438 | 10 | 5.00/5.0 |
Analyzing the strategies of top hosts, such as their property selection, pricing, and guest communication, can offer valuable lessons for optimizing your own Airbnb operations in Armilla.
Dive Deeper: Advanced Armilla STR Market Data (2025)
Ready to unlock more insights? AirROI provides access to advanced metrics and comprehensive Airbnb data for Armilla. Explore detailed analytics beyond this report to refine your investment strategy, optimize pricing, and maximize your vacation rental profits.
Explore Advanced MetricsArmilla Short-Term Rental Market Composition (2025): Property & Room Types
Room Type Distribution
Property Type Distribution
Market Composition Insights for Armilla
- The Armilla Airbnb market composition is heavily skewed towards Entire Home/Apt listings, which make up 100% of the 31 active rentals. This indicates strong guest preference for privacy and space.
- Looking at the property type distribution in Armilla, Apartment/Condo properties are the most common (74.2%), reflecting the local real estate landscape.
- Houses represent a significant 25.8% portion, catering likely to families or larger groups.
Armilla Airbnb Room Capacity Analysis (2025): Bedroom Distribution
Distribution of Listings by Number of Bedrooms
Room Capacity Insights for Armilla
- The dominant room capacity in Armilla is 2 bedrooms listings, making up 45.2% of the market. This suggests a strong demand for properties suitable for couples or solo travelers.
- Together, 2 bedrooms and 3 bedrooms properties represent 74.2% of the active Airbnb listings in Armilla, indicating a high concentration in these sizes.
- A significant 35.5% of listings offer 3+ bedrooms, catering to larger groups and families seeking more space in Armilla.
Armilla Vacation Rental Guest Capacity Trends (2025)
Distribution of Listings by Guest Capacity
Guest Capacity Insights for Armilla
- The most common guest capacity trend in Armilla vacation rentals is listings accommodating 4 guests (45.2%). This suggests the primary traveler segment is likely small families or groups.
- Properties designed for 4 guests and 8+ guests dominate the Armilla STR market, accounting for 61.3% of listings.
- 32.3% of properties accommodate 6+ guests, serving the market segment for larger families or group travel in Armilla.
- On average, properties in Armilla are equipped to host 4.9 guests.
Armilla Airbnb Booking Patterns (2025): Available vs. Booked Days
Available Days Distribution
Booked Days Distribution
Booking Pattern Insights for Armilla
- The most common availability pattern in Armilla falls within the 91-180 days range, representing 32.3% of listings. This suggests many properties have significant open periods on their calendars.
- Approximately 58.0% of listings show high availability (181+ days open annually), indicating potential for increased bookings or specific owner usage patterns.
- For booked days, the 91-180 days range is most frequent in Armilla (32.3%), reflecting common guest stay durations or potential owner blocking patterns.
- A notable 42.0% of properties secure long booking periods (181+ days booked per year), highlighting successful long-term rental strategies or significant owner usage.
Armilla Airbnb Minimum Stay Requirements Analysis
Distribution of Listings by Minimum Night Requirement
1 Night
4 listings
14.8% of total
2 Nights
14 listings
51.9% of total
3 Nights
1 listings
3.7% of total
7-29 Nights
1 listings
3.7% of total
30+ Nights
7 listings
25.9% of total
Key Insights
- The most prevalent minimum stay requirement in Armilla is 2 Nights, adopted by 51.9% of listings. This highlights the market's preference for shorter, flexible bookings.
- A strong majority (66.7%) of the Armilla Airbnb data shows acceptance of very short stays (1-2 nights), indicating a dynamic, high-turnover market.
- A significant segment (25.9%) caters to monthly stays (30+ nights) in Armilla, pointing to opportunities in the extended-stay market.
Recommendations
- Align with the market by considering a 2 Nights minimum stay, as 51.9% of Armilla hosts use this setting.
- If feasible, allowing 1-night stays, especially midweek or during low season, could capture last-minute bookings, as only 14.8% currently do.
- A 2-night minimum appears standard (51.9%). Consider this for weekends or peak periods.
- Explore offering discounts for stays of 30+ nights to attract the 25.9% of the market seeking extended stays.
- Adjust minimum nights based on seasonality – potentially shorter during low season and longer during peak demand periods in Armilla.
Armilla Airbnb Cancellation Policy Trends Analysis (2025)
Flexible
6 listings
24% of total
Moderate
13 listings
52% of total
Firm
5 listings
20% of total
Strict
1 listings
4% of total
Cancellation Policy Insights for Armilla
- The prevailing Airbnb cancellation policy trend in Armilla is Moderate, used by 52% of listings.
- The market strongly favors guest-friendly terms, with 76.0% of listings offering Flexible or Moderate policies. This suggests guests in Armilla may expect booking flexibility.
- Strict cancellation policies are quite rare (4%), potentially making listings with this policy less competitive unless justified by high demand or property type.
Recommendations for Hosts
- Consider adopting a Moderate policy to align with the 52% market standard in Armilla.
- Using a Strict policy might deter some guests, as only 4% of listings use it. Evaluate if potential revenue protection outweighs possible lower booking rates.
- Regularly review your cancellation policy against competitors and market demand shifts in Armilla.
Armilla STR Booking Lead Time Analysis (2025)
Average Booking Lead Time by Month
Booking Lead Time Insights for Armilla
- The overall average booking lead time for vacation rentals in Armilla is 43 days.
- Guests book furthest in advance for stays during August (average 76 days), likely coinciding with peak travel demand or local events.
- The shortest booking windows occur for stays in March (average 30 days), indicating more last-minute travel plans during this time.
- Seasonally, Summer (61 days avg.) sees the longest lead times, while Winter (45 days avg.) has the shortest, reflecting typical travel planning cycles.
Recommendations for Hosts
- Use the overall average lead time (43 days) as a baseline for your pricing and availability strategy in Armilla.
- For August stays, consider implementing length-of-stay discounts or slightly higher rates for bookings made less than 76 days out to capitalize on advance planning.
- Target marketing efforts for the Summer season well in advance (at least 61 days) to capture early planners.
- Monitor your own booking lead times against these Armilla averages to identify opportunities for dynamic pricing adjustments.
Popular & Essential Airbnb Amenities in Armilla (2025)
Amenity Prevalence
Amenity Insights for Armilla
- Essential amenities in Armilla that guests expect include: Kitchen, TV, Air conditioning, Washer, Hot water, Wifi. Lacking these (any) could significantly impact bookings.
- Popular amenities like Refrigerator, Heating, Hangers are common but not universal. Offering these can provide a competitive edge.
Recommendations for Hosts
- Ensure your listing includes all essential amenities for Armilla: Kitchen, TV, Air conditioning, Washer, Hot water, Wifi.
- Prioritize adding missing essentials: Washer, Hot water, Wifi.
- Consider adding popular differentiators like Refrigerator or Heating to increase appeal.
- Highlight unique or less common amenities you offer (e.g., hot tub, dedicated workspace, EV charger) in your listing description and photos.
- Regularly check competitor amenities in Armilla to stay competitive.
Armilla Airbnb Guest Demographics & Profile Analysis (2025)
Guest Profile Summary for Armilla
- The typical guest profile for Airbnb in Armilla consists of a mix of domestic (55%) and international guests, often arriving from nearby Madrid, typically belonging to the Post-2000s (Gen Z/Alpha) group (50%), primarily speaking Spanish or English.
- Domestic travelers account for 55.4% of guests.
- Key international markets include Spain (55.4%) and France (15.4%).
- Top languages spoken are Spanish (33.2%) followed by English (30.9%).
- A significant demographic segment is the Post-2000s (Gen Z/Alpha) group, representing 50% of guests.
Recommendations for Hosts
- Balance marketing efforts between domestic and international channels based on the guest mix.
- Tailor amenities and listing descriptions to appeal to the dominant Post-2000s (Gen Z/Alpha) demographic (e.g., highlight fast WiFi, smart home features, local guides).
- Highlight unique local experiences or amenities relevant to the primary guest profile.
- Consider seasonal promotions aligned with peak travel times for key origin markets.
Nearby Short-Term Rental Market Comparison
How does the Armilla Airbnb market stack up against its neighbors? Compare key performance metrics like average monthly revenue, ADR, and occupancy rates in surrounding areas to understand the broader regional STR landscape.
| Market | Active Properties | Monthly Revenue | Daily Rate | Avg. Occupancy |
|---|---|---|---|---|
| Alhaurín de la Torre | 203 | $3,368 | $287.14 | 47% |
| Alhaurín el Grande | 281 | $3,026 | $290.27 | 45% |
| Cártama | 56 | $2,829 | $300.39 | 43% |
| Marbella | 4,981 | $2,613 | $321.31 | 43% |
| Málaga | 7,038 | $2,217 | $162.86 | 54% |
| Coín | 113 | $2,208 | $261.43 | 43% |
| Moclinejo | 10 | $2,155 | $231.35 | 51% |
| Villa de Otura | 18 | $2,141 | $299.92 | 34% |
| Carcabuey | 30 | $2,139 | $215.30 | 32% |
| Almogía | 47 | $2,115 | $261.12 | 38% |