Tholen Airbnb Market Analysis 2025: Short Term Rental Data & Vacation Rental Statistics in Zeeland, Netherlands
Is Airbnb profitable in Tholen in 2025? Explore comprehensive Airbnb analytics for Tholen, Zeeland, Netherlands to uncover income potential. This 2025 STR market report for Tholen, based on AirROI data from April 2024 to March 2025, reveals key trends in the niche market of 29 active listings.
Whether you're considering an Airbnb investment in Tholen, optimizing your existing vacation rental, or exploring rental arbitrage opportunities, understanding the Tholen Airbnb data is crucial. Leveraging the low regulation environment is key to maximizing your short term rental income potential. Let's dive into the specifics.
Key Tholen Airbnb Performance Metrics Overview
Monthly Airbnb Revenue Variations & Income Potential in Tholen (2025)
Understanding the monthly revenue variations for Airbnb listings in Tholen is key to maximizing your short term rental income potential. Seasonality significantly impacts earnings. Our analysis, based on data from the past 12 months, shows that the peak revenue month for STRs in Tholen is typically May, while February often presents the lowest earnings, highlighting opportunities for strategic pricing adjustments during shoulder and low seasons. Explore the typical Airbnb income in Tholen across different performance tiers:
- Best-in-class properties (Top 10%) achieve $4,613+ monthly, often utilizing dynamic pricing and superior guest experiences.
- Strong performing properties (Top 25%) earn $3,190 or more, indicating effective management and desirable locations/amenities.
- Typical properties (Median) generate around $2,228 per month, representing the average market performance.
- Entry-level properties (Bottom 25%) see earnings around $1,279, often with potential for optimization.
Average Monthly Airbnb Earnings Trend in Tholen
Tholen Airbnb Occupancy Rate Trends (2025)
Maximize your bookings by understanding the Tholen STR occupancy trends. Seasonal demand shifts significantly influence how often properties are booked. Typically, Aprilsees the highest demand (peak season occupancy), while January experiences the lowest (low season). Effective strategies, like adjusting minimum stays or offering promotions, can boost occupancy during slower periods. Here's how different property tiers perform in Tholen:
- Best-in-class properties (Top 10%) achieve 73%+ occupancy, indicating high desirability and potentially optimized availability.
- Strong performing properties (Top 25%) maintain 46% or higher occupancy, suggesting good market fit and guest satisfaction.
- Typical properties (Median) have an occupancy rate around 18%.
- Entry-level properties (Bottom 25%) average 7% occupancy, potentially facing higher vacancy.
Average Monthly Occupancy Rate Trend in Tholen
Average Daily Rate (ADR) Airbnb Trends in Tholen (2025)
Effective short term rental pricing strategy in Tholen involves understanding monthly ADR fluctuations. The Average Daily Rate (ADR) for Airbnb in Tholen typically peaks in August and dips lowest during January. Leveraging Airbnb dynamic pricing tools or strategies based on this seasonality can significantly boost revenue. Here's a look at the typical nightly rates achieved:
- Best-in-class properties (Top 10%) command rates of $730+ per night, often due to premium features or locations.
- Strong performing properties (Top 25%) achieve nightly rates of $584 or more.
- Typical properties (Median) charge around $397 per night.
- Entry-level properties (Bottom 25%) earn around $182 per night.
Average Daily Rate (ADR) Trend by Month in Tholen
Get Live Tholen Market Intelligence 👇

Explore Real-time Analytics
Airbnb Seasonality Analysis & Trends in Tholen (2025)
Peak Season (May, August, July)
- Revenue averages $4,248 per month
- Occupancy rates average 34.0%
- Daily rates average $465
Shoulder Season
- Revenue averages $2,411 per month
- Occupancy maintains around 28.7%
- Daily rates hold near $427
Low Season (February, March, November)
- Revenue drops to average $1,387 per month
- Occupancy decreases to average 27.1%
- Daily rates adjust to average $372
Seasonality Insights for Tholen
- The Airbnb seasonality in Tholen shows highly seasonal trends requiring careful strategy. While the sections above show seasonal averages, it's also insightful to look at the extremes:
- During the high season, the absolute peak month showcases Tholen's highest earning potential, with monthly revenues capable of climbing to $4,470, occupancy reaching a high of 43.8%, and ADRs peaking at $490.
- Conversely, the slowest single month of the year, typically falling within the low season, marks the market's lowest point. In this month, revenue might dip to $1,353, occupancy could drop to 19.6%, and ADRs may adjust down to $349.
- Understanding both the seasonal averages and these monthly peaks and troughs in revenue, occupancy, and ADR is crucial for maximizing your Airbnb profit potential in Tholen.
Seasonal Strategies for Maximizing Profit
- Peak Season: Maximize revenue through premium pricing and potentially longer minimum stays. Ensure high availability.
- Low Season: Offer competitive pricing, special promotions (e.g., extended stay discounts), and flexible cancellation policies. Target off-season travelers like remote workers or budget-conscious guests.
- Shoulder Seasons: Implement dynamic pricing that balances peak and low rates. Target weekend travelers or specific events. Offer slightly more flexible terms than peak season.
- Regularly analyze your own performance against these Tholen seasonality benchmarks and adjust your pricing and availability strategy accordingly.
Best Areas for Airbnb Investment in Tholen (2025)
Exploring the top neighborhoods for short-term rentals in Tholen? This section highlights key areas, outlining why they are attractive for hosts and guests, along with notable local attractions. Consider these locations based on your target guest profile and investment strategy.
| Neighborhood / Area | Why Host Here? (Target Guests & Appeal) | Key Attractions & Landmarks |
|---|---|---|
| Tholen Town | The quaint and historic heart of Tholen, perfect for visitors interested in local culture and history. Offers charming streets, local shops, and restaurants leading to the waterfront. | St. Lievense Church, Tholen Town Museum, Dijkhuis Tholen, Canal walks, Local markets |
| Sint-Annaland | A picturesque village located on the coast, ideal for guests looking for beachside accommodation and water-based activities. Offers a peaceful retreat with beautiful views. | Sint-Annaland Marina, Zuiddijk Hiking Path, Local fishing spots, Beach access, Water sports activities |
| Schijf | This rural area surrounding Tholen is perfect for those looking for a countryside escape. Offers nature trails and opportunities for cycling and hiking. | Schijf Nature Reserve, Cycle routes through Zeeland, Bird watching, Tranquil landscapes, Local farms |
| Oude Tonge | A serene village with scenic views of the water, ideally situated for fishing enthusiasts and those who enjoy quiet, rural getaways. | Oude Tonge Harbor, Fishing spots, Beautiful countryside, Small local cafes, Waterfront views |
| Halsteren | Located near Tholen, Halsteren offers guest houses and farm stays suitable for families looking for a relaxed atmosphere with access to nature. | Halsteren Nature Park, Local fairs and markets, Family-friendly activities, Biking paths, Nearby forests |
| Dinteloord | Dinteloord is known for its community vibe and allows visitors to enjoy the local life in Tholen while being close to larger attractions. | Dinteloord Village Center, Local shops and restaurants, Cultural events, Community activities, Natural landscapes |
| Tholen Islands | The islands around Tholen are a wonderful escape for those seeking outdoor adventure, ideal for kayaking, sailing, and exploring nature. | Island hopping, Kayaking, Bird watching, Atlantic beaches, Scenic views |
| Moerdijk | Just a short drive from Tholen, this area is ideal for guests wanting an urban experience while being close to nature. It offers parks and waterfronts. | Moerdijk Park, Waterfront promenades, Local dining, Cultural events, Shopping areas |
Understanding Airbnb License Requirements & STR Laws in Tholen (2025)
While Tholen, Zeeland, Netherlands currently shows low STR regulations, specific Airbnb license requirements might still exist or change. Always verify the latest short term rental regulations and Airbnb license requirements directly with local government authorities for Tholen to ensure full compliance before hosting.
(Source: AirROI data, 2025, finding no licensed listings among those analyzed)
Top Performing Airbnb Properties in Tholen (2025)
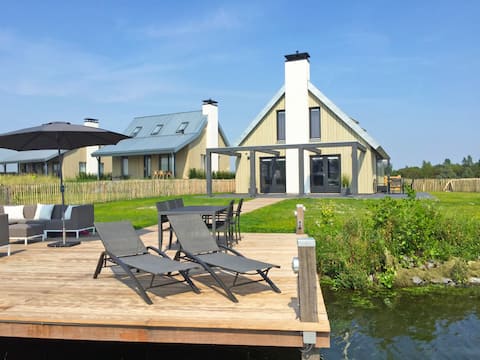
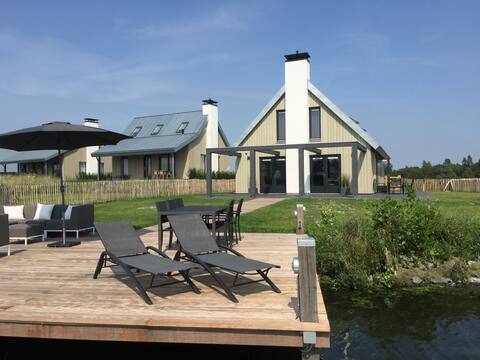
Benchmark your potential! Explore examples of top-performing Airbnb properties in Tholenbased on Trailing Twelve Month (TTM) revenue. Analyze their characteristics, revenue, occupancy rate, and ADR to understand what drives success in this market.

Modern lodge in national park
Entire Place • 4 bedrooms

Cozy & Luxury Vacation Home Tholen
Entire Place • 1 bedroom
Oesterdam Resort by Interhome
Entire Place • 5 bedrooms

Unique overnight stay in Logement Cornelia, Zeeland
Entire Place • 1 bedroom
Wellness lodge with a sunshower
Entire Place • 5 bedrooms
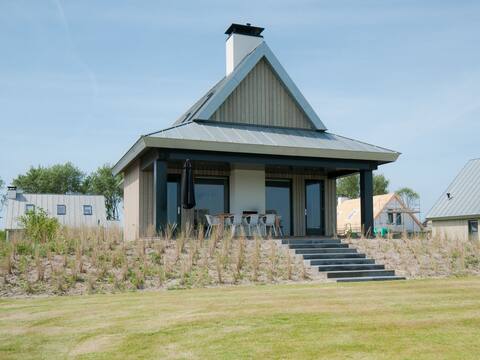
Modern design lodge directly at the water
Entire Place • 4 bedrooms
Note: Performance varies based on location, size, amenities, seasonality, and management quality. Data reflects the past 12 months.
Top Performing Airbnb Hosts in Tholen (2025)
Learn from the best! This table showcases top-performing Airbnb hosts in Tholen based on the number of properties managed and estimated total revenue over the past year. Analyze their scale and performance metrics.
| Host Name | Properties | Grossing Revenue | Stay Reviews | Avg Rating |
|---|---|---|---|---|
| Diana - BELVILLA | 13 | $281,688 | 4 | 0.35/5.0 |
| Angela - Interhome | 4 | $82,544 | 23 | 3.56/5.0 |
| Johan&Mariska | 1 | $47,799 | 79 | 4.94/5.0 |
| Nadine - Interhome | 2 | $47,097 | 8 | 4.70/5.0 |
| Johanna | 1 | $32,982 | 59 | 4.95/5.0 |
| Jaap | 1 | $27,821 | 13 | 5.00/5.0 |
| Marlita | 1 | $26,975 | 115 | 4.93/5.0 |
| Sytske | 1 | $24,560 | 206 | 4.90/5.0 |
| Leanne | 1 | $23,415 | 370 | 4.98/5.0 |
| Host #440708912 | 2 | $15,569 | 1 | 0.00/5.0 |
Analyzing the strategies of top hosts, such as their property selection, pricing, and guest communication, can offer valuable lessons for optimizing your own Airbnb operations in Tholen.
Dive Deeper: Advanced Tholen STR Market Data (2025)
Ready to unlock more insights? AirROI provides access to advanced metrics and comprehensive Airbnb data for Tholen. Explore detailed analytics beyond this report to refine your investment strategy, optimize pricing, and maximize your vacation rental profits.
Explore Advanced MetricsTholen Short-Term Rental Market Composition (2025): Property & Room Types
Room Type Distribution
Property Type Distribution
Market Composition Insights for Tholen
- The Tholen Airbnb market composition is heavily skewed towards Entire Home/Apt listings, which make up 89.7% of the 29 active rentals. This indicates strong guest preference for privacy and space.
- Looking at the property type distribution in Tholen, House properties are the most common (75.9%), reflecting the local real estate landscape.
- Houses represent a significant 75.9% portion, catering likely to families or larger groups.
- The presence of 10.3% Hotel/Boutique listings indicates integration with traditional hospitality.
- Smaller segments like outdoor/unique (combined 3.4%) offer potential for unique stay experiences.
Tholen Airbnb Room Capacity Analysis (2025): Bedroom Distribution
Distribution of Listings by Number of Bedrooms
Room Capacity Insights for Tholen
- The dominant room capacity in Tholen is 1 bedroom listings, making up 24.1% of the market. This suggests a strong demand for properties suitable for couples or solo travelers.
- Together, 1 bedroom and 4 bedrooms properties represent 44.8% of the active Airbnb listings in Tholen, indicating a high concentration in these sizes.
- A significant 55.1% of listings offer 3+ bedrooms, catering to larger groups and families seeking more space in Tholen.
Tholen Vacation Rental Guest Capacity Trends (2025)
Distribution of Listings by Guest Capacity
Guest Capacity Insights for Tholen
- The most common guest capacity trend in Tholen vacation rentals is listings accommodating 8+ guests (37.9%). This suggests the primary traveler segment is likely larger groups.
- Properties designed for 8+ guests and 6 guests dominate the Tholen STR market, accounting for 55.1% of listings.
- 55.1% of properties accommodate 6+ guests, serving the market segment for larger families or group travel in Tholen.
- On average, properties in Tholen are equipped to host 5.3 guests.
Tholen Airbnb Booking Patterns (2025): Available vs. Booked Days
Available Days Distribution
Booked Days Distribution
Booking Pattern Insights for Tholen
- The most common availability pattern in Tholen falls within the 271-366 days range, representing 72.4% of listings. This suggests many properties have significant open periods on their calendars.
- Approximately 79.3% of listings show high availability (181+ days open annually), indicating potential for increased bookings or specific owner usage patterns.
- For booked days, the 1-30 days range is most frequent in Tholen (41.4%), reflecting common guest stay durations or potential owner blocking patterns.
- A notable 20.7% of properties secure long booking periods (181+ days booked per year), highlighting successful long-term rental strategies or significant owner usage.
Tholen Airbnb Minimum Stay Requirements Analysis
Distribution of Listings by Minimum Night Requirement
1 Night
14 listings
56% of total
2 Nights
5 listings
20% of total
3 Nights
3 listings
12% of total
4-6 Nights
1 listings
4% of total
30+ Nights
2 listings
8% of total
Key Insights
- The most prevalent minimum stay requirement in Tholen is 1 Night, adopted by 56% of listings. This highlights the market's preference for shorter, flexible bookings.
- A strong majority (76.0%) of the Tholen Airbnb data shows acceptance of very short stays (1-2 nights), indicating a dynamic, high-turnover market.
Recommendations
- Align with the market by considering a 1 Night minimum stay, as 56% of Tholen hosts use this setting.
- Explore offering discounts for stays of 30+ nights to attract the 8% of the market seeking extended stays.
- Adjust minimum nights based on seasonality – potentially shorter during low season and longer during peak demand periods in Tholen.
Tholen Airbnb Cancellation Policy Trends Analysis (2025)
Super Strict 30 Days
1 listings
7.1% of total
Flexible
2 listings
14.3% of total
Moderate
3 listings
21.4% of total
Firm
7 listings
50% of total
Strict
1 listings
7.1% of total
Cancellation Policy Insights for Tholen
- The prevailing Airbnb cancellation policy trend in Tholen is Firm, used by 50% of listings.
- A majority (57.1%) of hosts in Tholen utilize Firm or Strict policies, indicating a market where hosts prioritize booking security.
- Strict cancellation policies are quite rare (7.1%), potentially making listings with this policy less competitive unless justified by high demand or property type.
Recommendations for Hosts
- Consider adopting a Firm policy to align with the 50% market standard in Tholen.
- Using a Strict policy might deter some guests, as only 7.1% of listings use it. Evaluate if potential revenue protection outweighs possible lower booking rates.
- Regularly review your cancellation policy against competitors and market demand shifts in Tholen.
Tholen STR Booking Lead Time Analysis (2025)
Average Booking Lead Time by Month
Booking Lead Time Insights for Tholen
- The overall average booking lead time for vacation rentals in Tholen is 37 days.
- Guests book furthest in advance for stays during May (average 84 days), likely coinciding with peak travel demand or local events.
- The shortest booking windows occur for stays in November (average 22 days), indicating more last-minute travel plans during this time.
- Seasonally, Spring (51 days avg.) sees the longest lead times, while Summer (34 days avg.) has the shortest, reflecting typical travel planning cycles.
Recommendations for Hosts
- Use the overall average lead time (37 days) as a baseline for your pricing and availability strategy in Tholen.
- For May stays, consider implementing length-of-stay discounts or slightly higher rates for bookings made less than 84 days out to capitalize on advance planning.
- Target marketing efforts for the Spring season well in advance (at least 51 days) to capture early planners.
- Monitor your own booking lead times against these Tholen averages to identify opportunities for dynamic pricing adjustments.
Popular & Essential Airbnb Amenities in Tholen (2025)
Amenity Prevalence
Amenity Insights for Tholen
- Essential amenities in Tholen that guests expect include: Wifi, Heating, Smoke alarm, Kitchen. Lacking these (any) could significantly impact bookings.
- Popular amenities like Hangers, Hot water, Coffee maker are common but not universal. Offering these can provide a competitive edge.
Recommendations for Hosts
- Ensure your listing includes all essential amenities for Tholen: Wifi, Heating, Smoke alarm, Kitchen.
- Prioritize adding missing essentials: Smoke alarm, Kitchen.
- Consider adding popular differentiators like Hangers or Hot water to increase appeal.
- Highlight unique or less common amenities you offer (e.g., hot tub, dedicated workspace, EV charger) in your listing description and photos.
- Regularly check competitor amenities in Tholen to stay competitive.
Tholen Airbnb Guest Demographics & Profile Analysis (2025)
Guest Profile Summary for Tholen
- The typical guest profile for Airbnb in Tholen consists of a mix of domestic (39%) and international guests, with top international origins including Germany, typically belonging to the Post-2000s (Gen Z/Alpha) group (50%), primarily speaking English or Dutch.
- Domestic travelers account for 38.6% of guests.
- Key international markets include Netherlands (38.6%) and Germany (27.2%).
- Top languages spoken are English (37.8%) followed by Dutch (23%).
- A significant demographic segment is the Post-2000s (Gen Z/Alpha) group, representing 50% of guests.
Recommendations for Hosts
- Focus marketing internationally, particularly towards travelers from Germany.
- Tailor amenities and listing descriptions to appeal to the dominant Post-2000s (Gen Z/Alpha) demographic (e.g., highlight fast WiFi, smart home features, local guides).
- Highlight unique local experiences or amenities relevant to the primary guest profile.
- Consider seasonal promotions aligned with peak travel times for key origin markets.
Nearby Short-Term Rental Market Comparison
How does the Tholen Airbnb market stack up against its neighbors? Compare key performance metrics like average monthly revenue, ADR, and occupancy rates in surrounding areas to understand the broader regional STR landscape.
| Market | Active Properties | Monthly Revenue | Daily Rate | Avg. Occupancy |
|---|---|---|---|---|
| Kockengen | 12 | $7,560 | $396.31 | 61% |
| Mont-de-l'Enclus | 10 | $5,508 | $360.62 | 39% |
| Bentveld | 13 | $4,798 | $443.61 | 54% |
| Dion | 13 | $4,589 | $265.41 | 58% |
| Halfweg | 17 | $4,307 | $231.13 | 55% |
| Aerdenhout | 17 | $4,288 | $694.02 | 53% |
| Incourt | 11 | $4,281 | $293.31 | 43% |
| Merksplas | 10 | $3,885 | $256.59 | 44% |
| Oud Ade | 17 | $3,779 | $277.47 | 51% |
| Rijs | 27 | $3,772 | $356.97 | 45% |