Kattendijke Airbnb Market Analysis 2025: Short Term Rental Data & Vacation Rental Statistics in Zeeland, Netherlands
Is Airbnb profitable in Kattendijke in 2025? Explore comprehensive Airbnb analytics for Kattendijke, Zeeland, Netherlands to uncover income potential. This 2025 STR market report for Kattendijke, based on AirROI data from April 2024 to March 2025, reveals key trends in the niche market of 20 active listings.
Whether you're considering an Airbnb investment in Kattendijke, optimizing your existing vacation rental, or exploring rental arbitrage opportunities, understanding the Kattendijke Airbnb data is crucial. Leveraging the low regulation environment is key to maximizing your short term rental income potential. Let's dive into the specifics.
Key Kattendijke Airbnb Performance Metrics Overview
Monthly Airbnb Revenue Variations & Income Potential in Kattendijke (2025)
Understanding the monthly revenue variations for Airbnb listings in Kattendijke is key to maximizing your short term rental income potential. Seasonality significantly impacts earnings. Our analysis, based on data from the past 12 months, shows that the peak revenue month for STRs in Kattendijke is typically August, while January often presents the lowest earnings, highlighting opportunities for strategic pricing adjustments during shoulder and low seasons. Explore the typical Airbnb income in Kattendijke across different performance tiers:
- Best-in-class properties (Top 10%) achieve $3,405+ monthly, often utilizing dynamic pricing and superior guest experiences.
- Strong performing properties (Top 25%) earn $2,783 or more, indicating effective management and desirable locations/amenities.
- Typical properties (Median) generate around $1,777 per month, representing the average market performance.
- Entry-level properties (Bottom 25%) see earnings around $1,066, often with potential for optimization.
Average Monthly Airbnb Earnings Trend in Kattendijke
Kattendijke Airbnb Occupancy Rate Trends (2025)
Maximize your bookings by understanding the Kattendijke STR occupancy trends. Seasonal demand shifts significantly influence how often properties are booked. Typically, Augustsees the highest demand (peak season occupancy), while January experiences the lowest (low season). Effective strategies, like adjusting minimum stays or offering promotions, can boost occupancy during slower periods. Here's how different property tiers perform in Kattendijke:
- Best-in-class properties (Top 10%) achieve 75%+ occupancy, indicating high desirability and potentially optimized availability.
- Strong performing properties (Top 25%) maintain 62% or higher occupancy, suggesting good market fit and guest satisfaction.
- Typical properties (Median) have an occupancy rate around 35%.
- Entry-level properties (Bottom 25%) average 18% occupancy, potentially facing higher vacancy.
Average Monthly Occupancy Rate Trend in Kattendijke
Average Daily Rate (ADR) Airbnb Trends in Kattendijke (2025)
Effective short term rental pricing strategy in Kattendijke involves understanding monthly ADR fluctuations. The Average Daily Rate (ADR) for Airbnb in Kattendijke typically peaks in July and dips lowest during February. Leveraging Airbnb dynamic pricing tools or strategies based on this seasonality can significantly boost revenue. Here's a look at the typical nightly rates achieved:
- Best-in-class properties (Top 10%) command rates of $216+ per night, often due to premium features or locations.
- Strong performing properties (Top 25%) achieve nightly rates of $166 or more.
- Typical properties (Median) charge around $145 per night.
- Entry-level properties (Bottom 25%) earn around $133 per night.
Average Daily Rate (ADR) Trend by Month in Kattendijke
Get Live Kattendijke Market Intelligence 👇

Explore Real-time Analytics
Airbnb Seasonality Analysis & Trends in Kattendijke (2025)
Peak Season (August, July, June)
- Revenue averages $2,888 per month
- Occupancy rates average 56.7%
- Daily rates average $161
Shoulder Season
- Revenue averages $1,965 per month
- Occupancy maintains around 40.9%
- Daily rates hold near $154
Low Season (January, February, December)
- Revenue drops to average $1,080 per month
- Occupancy decreases to average 25.3%
- Daily rates adjust to average $152
Seasonality Insights for Kattendijke
- The Airbnb seasonality in Kattendijke shows highly seasonal trends requiring careful strategy. While the sections above show seasonal averages, it's also insightful to look at the extremes:
- During the high season, the absolute peak month showcases Kattendijke's highest earning potential, with monthly revenues capable of climbing to $3,290, occupancy reaching a high of 67.9%, and ADRs peaking at $162.
- Conversely, the slowest single month of the year, typically falling within the low season, marks the market's lowest point. In this month, revenue might dip to $878, occupancy could drop to 19.4%, and ADRs may adjust down to $148.
- Understanding both the seasonal averages and these monthly peaks and troughs in revenue, occupancy, and ADR is crucial for maximizing your Airbnb profit potential in Kattendijke.
Seasonal Strategies for Maximizing Profit
- Peak Season: Maximize revenue through premium pricing and potentially longer minimum stays. Ensure high availability.
- Low Season: Offer competitive pricing, special promotions (e.g., extended stay discounts), and flexible cancellation policies. Target off-season travelers like remote workers or budget-conscious guests.
- Shoulder Seasons: Implement dynamic pricing that balances peak and low rates. Target weekend travelers or specific events. Offer slightly more flexible terms than peak season.
- Regularly analyze your own performance against these Kattendijke seasonality benchmarks and adjust your pricing and availability strategy accordingly.
Best Areas for Airbnb Investment in Kattendijke (2025)
Exploring the top neighborhoods for short-term rentals in Kattendijke? This section highlights key areas, outlining why they are attractive for hosts and guests, along with notable local attractions. Consider these locations based on your target guest profile and investment strategy.
| Neighborhood / Area | Why Host Here? (Target Guests & Appeal) | Key Attractions & Landmarks |
|---|---|---|
| Kattendijke Center | Located in the heart of Kattendijke, this area provides easy access to local amenities and is a quiet spot away from the busier tourist areas. Ideal for families and couples looking for a peaceful stay with close proximity to nature. | Local shops, Restaurants, Nearby parks, Scenic walking trails, Historic buildings |
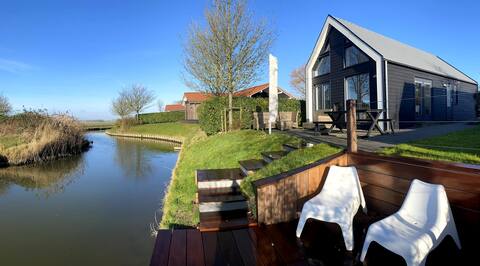
| Near the Water | This area offers beautiful waterfront views and is great for guests who enjoy activities like sailing and fishing. A perfect getaway for nature lovers and those wanting to relax by the water. | Zeeland beaches, Watersports, Nature reserves, Bike trails, Fishing spots |
| Historic Kattendijke | A charming area with historic architecture and a rich local culture. Guests can experience the authentic vibe of Zeeland while being close to other attractions in the region. | Historical sites, Museums, Local markets, Nearby towns, Cultural festivals |
| Kattendijke countryside | A tranquil rural area perfect for guests seeking a peaceful retreat. Surrounded by farmland and cycling paths, it's an ideal location for those wanting to explore Zeeland's natural beauty. | Cycling routes, Nature reserves, Farm visits, Picnic spots, Scenic views |
| Nearby Goes | Goes is a vibrant town close to Kattendijke, offering a variety of shops and restaurants. It’s great for guests who want a mix of local charm and convenience. | Goes town center, Shopping, Dining, Events and festivals, Historic sites |
| Kattendijke Market Days | This area comes alive during the local market days, attracting visitors interested in local produce and crafts. It’s a lively experience that guests can enjoy. | Local crafts, Food stalls, Farmers' market, Community events, Live music |
| Nature Reserves | Several nature reserves close to Kattendijke provide a unique opportunity for guests to explore the diverse wildlife and natural landscapes of Zeeland. | Nature walks, Bird watching, Photography spots, Guided nature tours, Camping areas |
| Cultural Events Zone | This area hosts various cultural events throughout the year, attracting visitors interested in local art, music, and performances. A good choice for guests who enjoy cultural experiences. | Art festivals, Music concerts, Theater productions, Local art galleries, Cultural workshops |
Understanding Airbnb License Requirements & STR Laws in Kattendijke (2025)
While Kattendijke, Zeeland, Netherlands currently shows low STR regulations, specific Airbnb license requirements might still exist or change. Always verify the latest short term rental regulations and Airbnb license requirements directly with local government authorities for Kattendijke to ensure full compliance before hosting.
(Source: AirROI data, 2025, finding no licensed listings among those analyzed)
Top Performing Airbnb Properties in Kattendijke (2025)
Benchmark your potential! Explore examples of top-performing Airbnb properties in Kattendijkebased on Trailing Twelve Month (TTM) revenue. Analyze their characteristics, revenue, occupancy rate, and ADR to understand what drives success in this market.

Cottage in Zeeland, home time 22
Entire Place • 2 bedrooms
Enjoying Zeeland on Beau sur Mer
Entire Place • 2 bedrooms

Cottage in Zeeland, home time 6
Entire Place • 2 bedrooms

Vakantiehuis Chez Sur Mer
Entire Place • 2 bedrooms
Chalet "Diek42" located on the Oosterschelde
Entire Place • 2 bedrooms
Nicely furnished holiday home with nice views
Entire Place • 2 bedrooms
Note: Performance varies based on location, size, amenities, seasonality, and management quality. Data reflects the past 12 months.
Top Performing Airbnb Hosts in Kattendijke (2025)
Learn from the best! This table showcases top-performing Airbnb hosts in Kattendijke based on the number of properties managed and estimated total revenue over the past year. Analyze their scale and performance metrics.
| Host Name | Properties | Grossing Revenue | Stay Reviews | Avg Rating |
|---|---|---|---|---|
| Tina | 2 | $74,092 | 150 | 4.88/5.0 |
| Karlijn | 2 | $43,028 | 60 | 4.92/5.0 |
| Ilse | 1 | $37,318 | 150 | 4.79/5.0 |
| Lucy | 1 | $24,148 | 195 | 4.62/5.0 |
| Host #360831279 | 1 | $21,925 | 0 | 0.00/5.0 |
| Allan | 1 | $21,443 | 51 | 4.82/5.0 |
| Zon, Zand En Zilte Lucht | 1 | $18,034 | 150 | 4.49/5.0 |
| Tamara - BELVILLA | 4 | $17,638 | 94 | 4.42/5.0 |
| Inge | 1 | $17,293 | 6 | 5.00/5.0 |
| Ilona | 3 | $16,508 | 3 | 1.67/5.0 |
Analyzing the strategies of top hosts, such as their property selection, pricing, and guest communication, can offer valuable lessons for optimizing your own Airbnb operations in Kattendijke.
Dive Deeper: Advanced Kattendijke STR Market Data (2025)
Ready to unlock more insights? AirROI provides access to advanced metrics and comprehensive Airbnb data for Kattendijke. Explore detailed analytics beyond this report to refine your investment strategy, optimize pricing, and maximize your vacation rental profits.
Explore Advanced MetricsKattendijke Short-Term Rental Market Composition (2025): Property & Room Types
Room Type Distribution
Property Type Distribution
Market Composition Insights for Kattendijke
- The Kattendijke Airbnb market composition is heavily skewed towards Entire Home/Apt listings, which make up 85% of the 20 active rentals. This indicates strong guest preference for privacy and space.
- Looking at the property type distribution in Kattendijke, House properties are the most common (85%), reflecting the local real estate landscape.
- Houses represent a significant 85% portion, catering likely to families or larger groups.
- The presence of 15% Hotel/Boutique listings indicates integration with traditional hospitality.
Kattendijke Airbnb Room Capacity Analysis (2025): Bedroom Distribution
Distribution of Listings by Number of Bedrooms
Room Capacity Insights for Kattendijke
- The dominant room capacity in Kattendijke is 2 bedrooms listings, making up 70% of the market. This suggests a strong demand for properties suitable for couples or solo travelers.
- Together, 2 bedrooms and 1 bedroom properties represent 85.0% of the active Airbnb listings in Kattendijke, indicating a high concentration in these sizes.
Kattendijke Vacation Rental Guest Capacity Trends (2025)
Distribution of Listings by Guest Capacity
Guest Capacity Insights for Kattendijke
- The most common guest capacity trend in Kattendijke vacation rentals is listings accommodating 4 guests (60%). This suggests the primary traveler segment is likely small families or groups.
- Properties designed for 4 guests and 2 guests dominate the Kattendijke STR market, accounting for 75.0% of listings.
- On average, properties in Kattendijke are equipped to host 3.8 guests.
Kattendijke Airbnb Booking Patterns (2025): Available vs. Booked Days
Available Days Distribution
Booked Days Distribution
Booking Pattern Insights for Kattendijke
- The most common availability pattern in Kattendijke falls within the 271-366 days range, representing 50% of listings. This suggests many properties have significant open periods on their calendars.
- Approximately 75.0% of listings show high availability (181+ days open annually), indicating potential for increased bookings or specific owner usage patterns.
- For booked days, the 1-30 days range is most frequent in Kattendijke (30%), reflecting common guest stay durations or potential owner blocking patterns.
- A notable 25.0% of properties secure long booking periods (181+ days booked per year), highlighting successful long-term rental strategies or significant owner usage.
Kattendijke Airbnb Minimum Stay Requirements Analysis
Distribution of Listings by Minimum Night Requirement
1 Night
4 listings
21.1% of total
2 Nights
11 listings
57.9% of total
3 Nights
3 listings
15.8% of total
30+ Nights
1 listings
5.3% of total
Key Insights
- The most prevalent minimum stay requirement in Kattendijke is 2 Nights, adopted by 57.9% of listings. This highlights the market's preference for shorter, flexible bookings.
- A strong majority (79.0%) of the Kattendijke Airbnb data shows acceptance of very short stays (1-2 nights), indicating a dynamic, high-turnover market.
Recommendations
- Align with the market by considering a 2 Nights minimum stay, as 57.9% of Kattendijke hosts use this setting.
- If feasible, allowing 1-night stays, especially midweek or during low season, could capture last-minute bookings, as only 21.1% currently do.
- Explore offering discounts for stays of 30+ nights to attract the 5.3% of the market seeking extended stays.
- Adjust minimum nights based on seasonality – potentially shorter during low season and longer during peak demand periods in Kattendijke.
Kattendijke Airbnb Cancellation Policy Trends Analysis (2025)
Moderate
2 listings
12.5% of total
Firm
6 listings
37.5% of total
Strict
8 listings
50% of total
Cancellation Policy Insights for Kattendijke
- The prevailing Airbnb cancellation policy trend in Kattendijke is Strict, used by 50% of listings.
- A majority (87.5%) of hosts in Kattendijke utilize Firm or Strict policies, indicating a market where hosts prioritize booking security.
Recommendations for Hosts
- Consider adopting a Strict policy to align with the 50% market standard in Kattendijke.
- With 50% using Strict terms, this is a viable option in Kattendijke, particularly for high-value properties or during peak demand periods.
- Regularly review your cancellation policy against competitors and market demand shifts in Kattendijke.
Kattendijke STR Booking Lead Time Analysis (2025)
Average Booking Lead Time by Month
Booking Lead Time Insights for Kattendijke
- The overall average booking lead time for vacation rentals in Kattendijke is 61 days.
- Guests book furthest in advance for stays during July (average 147 days), likely coinciding with peak travel demand or local events.
- The shortest booking windows occur for stays in March (average 29 days), indicating more last-minute travel plans during this time.
- Seasonally, Summer (114 days avg.) sees the longest lead times, while Fall (54 days avg.) has the shortest, reflecting typical travel planning cycles.
Recommendations for Hosts
- Use the overall average lead time (61 days) as a baseline for your pricing and availability strategy in Kattendijke.
- For July stays, consider implementing length-of-stay discounts or slightly higher rates for bookings made less than 147 days out to capitalize on advance planning.
- Target marketing efforts for the Summer season well in advance (at least 114 days) to capture early planners.
- Monitor your own booking lead times against these Kattendijke averages to identify opportunities for dynamic pricing adjustments.
Popular & Essential Airbnb Amenities in Kattendijke (2025)
Amenity Prevalence
Amenity Insights for Kattendijke
- Essential amenities in Kattendijke that guests expect include: Wifi, Heating, Kitchen, TV. Lacking these (any) could significantly impact bookings.
- Popular amenities like Hangers, Smoke alarm, Dishwasher are common but not universal. Offering these can provide a competitive edge.
Recommendations for Hosts
- Ensure your listing includes all essential amenities for Kattendijke: Wifi, Heating, Kitchen, TV.
- Prioritize adding missing essentials: Kitchen, TV.
- Consider adding popular differentiators like Hangers or Smoke alarm to increase appeal.
- Highlight unique or less common amenities you offer (e.g., hot tub, dedicated workspace, EV charger) in your listing description and photos.
- Regularly check competitor amenities in Kattendijke to stay competitive.
Kattendijke Airbnb Guest Demographics & Profile Analysis (2025)
Guest Profile Summary for Kattendijke
- The typical guest profile for Airbnb in Kattendijke consists of predominantly international visitors (77%), with top international origins including Netherlands, typically belonging to the Post-2000s (Gen Z/Alpha) group (50%), primarily speaking English or German.
- Domestic travelers account for 23.1% of guests.
- Key international markets include Germany (45.5%) and Netherlands (23.1%).
- Top languages spoken are English (40.5%) followed by German (23.6%).
- A significant demographic segment is the Post-2000s (Gen Z/Alpha) group, representing 50% of guests.
Recommendations for Hosts
- Focus marketing internationally, particularly towards travelers from Netherlands.
- Tailor amenities and listing descriptions to appeal to the dominant Post-2000s (Gen Z/Alpha) demographic (e.g., highlight fast WiFi, smart home features, local guides).
- Highlight unique local experiences or amenities relevant to the primary guest profile.
- Consider seasonal promotions aligned with peak travel times for key origin markets.
Nearby Short-Term Rental Market Comparison
How does the Kattendijke Airbnb market stack up against its neighbors? Compare key performance metrics like average monthly revenue, ADR, and occupancy rates in surrounding areas to understand the broader regional STR landscape.
| Market | Active Properties | Monthly Revenue | Daily Rate | Avg. Occupancy |
|---|---|---|---|---|
| Kockengen | 12 | $7,560 | $396.31 | 61% |
| Lo-Reninge | 12 | $6,193 | $432.10 | 49% |
| Mont-de-l'Enclus | 10 | $5,508 | $360.62 | 39% |
| Bentveld | 13 | $4,798 | $443.61 | 54% |
| Dion | 13 | $4,589 | $265.41 | 58% |
| Halfweg | 17 | $4,307 | $231.13 | 55% |
| Aerdenhout | 17 | $4,288 | $694.02 | 53% |
| Incourt | 11 | $4,281 | $293.31 | 43% |
| Merksplas | 10 | $3,885 | $256.59 | 44% |
| Oud Ade | 17 | $3,779 | $277.47 | 51% |