Vlaardingen Airbnb Market Analysis 2025: Short Term Rental Data & Vacation Rental Statistics in South Holland, Netherlands
Is Airbnb profitable in Vlaardingen in 2025? Explore comprehensive Airbnb analytics for Vlaardingen, South Holland, Netherlands to uncover income potential. This 2025 STR market report for Vlaardingen, based on AirROI data from April 2024 to March 2025, reveals key trends in the niche market of 32 active listings.
Whether you're considering an Airbnb investment in Vlaardingen, optimizing your existing vacation rental, or exploring rental arbitrage opportunities, understanding the Vlaardingen Airbnb data is crucial. Leveraging the low regulation environment is key to maximizing your short term rental income potential. Let's dive into the specifics.
Key Vlaardingen Airbnb Performance Metrics Overview
Monthly Airbnb Revenue Variations & Income Potential in Vlaardingen (2025)
Understanding the monthly revenue variations for Airbnb listings in Vlaardingen is key to maximizing your short term rental income potential. Seasonality significantly impacts earnings. Our analysis, based on data from the past 12 months, shows that the peak revenue month for STRs in Vlaardingen is typically May, while January often presents the lowest earnings, highlighting opportunities for strategic pricing adjustments during shoulder and low seasons. Explore the typical Airbnb income in Vlaardingen across different performance tiers:
- Best-in-class properties (Top 10%) achieve $2,618+ monthly, often utilizing dynamic pricing and superior guest experiences.
- Strong performing properties (Top 25%) earn $1,904 or more, indicating effective management and desirable locations/amenities.
- Typical properties (Median) generate around $1,069 per month, representing the average market performance.
- Entry-level properties (Bottom 25%) see earnings around $554, often with potential for optimization.
Average Monthly Airbnb Earnings Trend in Vlaardingen
Vlaardingen Airbnb Occupancy Rate Trends (2025)
Maximize your bookings by understanding the Vlaardingen STR occupancy trends. Seasonal demand shifts significantly influence how often properties are booked. Typically, Maysees the highest demand (peak season occupancy), while January experiences the lowest (low season). Effective strategies, like adjusting minimum stays or offering promotions, can boost occupancy during slower periods. Here's how different property tiers perform in Vlaardingen:
- Best-in-class properties (Top 10%) achieve 86%+ occupancy, indicating high desirability and potentially optimized availability.
- Strong performing properties (Top 25%) maintain 70% or higher occupancy, suggesting good market fit and guest satisfaction.
- Typical properties (Median) have an occupancy rate around 50%.
- Entry-level properties (Bottom 25%) average 20% occupancy, potentially facing higher vacancy.
Average Monthly Occupancy Rate Trend in Vlaardingen
Average Daily Rate (ADR) Airbnb Trends in Vlaardingen (2025)
Effective short term rental pricing strategy in Vlaardingen involves understanding monthly ADR fluctuations. The Average Daily Rate (ADR) for Airbnb in Vlaardingen typically peaks in July and dips lowest during February. Leveraging Airbnb dynamic pricing tools or strategies based on this seasonality can significantly boost revenue. Here's a look at the typical nightly rates achieved:
- Best-in-class properties (Top 10%) command rates of $136+ per night, often due to premium features or locations.
- Strong performing properties (Top 25%) achieve nightly rates of $107 or more.
- Typical properties (Median) charge around $70 per night.
- Entry-level properties (Bottom 25%) earn around $46 per night.
Average Daily Rate (ADR) Trend by Month in Vlaardingen
Get Live Vlaardingen Market Intelligence 👇

Explore Real-time Analytics
Airbnb Seasonality Analysis & Trends in Vlaardingen (2025)
Peak Season (May, September, June)
- Revenue averages $1,591 per month
- Occupancy rates average 61.4%
- Daily rates average $109
Shoulder Season
- Revenue averages $1,342 per month
- Occupancy maintains around 49.6%
- Daily rates hold near $99
Low Season (January, February, December)
- Revenue drops to average $1,070 per month
- Occupancy decreases to average 37.2%
- Daily rates adjust to average $79
Seasonality Insights for Vlaardingen
- The Airbnb seasonality in Vlaardingen shows moderate seasonality with distinct peak and low periods. While the sections above show seasonal averages, it's also insightful to look at the extremes:
- During the high season, the absolute peak month showcases Vlaardingen's highest earning potential, with monthly revenues capable of climbing to $1,657, occupancy reaching a high of 68.0%, and ADRs peaking at $111.
- Conversely, the slowest single month of the year, typically falling within the low season, marks the market's lowest point. In this month, revenue might dip to $892, occupancy could drop to 30.0%, and ADRs may adjust down to $77.
- Understanding both the seasonal averages and these monthly peaks and troughs in revenue, occupancy, and ADR is crucial for maximizing your Airbnb profit potential in Vlaardingen.
Seasonal Strategies for Maximizing Profit
- Peak Season: Maximize revenue through premium pricing and potentially longer minimum stays. Ensure high availability.
- Low Season: Offer competitive pricing, special promotions (e.g., extended stay discounts), and flexible cancellation policies. Target off-season travelers like remote workers or budget-conscious guests.
- Shoulder Seasons: Implement dynamic pricing that balances peak and low rates. Target weekend travelers or specific events. Offer slightly more flexible terms than peak season.
- Regularly analyze your own performance against these Vlaardingen seasonality benchmarks and adjust your pricing and availability strategy accordingly.
Best Areas for Airbnb Investment in Vlaardingen (2025)
Exploring the top neighborhoods for short-term rentals in Vlaardingen? This section highlights key areas, outlining why they are attractive for hosts and guests, along with notable local attractions. Consider these locations based on your target guest profile and investment strategy.
| Neighborhood / Area | Why Host Here? (Target Guests & Appeal) | Key Attractions & Landmarks |
|---|---|---|
| De Bovenhouder | A charming neighborhood with a mix of modern and traditional Dutch architecture, perfect for those looking for a cozy and welcoming atmosphere. Close to parks and local shops that attract families and tourists alike. | Vlaardingen Museum, De Stadsgevel, Kadeplein, Landschapspeeltuin, Parks and recreational areas |
| Vlaardingen Centrum | The city center boasts a bustling atmosphere with shops, restaurants, and cultural sites. It is popular among tourists who want to experience local life and culture, making it an ideal spot for Airbnb hosting. | St. John Church, Vlaardingen Market Square, Theatre De Groene Luiken, Local cafes and restaurants |
| Holy | A picturesque neighborhood with scenic canals and green spaces. It offers a peaceful getaway close to the city's amenities, attracting those who seek tranquility and nature. | Canal walks, Green parks, Historic buildings, Local artisan shops |
| Westwijk | A modern residential area that attracts families and young couples, offering numerous parks and recreational facilities. It’s a family-friendly area that appeals to long-term stays and larger groups. | Park Groot Hollandsche Polder, Westwijk shopping center, Recreational facilities, Community events |
| Zeeheldenwijk | Known for its maritime history and proximity to the marina, this area appeals to tourists interested in sailing and water activities, making it an excellent spot for an Airbnb. | Vlaardingen Marina, Historical shipyard, Water sports opportunities, Maritime events |
| Buitenhaven | A developing neighborhood with an industrial charm, attracting those interested in a unique urban experience. Close to trendy cafes and artistic spaces, it’s popular among creatives. | Street art, Local breweries, Unique cafes, Art studios |
| Shrimp Harbor | This area is steeped in Vlaardingen's fishing history, offering a unique cultural experience with local seafood restaurants and historic sites, ideal for culinary tourism. | Fish market, Seafood restaurants, Historic harbor sites, Fishing museum |
| Westerwater | A lively neighborhood that is great for families and young professionals, featuring ample parks and schools. It attracts both short and long-term visitors due to its accessibility and local amenities. | Westerwater park, Local markets, Family-friendly facilities, Community events |
Understanding Airbnb License Requirements & STR Laws in Vlaardingen (2025)
While Vlaardingen, South Holland, Netherlands currently shows low STR regulations, specific Airbnb license requirements might still exist or change. Always verify the latest short term rental regulations and Airbnb license requirements directly with local government authorities for Vlaardingen to ensure full compliance before hosting.
(Source: AirROI data, 2025, finding no licensed listings among those analyzed)
Top Performing Airbnb Properties in Vlaardingen (2025)
Benchmark your potential! Explore examples of top-performing Airbnb properties in Vlaardingenbased on Trailing Twelve Month (TTM) revenue. Analyze their characteristics, revenue, occupancy rate, and ADR to understand what drives success in this market.
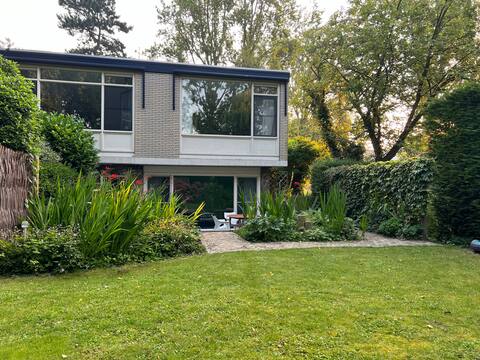
Close to Rotterdam, free parking, terrace & garden
Entire Place • 2 bedrooms
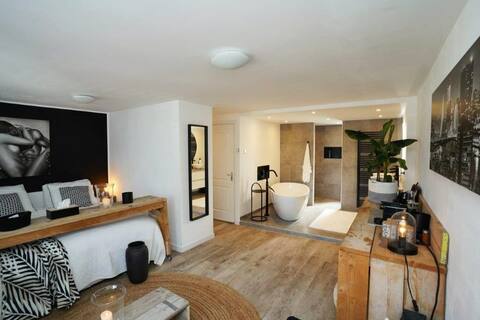
Luxury Complete Studio near Rotterdam
Private Room • 1 bedroom
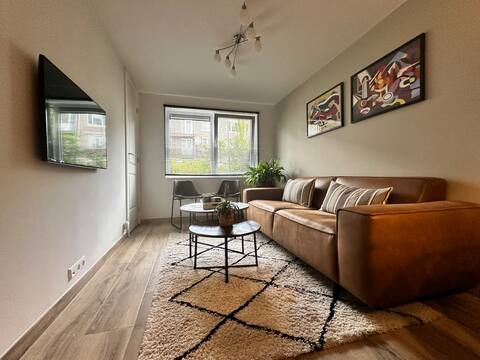
Underground appartement
Entire Place • 1 bedroom
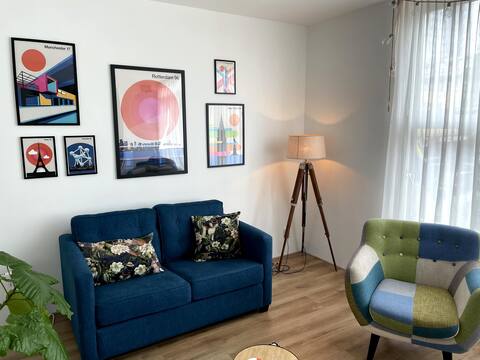
The Heart of Vlaardingen
Entire Place • 2 bedrooms

In the seventh heaven
Entire Place • 3 bedrooms
v&g cozy nest b&b
Private Room • N/A
Note: Performance varies based on location, size, amenities, seasonality, and management quality. Data reflects the past 12 months.
Top Performing Airbnb Hosts in Vlaardingen (2025)
Learn from the best! This table showcases top-performing Airbnb hosts in Vlaardingen based on the number of properties managed and estimated total revenue over the past year. Analyze their scale and performance metrics.
| Host Name | Properties | Grossing Revenue | Stay Reviews | Avg Rating |
|---|---|---|---|---|
| Sarah | 7 | $58,629 | 119 | 4.75/5.0 |
| Maaike | 1 | $33,842 | 21 | 4.95/5.0 |
| Jacqueline | 2 | $32,043 | 122 | 4.92/5.0 |
| Cathy | 2 | $31,490 | 43 | 4.96/5.0 |
| Drifa | 1 | $23,543 | 9 | 4.78/5.0 |
| Frans Alexander | 2 | $23,175 | 116 | 4.91/5.0 |
| Rob | 1 | $21,400 | 23 | 4.87/5.0 |
| Jasper SJ | 6 | $20,388 | 105 | 2.61/5.0 |
| Jonas | 3 | $19,163 | 91 | 4.69/5.0 |
| Mihaela Valentina | 1 | $18,037 | 6 | 5.00/5.0 |
Analyzing the strategies of top hosts, such as their property selection, pricing, and guest communication, can offer valuable lessons for optimizing your own Airbnb operations in Vlaardingen.
Dive Deeper: Advanced Vlaardingen STR Market Data (2025)
Ready to unlock more insights? AirROI provides access to advanced metrics and comprehensive Airbnb data for Vlaardingen. Explore detailed analytics beyond this report to refine your investment strategy, optimize pricing, and maximize your vacation rental profits.
Explore Advanced MetricsVlaardingen Short-Term Rental Market Composition (2025): Property & Room Types
Room Type Distribution
Property Type Distribution
Market Composition Insights for Vlaardingen
- The Vlaardingen Airbnb market composition is heavily skewed towards Private Room listings, which make up 75% of the 32 active rentals. This indicates strong guest preference for privacy and space.
- Looking at the property type distribution in Vlaardingen, Apartment/Condo properties are the most common (53.1%), reflecting the local real estate landscape.
- Houses represent a significant 37.5% portion, catering likely to families or larger groups.
- Smaller segments like hotel/boutique (combined 3.1%) offer potential for unique stay experiences.
Vlaardingen Airbnb Room Capacity Analysis (2025): Bedroom Distribution
Distribution of Listings by Number of Bedrooms
Room Capacity Insights for Vlaardingen
- The dominant room capacity in Vlaardingen is 1 bedroom listings, making up 25% of the market. This suggests a strong demand for properties suitable for couples or solo travelers.
- Together, 1 bedroom and 2 bedrooms properties represent 40.6% of the active Airbnb listings in Vlaardingen, indicating a high concentration in these sizes.
- Listings with 3+ bedrooms (6.2%) represent a smaller niche, potentially indicating an underserved market for larger group accommodations in Vlaardingen.
Vlaardingen Vacation Rental Guest Capacity Trends (2025)
Distribution of Listings by Guest Capacity
Guest Capacity Insights for Vlaardingen
- The most common guest capacity trend in Vlaardingen vacation rentals is listings accommodating 4 guests (18.8%). This suggests the primary traveler segment is likely small families or groups.
- Properties designed for 4 guests and 3 guests dominate the Vlaardingen STR market, accounting for 28.2% of listings.
- On average, properties in Vlaardingen are equipped to host 1.3 guests.
Vlaardingen Airbnb Booking Patterns (2025): Available vs. Booked Days
Available Days Distribution
Booked Days Distribution
Booking Pattern Insights for Vlaardingen
- The most common availability pattern in Vlaardingen falls within the 181-270 days range, representing 37.5% of listings. This suggests many properties have significant open periods on their calendars.
- Approximately 71.9% of listings show high availability (181+ days open annually), indicating potential for increased bookings or specific owner usage patterns.
- For booked days, the 91-180 days range is most frequent in Vlaardingen (37.5%), reflecting common guest stay durations or potential owner blocking patterns.
- A notable 28.1% of properties secure long booking periods (181+ days booked per year), highlighting successful long-term rental strategies or significant owner usage.
Vlaardingen Airbnb Minimum Stay Requirements Analysis
Distribution of Listings by Minimum Night Requirement
1 Night
9 listings
29% of total
2 Nights
5 listings
16.1% of total
3 Nights
3 listings
9.7% of total
4-6 Nights
8 listings
25.8% of total
7-29 Nights
6 listings
19.4% of total
Key Insights
- The most prevalent minimum stay requirement in Vlaardingen is 1 Night, adopted by 29% of listings. This highlights the market's preference for shorter, flexible bookings.
Recommendations
- Align with the market by considering a 1 Night minimum stay, as 29% of Vlaardingen hosts use this setting.
- If feasible, allowing 1-night stays, especially midweek or during low season, could capture last-minute bookings, as only 29% currently do.
- Adjust minimum nights based on seasonality – potentially shorter during low season and longer during peak demand periods in Vlaardingen.
Vlaardingen Airbnb Cancellation Policy Trends Analysis (2025)
Flexible
6 listings
20.7% of total
Moderate
8 listings
27.6% of total
Firm
8 listings
27.6% of total
Strict
7 listings
24.1% of total
Cancellation Policy Insights for Vlaardingen
- The prevailing Airbnb cancellation policy trend in Vlaardingen is Moderate, used by 27.6% of listings.
- A majority (51.7%) of hosts in Vlaardingen utilize Firm or Strict policies, indicating a market where hosts prioritize booking security.
Recommendations for Hosts
- Consider adopting a Moderate policy to align with the 27.6% market standard in Vlaardingen.
- Regularly review your cancellation policy against competitors and market demand shifts in Vlaardingen.
Vlaardingen STR Booking Lead Time Analysis (2025)
Average Booking Lead Time by Month
Booking Lead Time Insights for Vlaardingen
- The overall average booking lead time for vacation rentals in Vlaardingen is 37 days.
- Guests book furthest in advance for stays during July (average 73 days), likely coinciding with peak travel demand or local events.
- The shortest booking windows occur for stays in December (average 22 days), indicating more last-minute travel plans during this time.
- Seasonally, Summer (52 days avg.) sees the longest lead times, while Winter (29 days avg.) has the shortest, reflecting typical travel planning cycles.
Recommendations for Hosts
- Use the overall average lead time (37 days) as a baseline for your pricing and availability strategy in Vlaardingen.
- For July stays, consider implementing length-of-stay discounts or slightly higher rates for bookings made less than 73 days out to capitalize on advance planning.
- Target marketing efforts for the Summer season well in advance (at least 52 days) to capture early planners.
- Monitor your own booking lead times against these Vlaardingen averages to identify opportunities for dynamic pricing adjustments.
Popular & Essential Airbnb Amenities in Vlaardingen (2025)
Amenity Prevalence
Amenity Insights for Vlaardingen
- Essential amenities in Vlaardingen that guests expect include: Wifi. Lacking these (this) could significantly impact bookings.
- Popular amenities like Heating, Kitchen, Dishes and silverware are common but not universal. Offering these can provide a competitive edge.
Recommendations for Hosts
- Ensure your listing includes all essential amenities for Vlaardingen: Wifi.
- Consider adding popular differentiators like Heating or Kitchen to increase appeal.
- Highlight unique or less common amenities you offer (e.g., hot tub, dedicated workspace, EV charger) in your listing description and photos.
- Regularly check competitor amenities in Vlaardingen to stay competitive.
Vlaardingen Airbnb Guest Demographics & Profile Analysis (2025)
Guest Profile Summary for Vlaardingen
- The typical guest profile for Airbnb in Vlaardingen consists of predominantly international visitors (89%), with top international origins including France, typically belonging to the Post-2000s (Gen Z/Alpha) group (50%), primarily speaking English or German.
- Domestic travelers account for 11.5% of guests.
- Key international markets include Germany (24.5%) and France (17.3%).
- Top languages spoken are English (41.1%) followed by German (14%).
- A significant demographic segment is the Post-2000s (Gen Z/Alpha) group, representing 50% of guests.
Recommendations for Hosts
- Focus marketing internationally, particularly towards travelers from France.
- Tailor amenities and listing descriptions to appeal to the dominant Post-2000s (Gen Z/Alpha) demographic (e.g., highlight fast WiFi, smart home features, local guides).
- Highlight unique local experiences or amenities relevant to the primary guest profile.
- Consider seasonal promotions aligned with peak travel times for key origin markets.
Nearby Short-Term Rental Market Comparison
How does the Vlaardingen Airbnb market stack up against its neighbors? Compare key performance metrics like average monthly revenue, ADR, and occupancy rates in surrounding areas to understand the broader regional STR landscape.
| Market | Active Properties | Monthly Revenue | Daily Rate | Avg. Occupancy |
|---|---|---|---|---|
| Kockengen | 12 | $7,560 | $396.31 | 61% |
| Mont-de-l'Enclus | 10 | $5,508 | $360.62 | 39% |
| Bentveld | 13 | $4,798 | $443.61 | 54% |
| Dion | 13 | $4,589 | $265.41 | 58% |
| Halfweg | 17 | $4,307 | $231.13 | 55% |
| Aerdenhout | 17 | $4,288 | $694.02 | 53% |
| Incourt | 11 | $4,281 | $293.31 | 43% |
| Merksplas | 10 | $3,885 | $256.59 | 44% |
| Oud Ade | 17 | $3,779 | $277.47 | 51% |
| Rijs | 27 | $3,772 | $356.97 | 45% |