Rijswijk Airbnb Market Analysis 2025: Short Term Rental Data & Vacation Rental Statistics in South Holland, Netherlands
Is Airbnb profitable in Rijswijk in 2025? Explore comprehensive Airbnb analytics for Rijswijk, South Holland, Netherlands to uncover income potential. This 2025 STR market report for Rijswijk, based on AirROI data from April 2024 to March 2025, reveals key trends in the niche market of 38 active listings.
Whether you're considering an Airbnb investment in Rijswijk, optimizing your existing vacation rental, or exploring rental arbitrage opportunities, understanding the Rijswijk Airbnb data is crucial. Leveraging the low regulation environment is key to maximizing your short term rental income potential. Let's dive into the specifics.
Key Rijswijk Airbnb Performance Metrics Overview
Monthly Airbnb Revenue Variations & Income Potential in Rijswijk (2025)
Understanding the monthly revenue variations for Airbnb listings in Rijswijk is key to maximizing your short term rental income potential. Seasonality significantly impacts earnings. Our analysis, based on data from the past 12 months, shows that the peak revenue month for STRs in Rijswijk is typically April, while November often presents the lowest earnings, highlighting opportunities for strategic pricing adjustments during shoulder and low seasons. Explore the typical Airbnb income in Rijswijk across different performance tiers:
- Best-in-class properties (Top 10%) achieve $4,481+ monthly, often utilizing dynamic pricing and superior guest experiences.
- Strong performing properties (Top 25%) earn $3,245 or more, indicating effective management and desirable locations/amenities.
- Typical properties (Median) generate around $2,145 per month, representing the average market performance.
- Entry-level properties (Bottom 25%) see earnings around $1,229, often with potential for optimization.
Average Monthly Airbnb Earnings Trend in Rijswijk
Rijswijk Airbnb Occupancy Rate Trends (2025)
Maximize your bookings by understanding the Rijswijk STR occupancy trends. Seasonal demand shifts significantly influence how often properties are booked. Typically, Julysees the highest demand (peak season occupancy), while November experiences the lowest (low season). Effective strategies, like adjusting minimum stays or offering promotions, can boost occupancy during slower periods. Here's how different property tiers perform in Rijswijk:
- Best-in-class properties (Top 10%) achieve 92%+ occupancy, indicating high desirability and potentially optimized availability.
- Strong performing properties (Top 25%) maintain 82% or higher occupancy, suggesting good market fit and guest satisfaction.
- Typical properties (Median) have an occupancy rate around 54%.
- Entry-level properties (Bottom 25%) average 27% occupancy, potentially facing higher vacancy.
Average Monthly Occupancy Rate Trend in Rijswijk
Average Daily Rate (ADR) Airbnb Trends in Rijswijk (2025)
Effective short term rental pricing strategy in Rijswijk involves understanding monthly ADR fluctuations. The Average Daily Rate (ADR) for Airbnb in Rijswijk typically peaks in December and dips lowest during April. Leveraging Airbnb dynamic pricing tools or strategies based on this seasonality can significantly boost revenue. Here's a look at the typical nightly rates achieved:
- Best-in-class properties (Top 10%) command rates of $229+ per night, often due to premium features or locations.
- Strong performing properties (Top 25%) achieve nightly rates of $150 or more.
- Typical properties (Median) charge around $107 per night.
- Entry-level properties (Bottom 25%) earn around $81 per night.
Average Daily Rate (ADR) Trend by Month in Rijswijk
Get Live Rijswijk Market Intelligence 👇

Explore Real-time Analytics
Airbnb Seasonality Analysis & Trends in Rijswijk (2025)
Peak Season (April, June, May)
- Revenue averages $3,380 per month
- Occupancy rates average 63.5%
- Daily rates average $125
Shoulder Season
- Revenue averages $2,451 per month
- Occupancy maintains around 55.6%
- Daily rates hold near $134
Low Season (January, February, November)
- Revenue drops to average $1,737 per month
- Occupancy decreases to average 41.7%
- Daily rates adjust to average $145
Seasonality Insights for Rijswijk
- The Airbnb seasonality in Rijswijk shows highly seasonal trends requiring careful strategy. While the sections above show seasonal averages, it's also insightful to look at the extremes:
- During the high season, the absolute peak month showcases Rijswijk's highest earning potential, with monthly revenues capable of climbing to $3,432, occupancy reaching a high of 65.9%, and ADRs peaking at $149.
- Conversely, the slowest single month of the year, typically falling within the low season, marks the market's lowest point. In this month, revenue might dip to $1,548, occupancy could drop to 38.6%, and ADRs may adjust down to $125.
- Understanding both the seasonal averages and these monthly peaks and troughs in revenue, occupancy, and ADR is crucial for maximizing your Airbnb profit potential in Rijswijk.
Seasonal Strategies for Maximizing Profit
- Peak Season: Maximize revenue through premium pricing and potentially longer minimum stays. Ensure high availability.
- Low Season: Offer competitive pricing, special promotions (e.g., extended stay discounts), and flexible cancellation policies. Target off-season travelers like remote workers or budget-conscious guests.
- Shoulder Seasons: Implement dynamic pricing that balances peak and low rates. Target weekend travelers or specific events. Offer slightly more flexible terms than peak season.
- Regularly analyze your own performance against these Rijswijk seasonality benchmarks and adjust your pricing and availability strategy accordingly.
Best Areas for Airbnb Investment in Rijswijk (2025)
Exploring the top neighborhoods for short-term rentals in Rijswijk? This section highlights key areas, outlining why they are attractive for hosts and guests, along with notable local attractions. Consider these locations based on your target guest profile and investment strategy.
| Neighborhood / Area | Why Host Here? (Target Guests & Appeal) | Key Attractions & Landmarks |
|---|---|---|
| Centrum Rijswijk | The heart of Rijswijk with a mixture of urban and suburban feel. Close to shops, restaurants, and public transport, making it a convenient location for visitors. | Rijswijkse Schouwburg, Historische Markt, Museum Rijswijk, Park Hofrust, Vitali Park |
| Rijswijk Voorburg | A charming area with a blend of historical and modern attractions. Ideal for families and couples looking for a peaceful stay near nature. | Huygens' Hofwijck, Park Vreugd en Rust, Voorburg's historical center, Erasmus Park |
| Rijswijk Lansingerland | Known for its green spaces and residential neighborhoods, this area offers a quieter atmosphere. Perfect for guests seeking a retreat close to nature and local amenities. | Delftse Hout, Lansingerland Park, local markets, cycling routes |
| Bomen- en Bloemenbuurt | A family-friendly neighborhood with spacious parks and gardens. Attractive to families visiting Rijswijk for longer stays or events. | Rijswijkse Bos, Zonnehuis Park, local playgrounds |
| Kijkduin | A seaside neighborhood not far from Rijswijk, offers beach access and a relaxing atmosphere. Great for tourists wanting to enjoy the sandy beach and promenade. | Kijkduin Beach, Kijkduin Promenade, Sea Life Scheveningen |
| The Hague | Nearby city with major attractions and proximity to international organizations. A potential area for business travelers and tourists. | Mauritshuis, Peace Palace, Scheveningen Beach, Binnenhof |
| Delft | Historic city close to Rijswijk, known for its charming aesthetics and cultural heritage. Popular for short-term rentals for tourists visiting the area. | Delft Market Square, Vermeer Centrum, New Church, Royal Delft |
| Wateringen | A tranquil village atmosphere with easy access to larger towns. Ideal for those looking for a quieter stay while being close to urban amenities. | Wateringse Veld, local markets, nearby parks |
Understanding Airbnb License Requirements & STR Laws in Rijswijk (2025)
While Rijswijk, South Holland, Netherlands currently shows low STR regulations, specific Airbnb license requirements might still exist or change. Always verify the latest short term rental regulations and Airbnb license requirements directly with local government authorities for Rijswijk to ensure full compliance before hosting.
(Source: AirROI data, 2025, finding no licensed listings among those analyzed)
Top Performing Airbnb Properties in Rijswijk (2025)
Benchmark your potential! Explore examples of top-performing Airbnb properties in Rijswijkbased on Trailing Twelve Month (TTM) revenue. Analyze their characteristics, revenue, occupancy rate, and ADR to understand what drives success in this market.

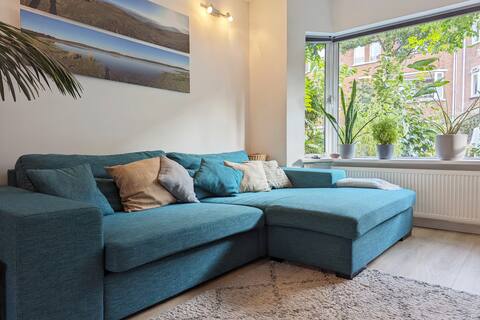
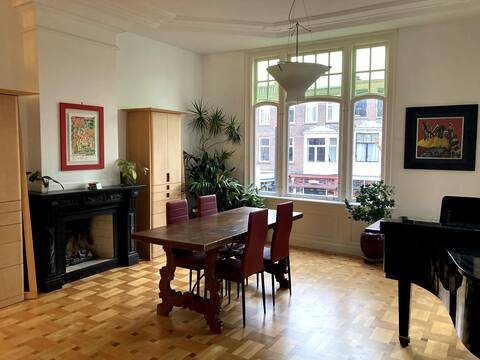
10p Monument familyhouse near Den Haag & Delft
Entire Place • 5 bedrooms
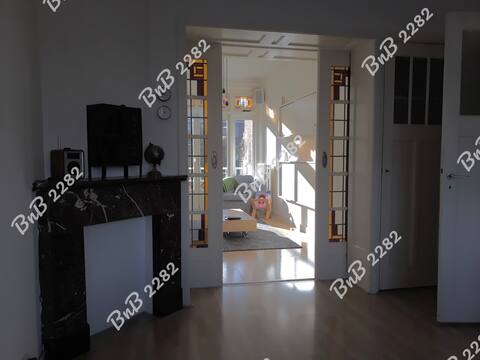
Family home with garden
Entire Place • 3 bedrooms
Free parking cozy apartment
Entire Place • 2 bedrooms
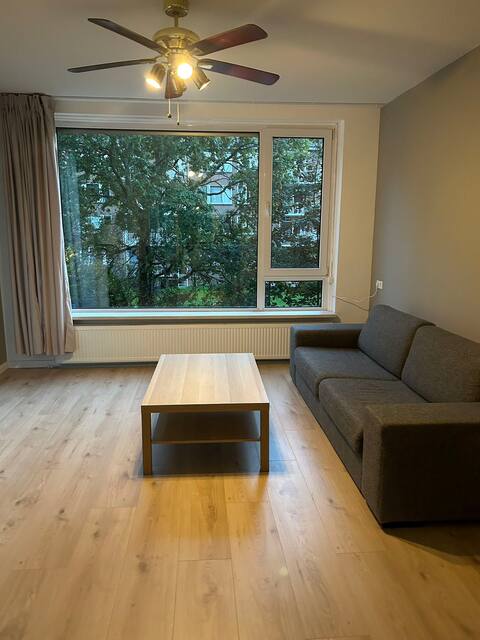
10 min away from The Hague center
Entire Place • 2 bedrooms

Large home with three large bedrooms.
Entire Place • 3 bedrooms
Rijswijk, bright & spacious apartment
Entire Place • 3 bedrooms
Note: Performance varies based on location, size, amenities, seasonality, and management quality. Data reflects the past 12 months.
Top Performing Airbnb Hosts in Rijswijk (2025)
Learn from the best! This table showcases top-performing Airbnb hosts in Rijswijk based on the number of properties managed and estimated total revenue over the past year. Analyze their scale and performance metrics.
| Host Name | Properties | Grossing Revenue | Stay Reviews | Avg Rating |
|---|---|---|---|---|
| Peter | 5 | $78,460 | 120 | 4.79/5.0 |
| NingNing | 2 | $75,125 | 19 | 4.91/5.0 |
| Floris | 2 | $72,816 | 49 | 4.78/5.0 |
| Robin | 1 | $63,577 | 73 | 4.93/5.0 |
| Luba | 1 | $37,482 | 21 | 4.95/5.0 |
| Joke | 1 | $36,555 | 103 | 4.89/5.0 |
| Niels | 1 | $35,900 | 94 | 4.96/5.0 |
| Christel | 2 | $33,453 | 105 | 4.84/5.0 |
| Team Hosted By Wendy | 1 | $30,336 | 24 | 4.75/5.0 |
| Rutger | 1 | $30,028 | 35 | 4.89/5.0 |
Analyzing the strategies of top hosts, such as their property selection, pricing, and guest communication, can offer valuable lessons for optimizing your own Airbnb operations in Rijswijk.
Dive Deeper: Advanced Rijswijk STR Market Data (2025)
Ready to unlock more insights? AirROI provides access to advanced metrics and comprehensive Airbnb data for Rijswijk. Explore detailed analytics beyond this report to refine your investment strategy, optimize pricing, and maximize your vacation rental profits.
Explore Advanced MetricsRijswijk Short-Term Rental Market Composition (2025): Property & Room Types
Room Type Distribution
Property Type Distribution
Market Composition Insights for Rijswijk
- The Rijswijk Airbnb market composition is heavily skewed towards Entire Home/Apt listings, which make up 81.6% of the 38 active rentals. This indicates strong guest preference for privacy and space.
- Looking at the property type distribution in Rijswijk, Apartment/Condo properties are the most common (47.4%), reflecting the local real estate landscape.
- Houses represent a significant 34.2% portion, catering likely to families or larger groups.
- The presence of 5.3% Hotel/Boutique listings indicates integration with traditional hospitality.
Rijswijk Airbnb Room Capacity Analysis (2025): Bedroom Distribution
Distribution of Listings by Number of Bedrooms
Room Capacity Insights for Rijswijk
- The dominant room capacity in Rijswijk is 1 bedroom listings, making up 36.8% of the market. This suggests a strong demand for properties suitable for couples or solo travelers.
- Together, 1 bedroom and 2 bedrooms properties represent 60.5% of the active Airbnb listings in Rijswijk, indicating a high concentration in these sizes.
- A significant 23.7% of listings offer 3+ bedrooms, catering to larger groups and families seeking more space in Rijswijk.
Rijswijk Vacation Rental Guest Capacity Trends (2025)
Distribution of Listings by Guest Capacity
Guest Capacity Insights for Rijswijk
- The most common guest capacity trend in Rijswijk vacation rentals is listings accommodating 2 guests (34.2%). This suggests the primary traveler segment is likely couples or solo travelers.
- Properties designed for 2 guests and 4 guests dominate the Rijswijk STR market, accounting for 57.9% of listings.
- 13.1% of properties accommodate 6+ guests, serving the market segment for larger families or group travel in Rijswijk.
- On average, properties in Rijswijk are equipped to host 3.0 guests.
Rijswijk Airbnb Booking Patterns (2025): Available vs. Booked Days
Available Days Distribution
Booked Days Distribution
Booking Pattern Insights for Rijswijk
- The most common availability pattern in Rijswijk falls within the 181-270 days range, representing 36.8% of listings. This suggests many properties have significant open periods on their calendars.
- Approximately 60.5% of listings show high availability (181+ days open annually), indicating potential for increased bookings or specific owner usage patterns.
- For booked days, the 91-180 days range is most frequent in Rijswijk (36.8%), reflecting common guest stay durations or potential owner blocking patterns.
- A notable 39.5% of properties secure long booking periods (181+ days booked per year), highlighting successful long-term rental strategies or significant owner usage.
Rijswijk Airbnb Minimum Stay Requirements Analysis
Distribution of Listings by Minimum Night Requirement
1 Night
5 listings
13.5% of total
2 Nights
4 listings
10.8% of total
3 Nights
5 listings
13.5% of total
4-6 Nights
6 listings
16.2% of total
7-29 Nights
10 listings
27% of total
30+ Nights
7 listings
18.9% of total
Key Insights
- The most prevalent minimum stay requirement in Rijswijk is 7-29 Nights, adopted by 27% of listings. This highlights the market's preference for shorter, flexible bookings.
- A significant segment (18.9%) caters to monthly stays (30+ nights) in Rijswijk, pointing to opportunities in the extended-stay market.
Recommendations
- Align with the market by considering a 7-29 Nights minimum stay, as 27% of Rijswijk hosts use this setting.
- If feasible, allowing 1-night stays, especially midweek or during low season, could capture last-minute bookings, as only 13.5% currently do.
- Explore offering discounts for stays of 30+ nights to attract the 18.9% of the market seeking extended stays.
- Adjust minimum nights based on seasonality – potentially shorter during low season and longer during peak demand periods in Rijswijk.
Rijswijk Airbnb Cancellation Policy Trends Analysis (2025)
Flexible
9 listings
25.7% of total
Moderate
5 listings
14.3% of total
Firm
4 listings
11.4% of total
Strict
17 listings
48.6% of total
Cancellation Policy Insights for Rijswijk
- The prevailing Airbnb cancellation policy trend in Rijswijk is Strict, used by 48.6% of listings.
- A majority (60.0%) of hosts in Rijswijk utilize Firm or Strict policies, indicating a market where hosts prioritize booking security.
Recommendations for Hosts
- Consider adopting a Strict policy to align with the 48.6% market standard in Rijswijk.
- With 48.6% using Strict terms, this is a viable option in Rijswijk, particularly for high-value properties or during peak demand periods.
- Regularly review your cancellation policy against competitors and market demand shifts in Rijswijk.
Rijswijk STR Booking Lead Time Analysis (2025)
Average Booking Lead Time by Month
Booking Lead Time Insights for Rijswijk
- The overall average booking lead time for vacation rentals in Rijswijk is 65 days.
- Guests book furthest in advance for stays during July (average 112 days), likely coinciding with peak travel demand or local events.
- The shortest booking windows occur for stays in December (average 52 days), indicating more last-minute travel plans during this time.
- Seasonally, Summer (94 days avg.) sees the longest lead times, while Winter (54 days avg.) has the shortest, reflecting typical travel planning cycles.
Recommendations for Hosts
- Use the overall average lead time (65 days) as a baseline for your pricing and availability strategy in Rijswijk.
- For July stays, consider implementing length-of-stay discounts or slightly higher rates for bookings made less than 112 days out to capitalize on advance planning.
- Target marketing efforts for the Summer season well in advance (at least 94 days) to capture early planners.
- Monitor your own booking lead times against these Rijswijk averages to identify opportunities for dynamic pricing adjustments.
Popular & Essential Airbnb Amenities in Rijswijk (2025)
Amenity Prevalence
Amenity Insights for Rijswijk
- Essential amenities in Rijswijk that guests expect include: Wifi, Heating. Lacking these (any) could significantly impact bookings.
- Popular amenities like Kitchen, Essentials, Smoke alarm are common but not universal. Offering these can provide a competitive edge.
Recommendations for Hosts
- Ensure your listing includes all essential amenities for Rijswijk: Wifi, Heating.
- Consider adding popular differentiators like Kitchen or Essentials to increase appeal.
- Highlight unique or less common amenities you offer (e.g., hot tub, dedicated workspace, EV charger) in your listing description and photos.
- Regularly check competitor amenities in Rijswijk to stay competitive.
Rijswijk Airbnb Guest Demographics & Profile Analysis (2025)
Guest Profile Summary for Rijswijk
- The typical guest profile for Airbnb in Rijswijk consists of predominantly international visitors (89%), with top international origins including France, typically belonging to the Post-2000s (Gen Z/Alpha) group (50%), primarily speaking English or German.
- Domestic travelers account for 10.9% of guests.
- Key international markets include Germany (26.6%) and France (10.9%).
- Top languages spoken are English (42.2%) followed by German (19.6%).
- A significant demographic segment is the Post-2000s (Gen Z/Alpha) group, representing 50% of guests.
Recommendations for Hosts
- Focus marketing internationally, particularly towards travelers from France.
- Tailor amenities and listing descriptions to appeal to the dominant Post-2000s (Gen Z/Alpha) demographic (e.g., highlight fast WiFi, smart home features, local guides).
- Highlight unique local experiences or amenities relevant to the primary guest profile.
- Consider seasonal promotions aligned with peak travel times for key origin markets.
Nearby Short-Term Rental Market Comparison
How does the Rijswijk Airbnb market stack up against its neighbors? Compare key performance metrics like average monthly revenue, ADR, and occupancy rates in surrounding areas to understand the broader regional STR landscape.
| Market | Active Properties | Monthly Revenue | Daily Rate | Avg. Occupancy |
|---|---|---|---|---|
| Kockengen | 12 | $7,560 | $396.31 | 61% |
| Bentveld | 13 | $4,798 | $443.61 | 54% |
| Halfweg | 17 | $4,307 | $231.13 | 55% |
| Aerdenhout | 17 | $4,288 | $694.02 | 53% |
| Merksplas | 10 | $3,885 | $256.59 | 44% |
| Oud Ade | 17 | $3,779 | $277.47 | 51% |
| Rijs | 27 | $3,772 | $356.97 | 45% |
| Zwanenburg | 24 | $3,720 | $240.77 | 66% |
| Kerkdriel | 25 | $3,607 | $323.16 | 40% |
| Brecht | 10 | $3,531 | $251.70 | 54% |