Reeuwijk Airbnb Market Analysis 2025: Short Term Rental Data & Vacation Rental Statistics in South Holland, Netherlands
Is Airbnb profitable in Reeuwijk in 2025? Explore comprehensive Airbnb analytics for Reeuwijk, South Holland, Netherlands to uncover income potential. This 2025 STR market report for Reeuwijk, based on AirROI data from April 2024 to March 2025, reveals key trends in the niche market of 24 active listings.
Whether you're considering an Airbnb investment in Reeuwijk, optimizing your existing vacation rental, or exploring rental arbitrage opportunities, understanding the Reeuwijk Airbnb data is crucial. Leveraging the low regulation environment is key to maximizing your short term rental income potential. Let's dive into the specifics.
Key Reeuwijk Airbnb Performance Metrics Overview
Monthly Airbnb Revenue Variations & Income Potential in Reeuwijk (2025)
Understanding the monthly revenue variations for Airbnb listings in Reeuwijk is key to maximizing your short term rental income potential. Seasonality significantly impacts earnings. Our analysis, based on data from the past 12 months, shows that the peak revenue month for STRs in Reeuwijk is typically May, while December often presents the lowest earnings, highlighting opportunities for strategic pricing adjustments during shoulder and low seasons. Explore the typical Airbnb income in Reeuwijk across different performance tiers:
- Best-in-class properties (Top 10%) achieve $6,863+ monthly, often utilizing dynamic pricing and superior guest experiences.
- Strong performing properties (Top 25%) earn $3,915 or more, indicating effective management and desirable locations/amenities.
- Typical properties (Median) generate around $2,217 per month, representing the average market performance.
- Entry-level properties (Bottom 25%) see earnings around $1,172, often with potential for optimization.
Average Monthly Airbnb Earnings Trend in Reeuwijk
Reeuwijk Airbnb Occupancy Rate Trends (2025)
Maximize your bookings by understanding the Reeuwijk STR occupancy trends. Seasonal demand shifts significantly influence how often properties are booked. Typically, Augustsees the highest demand (peak season occupancy), while February experiences the lowest (low season). Effective strategies, like adjusting minimum stays or offering promotions, can boost occupancy during slower periods. Here's how different property tiers perform in Reeuwijk:
- Best-in-class properties (Top 10%) achieve 81%+ occupancy, indicating high desirability and potentially optimized availability.
- Strong performing properties (Top 25%) maintain 68% or higher occupancy, suggesting good market fit and guest satisfaction.
- Typical properties (Median) have an occupancy rate around 46%.
- Entry-level properties (Bottom 25%) average 22% occupancy, potentially facing higher vacancy.
Average Monthly Occupancy Rate Trend in Reeuwijk
Average Daily Rate (ADR) Airbnb Trends in Reeuwijk (2025)
Effective short term rental pricing strategy in Reeuwijk involves understanding monthly ADR fluctuations. The Average Daily Rate (ADR) for Airbnb in Reeuwijk typically peaks in December and dips lowest during February. Leveraging Airbnb dynamic pricing tools or strategies based on this seasonality can significantly boost revenue. Here's a look at the typical nightly rates achieved:
- Best-in-class properties (Top 10%) command rates of $354+ per night, often due to premium features or locations.
- Strong performing properties (Top 25%) achieve nightly rates of $282 or more.
- Typical properties (Median) charge around $177 per night.
- Entry-level properties (Bottom 25%) earn around $133 per night.
Average Daily Rate (ADR) Trend by Month in Reeuwijk
Get Live Reeuwijk Market Intelligence 👇

Explore Real-time Analytics
Airbnb Seasonality Analysis & Trends in Reeuwijk (2025)
Peak Season (May, April, August)
- Revenue averages $4,080 per month
- Occupancy rates average 55.3%
- Daily rates average $215
Shoulder Season
- Revenue averages $3,038 per month
- Occupancy maintains around 46.5%
- Daily rates hold near $213
Low Season (February, March, December)
- Revenue drops to average $2,052 per month
- Occupancy decreases to average 32.9%
- Daily rates adjust to average $210
Seasonality Insights for Reeuwijk
- The Airbnb seasonality in Reeuwijk shows highly seasonal trends requiring careful strategy. While the sections above show seasonal averages, it's also insightful to look at the extremes:
- During the high season, the absolute peak month showcases Reeuwijk's highest earning potential, with monthly revenues capable of climbing to $4,229, occupancy reaching a high of 60.9%, and ADRs peaking at $217.
- Conversely, the slowest single month of the year, typically falling within the low season, marks the market's lowest point. In this month, revenue might dip to $1,993, occupancy could drop to 31.5%, and ADRs may adjust down to $206.
- Understanding both the seasonal averages and these monthly peaks and troughs in revenue, occupancy, and ADR is crucial for maximizing your Airbnb profit potential in Reeuwijk.
Seasonal Strategies for Maximizing Profit
- Peak Season: Maximize revenue through premium pricing and potentially longer minimum stays. Ensure high availability.
- Low Season: Offer competitive pricing, special promotions (e.g., extended stay discounts), and flexible cancellation policies. Target off-season travelers like remote workers or budget-conscious guests.
- Shoulder Seasons: Implement dynamic pricing that balances peak and low rates. Target weekend travelers or specific events. Offer slightly more flexible terms than peak season.
- Regularly analyze your own performance against these Reeuwijk seasonality benchmarks and adjust your pricing and availability strategy accordingly.
Best Areas for Airbnb Investment in Reeuwijk (2025)
Exploring the top neighborhoods for short-term rentals in Reeuwijk? This section highlights key areas, outlining why they are attractive for hosts and guests, along with notable local attractions. Consider these locations based on your target guest profile and investment strategy.
| Neighborhood / Area | Why Host Here? (Target Guests & Appeal) | Key Attractions & Landmarks |
|---|---|---|
| Poldergebied Reeuwijk | A picturesque polder landscape perfect for nature lovers and those seeking tranquility. Ideal for guests looking for a peaceful retreat with stunning views and outdoor activities. | Reeuwijkse Plassen, De Bovenlanden, Natuurreservaat De Kock, Boven-Hardinxveld, Cycling routes |
| Reeuwijk Village | Charming village atmosphere with historical architecture and local shops. A great location for travelers wanting an authentic Dutch experience. | Church of St. John the Evangelist, Local markets, Traditional Dutch houses |
| Boven-Hardinxveld | Great for families and groups, offering spacious homes and recreational activities. Close proximity to parks and playgrounds makes it ideal for family stays. | Hardinxveld Golf Club, Schools and play areas, Cycling paths |
| Leiden | Nearby city renowned for its rich history and vibrant cultural scene. Perfect for tourists who wish to explore museums and historic sites within a short drive. | Rijksmuseum van Oudheden, Botanical garden, Leiden University, Historical buildings |
| Gouda | Famous for its cheese and historical architecture, Gouda attracts foodies and history enthusiasts. A short drive away, guests can market for fresh local produce. | Gouda Cheese Market, St. Janskerk, Gouda's historic town center |
| Zoetermeer | A growing city on the outskirts of The Hague with various entertainment options. Popular with business travelers and families visiting nearby attractions. | SnowWorld Zoetermeer, Indoor Playgrounds, Parks & trails |
| Utrecht | A lively city that blends history with modernity, making it attractive for both tourists and business travelers. Close enough for day trips from Reeuwijk. | Utrecht University, Dom Tower, Canals of Utrecht |
| The Hague | A cultural and political hub with numerous museums and international attractions. Perfect for guests seeking a blend of business and leisure activities. | Mauritshuis, Peace Palace, Scheveningen Beach |
Understanding Airbnb License Requirements & STR Laws in Reeuwijk (2025)
While Reeuwijk, South Holland, Netherlands currently shows low STR regulations, specific Airbnb license requirements might still exist or change. Always verify the latest short term rental regulations and Airbnb license requirements directly with local government authorities for Reeuwijk to ensure full compliance before hosting.
(Source: AirROI data, 2025, finding no licensed listings among those analyzed)
Top Performing Airbnb Properties in Reeuwijk (2025)
Benchmark your potential! Explore examples of top-performing Airbnb properties in Reeuwijkbased on Trailing Twelve Month (TTM) revenue. Analyze their characteristics, revenue, occupancy rate, and ADR to understand what drives success in this market.

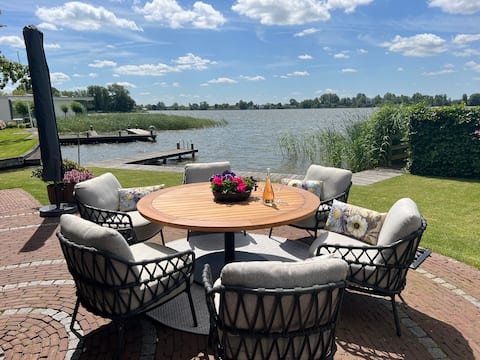
Luxury stay on the Reeuwijk lakes
Entire Place • 2 bedrooms
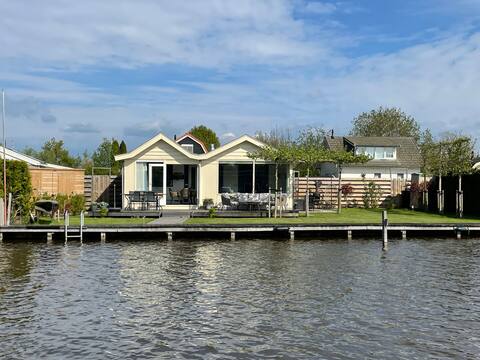
Luxury home directly on the waterfront
Entire Place • 4 bedrooms
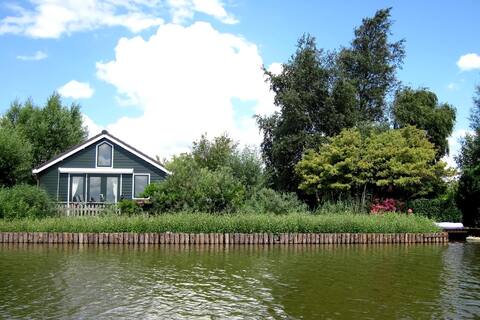
Fantastic lake house on the waterfront
Entire Place • 2 bedrooms

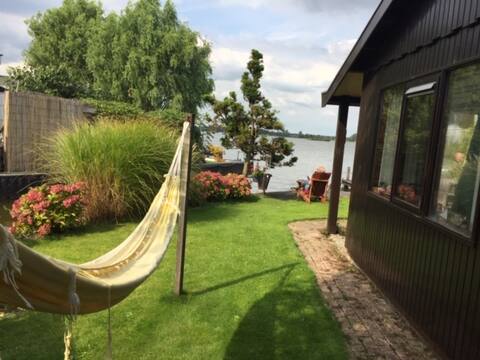
Detached house on the lake
Entire Place • 2 bedrooms
Idyllic cottage by the lake
Entire Place • 3 bedrooms
“The Outpost Lakehouse” fine puddle house in Reeuwijk
Entire Place • 2 bedrooms
Note: Performance varies based on location, size, amenities, seasonality, and management quality. Data reflects the past 12 months.
Top Performing Airbnb Hosts in Reeuwijk (2025)
Learn from the best! This table showcases top-performing Airbnb hosts in Reeuwijk based on the number of properties managed and estimated total revenue over the past year. Analyze their scale and performance metrics.
| Host Name | Properties | Grossing Revenue | Stay Reviews | Avg Rating |
|---|---|---|---|---|
| Romy | 1 | $92,294 | 44 | 4.95/5.0 |
| Frederika | 3 | $57,461 | 301 | 4.87/5.0 |
| Joan | 1 | $57,253 | 17 | 5.00/5.0 |
| Host #98001089 | 1 | $40,026 | 20 | 5.00/5.0 |
| Jorrit | 1 | $39,826 | 28 | 4.89/5.0 |
| Jacomine | 1 | $37,115 | 65 | 4.95/5.0 |
| Marleen En Jos | 1 | $32,471 | 28 | 4.93/5.0 |
| Noor En Mat | 1 | $29,675 | 136 | 4.98/5.0 |
| Daan | 1 | $28,781 | 10 | 5.00/5.0 |
| Host #151505479 | 1 | $22,790 | 1 | 0.00/5.0 |
Analyzing the strategies of top hosts, such as their property selection, pricing, and guest communication, can offer valuable lessons for optimizing your own Airbnb operations in Reeuwijk.
Dive Deeper: Advanced Reeuwijk STR Market Data (2025)
Ready to unlock more insights? AirROI provides access to advanced metrics and comprehensive Airbnb data for Reeuwijk. Explore detailed analytics beyond this report to refine your investment strategy, optimize pricing, and maximize your vacation rental profits.
Explore Advanced MetricsReeuwijk Short-Term Rental Market Composition (2025): Property & Room Types
Room Type Distribution
Property Type Distribution
Market Composition Insights for Reeuwijk
- The Reeuwijk Airbnb market composition is heavily skewed towards Entire Home/Apt listings, which make up 91.7% of the 24 active rentals. This indicates strong guest preference for privacy and space.
- Looking at the property type distribution in Reeuwijk, House properties are the most common (75%), reflecting the local real estate landscape.
- Houses represent a significant 75% portion, catering likely to families or larger groups.
- Smaller segments like hotel/boutique, unique stays, outdoor/unique (combined 12.6%) offer potential for unique stay experiences.
Reeuwijk Airbnb Room Capacity Analysis (2025): Bedroom Distribution
Distribution of Listings by Number of Bedrooms
Room Capacity Insights for Reeuwijk
- The dominant room capacity in Reeuwijk is 2 bedrooms listings, making up 41.7% of the market. This suggests a strong demand for properties suitable for couples or solo travelers.
- Together, 2 bedrooms and 3 bedrooms properties represent 62.5% of the active Airbnb listings in Reeuwijk, indicating a high concentration in these sizes.
- A significant 25.0% of listings offer 3+ bedrooms, catering to larger groups and families seeking more space in Reeuwijk.
Reeuwijk Vacation Rental Guest Capacity Trends (2025)
Distribution of Listings by Guest Capacity
Guest Capacity Insights for Reeuwijk
- The most common guest capacity trend in Reeuwijk vacation rentals is listings accommodating 5 guests (25%). This suggests the primary traveler segment is likely larger groups.
- Properties designed for 5 guests and 2 guests dominate the Reeuwijk STR market, accounting for 50.0% of listings.
- 12.5% of properties accommodate 6+ guests, serving the market segment for larger families or group travel in Reeuwijk.
- On average, properties in Reeuwijk are equipped to host 3.7 guests.
Reeuwijk Airbnb Booking Patterns (2025): Available vs. Booked Days
Available Days Distribution
Booked Days Distribution
Booking Pattern Insights for Reeuwijk
- The most common availability pattern in Reeuwijk falls within the 271-366 days range, representing 37.5% of listings. This suggests many properties have significant open periods on their calendars.
- Approximately 70.8% of listings show high availability (181+ days open annually), indicating potential for increased bookings or specific owner usage patterns.
- For booked days, the 91-180 days range is most frequent in Reeuwijk (37.5%), reflecting common guest stay durations or potential owner blocking patterns.
- A notable 29.2% of properties secure long booking periods (181+ days booked per year), highlighting successful long-term rental strategies or significant owner usage.
Reeuwijk Airbnb Minimum Stay Requirements Analysis
Distribution of Listings by Minimum Night Requirement
1 Night
4 listings
18.2% of total
2 Nights
5 listings
22.7% of total
3 Nights
6 listings
27.3% of total
4-6 Nights
7 listings
31.8% of total
Key Insights
- The most prevalent minimum stay requirement in Reeuwijk is 4-6 Nights, adopted by 31.8% of listings. This highlights the market's preference for longer commitments.
Recommendations
- Align with the market by considering a 4-6 Nights minimum stay, as 31.8% of Reeuwijk hosts use this setting.
- If feasible, allowing 1-night stays, especially midweek or during low season, could capture last-minute bookings, as only 18.2% currently do.
- Adjust minimum nights based on seasonality – potentially shorter during low season and longer during peak demand periods in Reeuwijk.
Reeuwijk Airbnb Cancellation Policy Trends Analysis (2025)
Flexible
3 listings
16.7% of total
Moderate
5 listings
27.8% of total
Firm
4 listings
22.2% of total
Strict
6 listings
33.3% of total
Cancellation Policy Insights for Reeuwijk
- The prevailing Airbnb cancellation policy trend in Reeuwijk is Strict, used by 33.3% of listings.
- A majority (55.5%) of hosts in Reeuwijk utilize Firm or Strict policies, indicating a market where hosts prioritize booking security.
Recommendations for Hosts
- Consider adopting a Strict policy to align with the 33.3% market standard in Reeuwijk.
- With 33.3% using Strict terms, this is a viable option in Reeuwijk, particularly for high-value properties or during peak demand periods.
- Regularly review your cancellation policy against competitors and market demand shifts in Reeuwijk.
Reeuwijk STR Booking Lead Time Analysis (2025)
Average Booking Lead Time by Month
Booking Lead Time Insights for Reeuwijk
- The overall average booking lead time for vacation rentals in Reeuwijk is 56 days.
- Guests book furthest in advance for stays during July (average 130 days), likely coinciding with peak travel demand or local events.
- The shortest booking windows occur for stays in December (average 39 days), indicating more last-minute travel plans during this time.
- Seasonally, Summer (102 days avg.) sees the longest lead times, while Winter (46 days avg.) has the shortest, reflecting typical travel planning cycles.
Recommendations for Hosts
- Use the overall average lead time (56 days) as a baseline for your pricing and availability strategy in Reeuwijk.
- For July stays, consider implementing length-of-stay discounts or slightly higher rates for bookings made less than 130 days out to capitalize on advance planning.
- Target marketing efforts for the Summer season well in advance (at least 102 days) to capture early planners.
- Monitor your own booking lead times against these Reeuwijk averages to identify opportunities for dynamic pricing adjustments.
Popular & Essential Airbnb Amenities in Reeuwijk (2025)
Amenity Prevalence
Amenity Insights for Reeuwijk
- Essential amenities in Reeuwijk that guests expect include: Hot water, Smoke alarm, Heating. Lacking these (any) could significantly impact bookings.
- Popular amenities like Dishes and silverware, Hangers, Refrigerator are common but not universal. Offering these can provide a competitive edge.
- Warning: Wifi is not universally provided but is considered essential globally. Ensure reliable Wifi is offered.
Recommendations for Hosts
- Ensure your listing includes all essential amenities for Reeuwijk: Hot water, Smoke alarm, Heating.
- Prioritize adding missing essentials: Hot water, Smoke alarm, Heating.
- Consider adding popular differentiators like Dishes and silverware or Hangers to increase appeal.
- Highlight unique or less common amenities you offer (e.g., hot tub, dedicated workspace, EV charger) in your listing description and photos.
- Regularly check competitor amenities in Reeuwijk to stay competitive.
Reeuwijk Airbnb Guest Demographics & Profile Analysis (2025)
Guest Profile Summary for Reeuwijk
- The typical guest profile for Airbnb in Reeuwijk consists of predominantly international visitors (86%), with top international origins including France, typically belonging to the Post-2000s (Gen Z/Alpha) group (50%), primarily speaking English or German.
- Domestic travelers account for 14.5% of guests.
- Key international markets include Germany (33.1%) and France (17.7%).
- Top languages spoken are English (38.8%) followed by German (25.2%).
- A significant demographic segment is the Post-2000s (Gen Z/Alpha) group, representing 50% of guests.
Recommendations for Hosts
- Focus marketing internationally, particularly towards travelers from France.
- Tailor amenities and listing descriptions to appeal to the dominant Post-2000s (Gen Z/Alpha) demographic (e.g., highlight fast WiFi, smart home features, local guides).
- Highlight unique local experiences or amenities relevant to the primary guest profile.
- Consider seasonal promotions aligned with peak travel times for key origin markets.
Nearby Short-Term Rental Market Comparison
How does the Reeuwijk Airbnb market stack up against its neighbors? Compare key performance metrics like average monthly revenue, ADR, and occupancy rates in surrounding areas to understand the broader regional STR landscape.
| Market | Active Properties | Monthly Revenue | Daily Rate | Avg. Occupancy |
|---|---|---|---|---|
| Kockengen | 12 | $7,560 | $396.31 | 61% |
| Bentveld | 13 | $4,798 | $443.61 | 54% |
| Halfweg | 17 | $4,307 | $231.13 | 55% |
| Aerdenhout | 17 | $4,288 | $694.02 | 53% |
| Merksplas | 10 | $3,885 | $256.59 | 44% |
| Oud Ade | 17 | $3,779 | $277.47 | 51% |
| Rijs | 27 | $3,772 | $356.97 | 45% |
| Zwanenburg | 24 | $3,720 | $240.77 | 66% |
| Kerkdriel | 25 | $3,607 | $323.16 | 40% |
| Brecht | 10 | $3,531 | $251.70 | 54% |