Nieuwkoop Airbnb Market Analysis 2025: Short Term Rental Data & Vacation Rental Statistics in South Holland, Netherlands
Is Airbnb profitable in Nieuwkoop in 2025? Explore comprehensive Airbnb analytics for Nieuwkoop, South Holland, Netherlands to uncover income potential. This 2025 STR market report for Nieuwkoop, based on AirROI data from April 2024 to March 2025, reveals key trends in the niche market of 37 active listings.
Whether you're considering an Airbnb investment in Nieuwkoop, optimizing your existing vacation rental, or exploring rental arbitrage opportunities, understanding the Nieuwkoop Airbnb data is crucial. Leveraging the low regulation environment is key to maximizing your short term rental income potential. Let's dive into the specifics.
Key Nieuwkoop Airbnb Performance Metrics Overview
Monthly Airbnb Revenue Variations & Income Potential in Nieuwkoop (2025)
Understanding the monthly revenue variations for Airbnb listings in Nieuwkoop is key to maximizing your short term rental income potential. Seasonality significantly impacts earnings. Our analysis, based on data from the past 12 months, shows that the peak revenue month for STRs in Nieuwkoop is typically July, while February often presents the lowest earnings, highlighting opportunities for strategic pricing adjustments during shoulder and low seasons. Explore the typical Airbnb income in Nieuwkoop across different performance tiers:
- Best-in-class properties (Top 10%) achieve $4,862+ monthly, often utilizing dynamic pricing and superior guest experiences.
- Strong performing properties (Top 25%) earn $3,514 or more, indicating effective management and desirable locations/amenities.
- Typical properties (Median) generate around $2,159 per month, representing the average market performance.
- Entry-level properties (Bottom 25%) see earnings around $1,062, often with potential for optimization.
Average Monthly Airbnb Earnings Trend in Nieuwkoop
Nieuwkoop Airbnb Occupancy Rate Trends (2025)
Maximize your bookings by understanding the Nieuwkoop STR occupancy trends. Seasonal demand shifts significantly influence how often properties are booked. Typically, Augustsees the highest demand (peak season occupancy), while February experiences the lowest (low season). Effective strategies, like adjusting minimum stays or offering promotions, can boost occupancy during slower periods. Here's how different property tiers perform in Nieuwkoop:
- Best-in-class properties (Top 10%) achieve 80%+ occupancy, indicating high desirability and potentially optimized availability.
- Strong performing properties (Top 25%) maintain 64% or higher occupancy, suggesting good market fit and guest satisfaction.
- Typical properties (Median) have an occupancy rate around 42%.
- Entry-level properties (Bottom 25%) average 23% occupancy, potentially facing higher vacancy.
Average Monthly Occupancy Rate Trend in Nieuwkoop
Average Daily Rate (ADR) Airbnb Trends in Nieuwkoop (2025)
Effective short term rental pricing strategy in Nieuwkoop involves understanding monthly ADR fluctuations. The Average Daily Rate (ADR) for Airbnb in Nieuwkoop typically peaks in July and dips lowest during March. Leveraging Airbnb dynamic pricing tools or strategies based on this seasonality can significantly boost revenue. Here's a look at the typical nightly rates achieved:
- Best-in-class properties (Top 10%) command rates of $238+ per night, often due to premium features or locations.
- Strong performing properties (Top 25%) achieve nightly rates of $193 or more.
- Typical properties (Median) charge around $153 per night.
- Entry-level properties (Bottom 25%) earn around $116 per night.
Average Daily Rate (ADR) Trend by Month in Nieuwkoop
Get Live Nieuwkoop Market Intelligence 👇

Explore Real-time Analytics
Airbnb Seasonality Analysis & Trends in Nieuwkoop (2025)
Peak Season (July, August, June)
- Revenue averages $3,192 per month
- Occupancy rates average 51.9%
- Daily rates average $174
Shoulder Season
- Revenue averages $2,721 per month
- Occupancy maintains around 48.6%
- Daily rates hold near $169
Low Season (February, March, September)
- Revenue drops to average $1,523 per month
- Occupancy decreases to average 32.7%
- Daily rates adjust to average $165
Seasonality Insights for Nieuwkoop
- The Airbnb seasonality in Nieuwkoop shows highly seasonal trends requiring careful strategy. While the sections above show seasonal averages, it's also insightful to look at the extremes:
- During the high season, the absolute peak month showcases Nieuwkoop's highest earning potential, with monthly revenues capable of climbing to $3,219, occupancy reaching a high of 56.0%, and ADRs peaking at $176.
- Conversely, the slowest single month of the year, typically falling within the low season, marks the market's lowest point. In this month, revenue might dip to $1,036, occupancy could drop to 26.3%, and ADRs may adjust down to $162.
- Understanding both the seasonal averages and these monthly peaks and troughs in revenue, occupancy, and ADR is crucial for maximizing your Airbnb profit potential in Nieuwkoop.
Seasonal Strategies for Maximizing Profit
- Peak Season: Maximize revenue through premium pricing and potentially longer minimum stays. Ensure high availability.
- Low Season: Offer competitive pricing, special promotions (e.g., extended stay discounts), and flexible cancellation policies. Target off-season travelers like remote workers or budget-conscious guests.
- Shoulder Seasons: Implement dynamic pricing that balances peak and low rates. Target weekend travelers or specific events. Offer slightly more flexible terms than peak season.
- Regularly analyze your own performance against these Nieuwkoop seasonality benchmarks and adjust your pricing and availability strategy accordingly.
Best Areas for Airbnb Investment in Nieuwkoop (2025)
Exploring the top neighborhoods for short-term rentals in Nieuwkoop? This section highlights key areas, outlining why they are attractive for hosts and guests, along with notable local attractions. Consider these locations based on your target guest profile and investment strategy.
| Neighborhood / Area | Why Host Here? (Target Guests & Appeal) | Key Attractions & Landmarks |
|---|---|---|
| Nieuwkoop Centre | The heart of Nieuwkoop, offering local shops, restaurants, and a charming village vibe. It's convenient for both tourists and business travelers. | Nieuwkoopse Plassen, St. Bavo Church, Local shops, Restaurants, Bicycle rental offerings |
| Lake Nieuwkoop | A scenic area perfect for nature lovers and outdoor activities, attracting visitors seeking tranquility and natural beauty. | Kayaking, Fishing, Nature walks, Wildlife watching, Scenic views |
| De Bovenlanden | A picturesque rural area known for its landscapes and cycling paths. Ideal for guests wanting a quiet retreat and nature experiences. | Cycling routes, Nature reserves, Local farms, Birdwatching, Picnic spots |
| Noordeinde | A lively neighborhood with a mix of residential and rural charm, popular among guests looking for a local experience. | Markets, Close to nature, Local eateries, Community events, Farmers markets |
| Zaamslag | A peaceful village which provides a relaxing atmosphere, suitable for families and those looking to escape the city hustle. | Historical sites, Natural parks, Family-friendly activities, Small village charm, Community festivals |
| Oude Meer | An up-and-coming spot with beautiful nature views, attracting guests interested in watersports and leisure activities. | Watersports, Beaches, Picnic areas, Scenic trails, Food trucks |
| Nieuwkoopse Driemanspolder | Known for its rich biodiversity and nature trails, ideal for ecotourism and attracting environmentally conscious travelers. | Nature trails, Biodiversity tours, Photography opportunities, Educational tours, Relaxation areas |
| Woerdense Verlaat | A quaint hamlet offering a taste of traditional Dutch life and a gateway to explore the surrounding countryside. | Historic buildings, Scenic viewpoints, Local crafts, Quaint cafes, Bicycling paths |
Understanding Airbnb License Requirements & STR Laws in Nieuwkoop (2025)
While Nieuwkoop, South Holland, Netherlands currently shows low STR regulations, specific Airbnb license requirements might still exist or change. Always verify the latest short term rental regulations and Airbnb license requirements directly with local government authorities for Nieuwkoop to ensure full compliance before hosting.
(Source: AirROI data, 2025, finding no licensed listings among those analyzed)
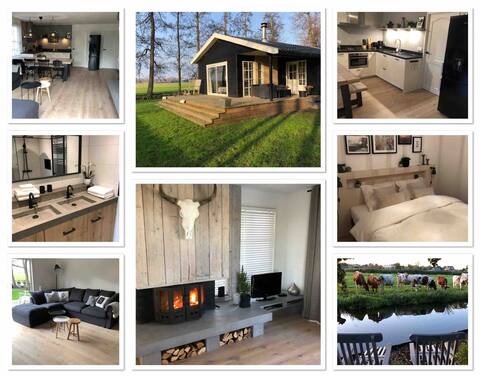
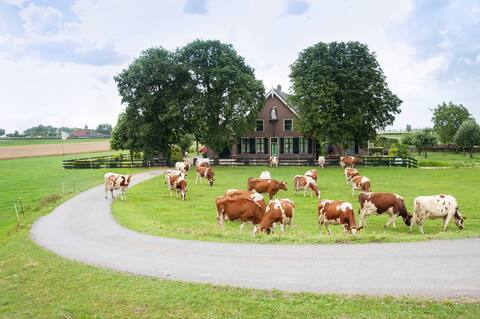
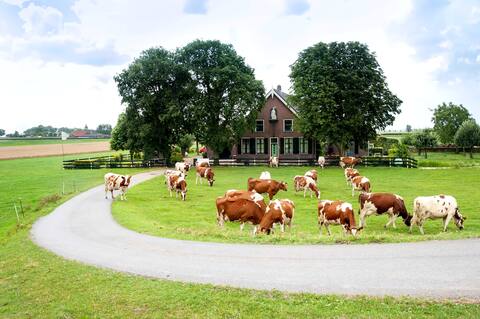
Top Performing Airbnb Properties in Nieuwkoop (2025)
Benchmark your potential! Explore examples of top-performing Airbnb properties in Nieuwkoopbased on Trailing Twelve Month (TTM) revenue. Analyze their characteristics, revenue, occupancy rate, and ADR to understand what drives success in this market.
Nature cottage on the water;Plenty of peace,spaciousness and nature
Entire Place • 2 bedrooms
3 bedroom apartment (6-7 people)
Entire Place • 3 bedrooms
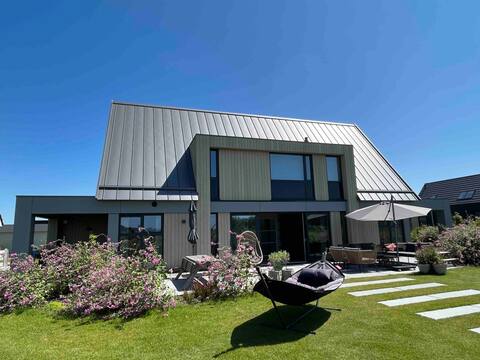
Unique Villa to Relax in Nature near Amsterdam
Entire Place • 3 bedrooms
2 bedroom apartment (4-6 people)
Entire Place • 2 bedrooms
Luxury old farmhouse near Amsterdam 4/5 persons
Entire Place • 2 bedrooms

Beautiful waterfront cottage with veranda
Entire Place • 1 bedroom
Note: Performance varies based on location, size, amenities, seasonality, and management quality. Data reflects the past 12 months.
Top Performing Airbnb Hosts in Nieuwkoop (2025)
Learn from the best! This table showcases top-performing Airbnb hosts in Nieuwkoop based on the number of properties managed and estimated total revenue over the past year. Analyze their scale and performance metrics.
| Host Name | Properties | Grossing Revenue | Stay Reviews | Avg Rating |
|---|---|---|---|---|
| Gerard | 4 | $162,366 | 172 | 4.77/5.0 |
| Ine | 1 | $59,397 | 440 | 4.86/5.0 |
| Marte | 2 | $55,897 | 69 | 4.97/5.0 |
| Anne Marieke | 1 | $55,527 | 9 | 5.00/5.0 |
| Host #22772326 | 2 | $43,083 | 101 | 4.73/5.0 |
| Ellen | 1 | $36,334 | 160 | 4.90/5.0 |
| Floris | 1 | $35,270 | 19 | 4.79/5.0 |
| Hotel | 2 | $30,943 | 59 | 4.56/5.0 |
| Lotte | 1 | $29,733 | 436 | 4.91/5.0 |
| Karel | 1 | $27,742 | 39 | 4.95/5.0 |
Analyzing the strategies of top hosts, such as their property selection, pricing, and guest communication, can offer valuable lessons for optimizing your own Airbnb operations in Nieuwkoop.
Dive Deeper: Advanced Nieuwkoop STR Market Data (2025)
Ready to unlock more insights? AirROI provides access to advanced metrics and comprehensive Airbnb data for Nieuwkoop. Explore detailed analytics beyond this report to refine your investment strategy, optimize pricing, and maximize your vacation rental profits.
Explore Advanced MetricsNieuwkoop Short-Term Rental Market Composition (2025): Property & Room Types
Room Type Distribution
Property Type Distribution
Market Composition Insights for Nieuwkoop
- The Nieuwkoop Airbnb market composition is heavily skewed towards Entire Home/Apt listings, which make up 83.8% of the 37 active rentals. This indicates strong guest preference for privacy and space.
- Looking at the property type distribution in Nieuwkoop, House properties are the most common (56.8%), reflecting the local real estate landscape.
- Houses represent a significant 56.8% portion, catering likely to families or larger groups.
- The presence of 10.8% Hotel/Boutique listings indicates integration with traditional hospitality.
- Smaller segments like others (combined 2.7%) offer potential for unique stay experiences.
Nieuwkoop Airbnb Room Capacity Analysis (2025): Bedroom Distribution
Distribution of Listings by Number of Bedrooms
Room Capacity Insights for Nieuwkoop
- The dominant room capacity in Nieuwkoop is 1 bedroom listings, making up 45.9% of the market. This suggests a strong demand for properties suitable for couples or solo travelers.
- Together, 1 bedroom and 2 bedrooms properties represent 75.6% of the active Airbnb listings in Nieuwkoop, indicating a high concentration in these sizes.
Nieuwkoop Vacation Rental Guest Capacity Trends (2025)
Distribution of Listings by Guest Capacity
Guest Capacity Insights for Nieuwkoop
- The most common guest capacity trend in Nieuwkoop vacation rentals is listings accommodating 2 guests (35.1%). This suggests the primary traveler segment is likely couples or solo travelers.
- Properties designed for 2 guests and 4 guests dominate the Nieuwkoop STR market, accounting for 54.0% of listings.
- 18.9% of properties accommodate 6+ guests, serving the market segment for larger families or group travel in Nieuwkoop.
- On average, properties in Nieuwkoop are equipped to host 3.3 guests.
Nieuwkoop Airbnb Booking Patterns (2025): Available vs. Booked Days
Available Days Distribution
Booked Days Distribution
Booking Pattern Insights for Nieuwkoop
- The most common availability pattern in Nieuwkoop falls within the 181-270 days range, representing 40.5% of listings. This suggests many properties have significant open periods on their calendars.
- Approximately 72.9% of listings show high availability (181+ days open annually), indicating potential for increased bookings or specific owner usage patterns.
- For booked days, the 91-180 days range is most frequent in Nieuwkoop (37.8%), reflecting common guest stay durations or potential owner blocking patterns.
- A notable 29.7% of properties secure long booking periods (181+ days booked per year), highlighting successful long-term rental strategies or significant owner usage.
Nieuwkoop Airbnb Minimum Stay Requirements Analysis
Distribution of Listings by Minimum Night Requirement
1 Night
11 listings
33.3% of total
2 Nights
13 listings
39.4% of total
3 Nights
2 listings
6.1% of total
4-6 Nights
2 listings
6.1% of total
7-29 Nights
1 listings
3% of total
30+ Nights
4 listings
12.1% of total
Key Insights
- The most prevalent minimum stay requirement in Nieuwkoop is 2 Nights, adopted by 39.4% of listings. This highlights the market's preference for shorter, flexible bookings.
- A strong majority (72.7%) of the Nieuwkoop Airbnb data shows acceptance of very short stays (1-2 nights), indicating a dynamic, high-turnover market.
- A significant segment (12.1%) caters to monthly stays (30+ nights) in Nieuwkoop, pointing to opportunities in the extended-stay market.
Recommendations
- Align with the market by considering a 2 Nights minimum stay, as 39.4% of Nieuwkoop hosts use this setting.
- Explore offering discounts for stays of 30+ nights to attract the 12.1% of the market seeking extended stays.
- Adjust minimum nights based on seasonality – potentially shorter during low season and longer during peak demand periods in Nieuwkoop.
Nieuwkoop Airbnb Cancellation Policy Trends Analysis (2025)
Super Strict 60 Days
4 listings
11.1% of total
Flexible
8 listings
22.2% of total
Moderate
10 listings
27.8% of total
Firm
5 listings
13.9% of total
Strict
9 listings
25% of total
Cancellation Policy Insights for Nieuwkoop
- The prevailing Airbnb cancellation policy trend in Nieuwkoop is Moderate, used by 27.8% of listings.
- There's a relatively balanced mix between guest-friendly (50.0%) and stricter (38.9%) policies, offering choices for different guest needs.
Recommendations for Hosts
- Consider adopting a Moderate policy to align with the 27.8% market standard in Nieuwkoop.
- Regularly review your cancellation policy against competitors and market demand shifts in Nieuwkoop.
Nieuwkoop STR Booking Lead Time Analysis (2025)
Average Booking Lead Time by Month
Booking Lead Time Insights for Nieuwkoop
- The overall average booking lead time for vacation rentals in Nieuwkoop is 57 days.
- Guests book furthest in advance for stays during June (average 82 days), likely coinciding with peak travel demand or local events.
- The shortest booking windows occur for stays in March (average 35 days), indicating more last-minute travel plans during this time.
- Seasonally, Summer (75 days avg.) sees the longest lead times, while Fall (54 days avg.) has the shortest, reflecting typical travel planning cycles.
Recommendations for Hosts
- Use the overall average lead time (57 days) as a baseline for your pricing and availability strategy in Nieuwkoop.
- For June stays, consider implementing length-of-stay discounts or slightly higher rates for bookings made less than 82 days out to capitalize on advance planning.
- Target marketing efforts for the Summer season well in advance (at least 75 days) to capture early planners.
- Monitor your own booking lead times against these Nieuwkoop averages to identify opportunities for dynamic pricing adjustments.
Popular & Essential Airbnb Amenities in Nieuwkoop (2025)
Amenity Prevalence
Amenity Insights for Nieuwkoop
- Popular amenities like Coffee maker, Heating, Smoke alarm are common but not universal. Offering these can provide a competitive edge.
- Warning: Wifi is not universally provided but is considered essential globally. Ensure reliable Wifi is offered.
Recommendations for Hosts
- Consider adding popular differentiators like Coffee maker or Heating to increase appeal.
- Highlight unique or less common amenities you offer (e.g., hot tub, dedicated workspace, EV charger) in your listing description and photos.
- Regularly check competitor amenities in Nieuwkoop to stay competitive.
Nieuwkoop Airbnb Guest Demographics & Profile Analysis (2025)
Guest Profile Summary for Nieuwkoop
- The typical guest profile for Airbnb in Nieuwkoop consists of predominantly international visitors (85%), with top international origins including France, typically belonging to the Post-2000s (Gen Z/Alpha) group (50%), primarily speaking English or German.
- Domestic travelers account for 15.0% of guests.
- Key international markets include Germany (22.9%) and France (15.4%).
- Top languages spoken are English (42.2%) followed by German (16.9%).
- A significant demographic segment is the Post-2000s (Gen Z/Alpha) group, representing 50% of guests.
Recommendations for Hosts
- Focus marketing internationally, particularly towards travelers from France.
- Tailor amenities and listing descriptions to appeal to the dominant Post-2000s (Gen Z/Alpha) demographic (e.g., highlight fast WiFi, smart home features, local guides).
- Highlight unique local experiences or amenities relevant to the primary guest profile.
- Consider seasonal promotions aligned with peak travel times for key origin markets.
Nearby Short-Term Rental Market Comparison
How does the Nieuwkoop Airbnb market stack up against its neighbors? Compare key performance metrics like average monthly revenue, ADR, and occupancy rates in surrounding areas to understand the broader regional STR landscape.
| Market | Active Properties | Monthly Revenue | Daily Rate | Avg. Occupancy |
|---|---|---|---|---|
| Kockengen | 12 | $7,560 | $396.31 | 61% |
| Bentveld | 13 | $4,798 | $443.61 | 54% |
| Halfweg | 17 | $4,307 | $231.13 | 55% |
| Aerdenhout | 17 | $4,288 | $694.02 | 53% |
| Merksplas | 10 | $3,885 | $256.59 | 44% |
| Oud Ade | 17 | $3,779 | $277.47 | 51% |
| Rijs | 27 | $3,772 | $356.97 | 45% |
| Zwanenburg | 24 | $3,720 | $240.77 | 66% |
| Kerkdriel | 25 | $3,607 | $323.16 | 40% |
| Brecht | 10 | $3,531 | $251.70 | 54% |