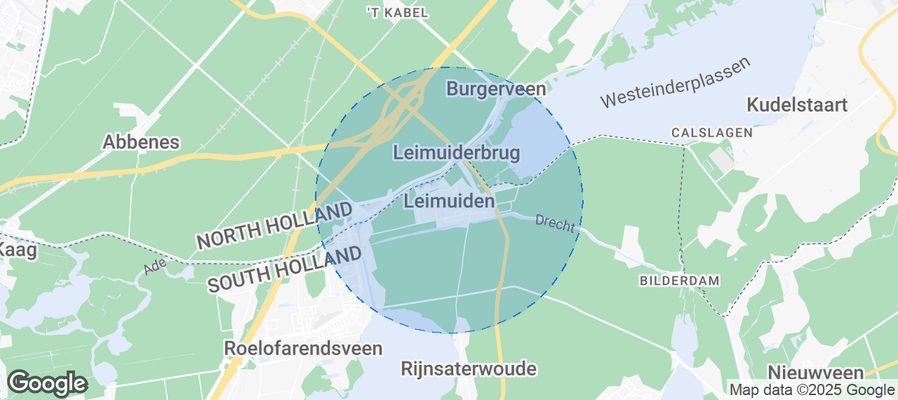
Leimuiden Airbnb Market Analysis 2025: Short Term Rental Data & Vacation Rental Statistics in South Holland, Netherlands
Is Airbnb profitable in Leimuiden in 2025? Explore comprehensive Airbnb analytics for Leimuiden, South Holland, Netherlands to uncover income potential. This 2025 STR market report for Leimuiden, based on AirROI data from April 2024 to March 2025, reveals key trends in the niche market of 21 active listings.
Whether you're considering an Airbnb investment in Leimuiden, optimizing your existing vacation rental, or exploring rental arbitrage opportunities, understanding the Leimuiden Airbnb data is crucial. Leveraging the low regulation environment is key to maximizing your short term rental income potential. Let's dive into the specifics.
Key Leimuiden Airbnb Performance Metrics Overview
Monthly Airbnb Revenue Variations & Income Potential in Leimuiden (2025)
Understanding the monthly revenue variations for Airbnb listings in Leimuiden is key to maximizing your short term rental income potential. Seasonality significantly impacts earnings. Our analysis, based on data from the past 12 months, shows that the peak revenue month for STRs in Leimuiden is typically April, while March often presents the lowest earnings, highlighting opportunities for strategic pricing adjustments during shoulder and low seasons. Explore the typical Airbnb income in Leimuiden across different performance tiers:
- Best-in-class properties (Top 10%) achieve $5,586+ monthly, often utilizing dynamic pricing and superior guest experiences.
- Strong performing properties (Top 25%) earn $4,080 or more, indicating effective management and desirable locations/amenities.
- Typical properties (Median) generate around $2,443 per month, representing the average market performance.
- Entry-level properties (Bottom 25%) see earnings around $1,401, often with potential for optimization.
Average Monthly Airbnb Earnings Trend in Leimuiden
Leimuiden Airbnb Occupancy Rate Trends (2025)
Maximize your bookings by understanding the Leimuiden STR occupancy trends. Seasonal demand shifts significantly influence how often properties are booked. Typically, Aprilsees the highest demand (peak season occupancy), while March experiences the lowest (low season). Effective strategies, like adjusting minimum stays or offering promotions, can boost occupancy during slower periods. Here's how different property tiers perform in Leimuiden:
- Best-in-class properties (Top 10%) achieve 89%+ occupancy, indicating high desirability and potentially optimized availability.
- Strong performing properties (Top 25%) maintain 68% or higher occupancy, suggesting good market fit and guest satisfaction.
- Typical properties (Median) have an occupancy rate around 43%.
- Entry-level properties (Bottom 25%) average 20% occupancy, potentially facing higher vacancy.
Average Monthly Occupancy Rate Trend in Leimuiden
Average Daily Rate (ADR) Airbnb Trends in Leimuiden (2025)
Effective short term rental pricing strategy in Leimuiden involves understanding monthly ADR fluctuations. The Average Daily Rate (ADR) for Airbnb in Leimuiden typically peaks in November and dips lowest during August. Leveraging Airbnb dynamic pricing tools or strategies based on this seasonality can significantly boost revenue. Here's a look at the typical nightly rates achieved:
- Best-in-class properties (Top 10%) command rates of $357+ per night, often due to premium features or locations.
- Strong performing properties (Top 25%) achieve nightly rates of $318 or more.
- Typical properties (Median) charge around $203 per night.
- Entry-level properties (Bottom 25%) earn around $94 per night.
Average Daily Rate (ADR) Trend by Month in Leimuiden
Get Live Leimuiden Market Intelligence 👇
Explore Real-time Analytics
Airbnb Seasonality Analysis & Trends in Leimuiden (2025)
Peak Season (April, May, October)
- Revenue averages $4,545 per month
- Occupancy rates average 56.2%
- Daily rates average $191
Shoulder Season
- Revenue averages $2,770 per month
- Occupancy maintains around 47.9%
- Daily rates hold near $196
Low Season (January, March, November)
- Revenue drops to average $1,563 per month
- Occupancy decreases to average 34.9%
- Daily rates adjust to average $233
Seasonality Insights for Leimuiden
- The Airbnb seasonality in Leimuiden shows highly seasonal trends requiring careful strategy. While the sections above show seasonal averages, it's also insightful to look at the extremes:
- During the high season, the absolute peak month showcases Leimuiden's highest earning potential, with monthly revenues capable of climbing to $5,192, occupancy reaching a high of 64.5%, and ADRs peaking at $236.
- Conversely, the slowest single month of the year, typically falling within the low season, marks the market's lowest point. In this month, revenue might dip to $1,111, occupancy could drop to 23.4%, and ADRs may adjust down to $166.
- Understanding both the seasonal averages and these monthly peaks and troughs in revenue, occupancy, and ADR is crucial for maximizing your Airbnb profit potential in Leimuiden.
Seasonal Strategies for Maximizing Profit
- Peak Season: Maximize revenue through premium pricing and potentially longer minimum stays. Ensure high availability.
- Low Season: Offer competitive pricing, special promotions (e.g., extended stay discounts), and flexible cancellation policies. Target off-season travelers like remote workers or budget-conscious guests.
- Shoulder Seasons: Implement dynamic pricing that balances peak and low rates. Target weekend travelers or specific events. Offer slightly more flexible terms than peak season.
- Regularly analyze your own performance against these Leimuiden seasonality benchmarks and adjust your pricing and availability strategy accordingly.
Best Areas for Airbnb Investment in Leimuiden (2025)
Exploring the top neighborhoods for short-term rentals in Leimuiden? This section highlights key areas, outlining why they are attractive for hosts and guests, along with notable local attractions. Consider these locations based on your target guest profile and investment strategy.
| Neighborhood / Area | Why Host Here? (Target Guests & Appeal) | Key Attractions & Landmarks |
|---|---|---|
| Leimuiden Center | The heart of Leimuiden, featuring local shops and quaint cafes. Convenient for guests wanting to explore the local culture and lifestyle. | Leimuiden Windmill, Local Market, Bicycle Rental, Canal Walks, Nearby Parks |
| Leimuiden Lakeside | A serene location by the water, perfect for nature lovers and families seeking outdoor activities and relaxation. | Leisure Lake, Fishing Spots, Picnic Areas, Watersports, Scenic Walking Trails |
| Leimuiden Nature Reserve | Ideal for ecotourism and bird watching, offering unique opportunities to explore the natural beauty of South Holland. | Birdwatching Areas, Nature Trails, Wildlife Photography, Guided Nature Walks |
| Nearby Kaag Island | Famous for its beautiful sailing routes and quaint atmosphere, attracting tourists looking for a charming getaway. | Sailing Activities, Restaurants on the Water, Cycle Paths, Historic Buildings, Cultural Events |
| Leiden | A nearby historic city known for its rich heritage and educational institutions, appealing to a diverse range of visitors. | Leiden University, National Museum of Antiquities, Botanical Gardens, Canal Tours, Historical Architecture |
| Nieuw-Vennep | A residential area with good transport connections to Amsterdam and Schiphol Airport, popular with business travelers and short-stay guests. | Shopping Malls, Business Parks, Public Transport Access, Recreation Areas, Local Dining |
| Haarlem | A vibrant city with a historical center, fantastic shopping, and cultural experiences, attracting both tourists and locals. | Frans Hals Museum, Haarlem's Corrie ten Boom House, Great Market, Historic Churches, Brewery Tours |
| Aalsmeer | Known for its flower auctions and stunning gardens, it’s a unique place that attracts visitors looking for a floral cultural experience. | Aalsmeer Flower Auction, Westeinderplassen Lake, Botanical Gardens, Historic Town Center, Local Cafes |
Understanding Airbnb License Requirements & STR Laws in Leimuiden (2025)
While Leimuiden, South Holland, Netherlands currently shows low STR regulations, specific Airbnb license requirements might still exist or change. Always verify the latest short term rental regulations and Airbnb license requirements directly with local government authorities for Leimuiden to ensure full compliance before hosting.
(Source: AirROI data, 2025, finding no licensed listings among those analyzed)
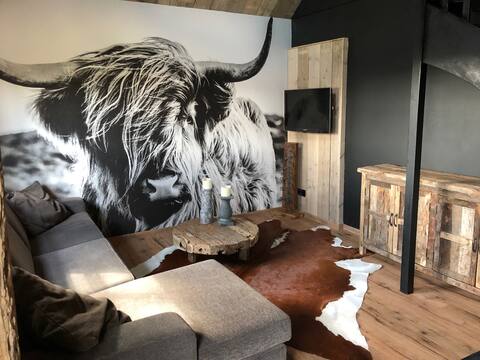
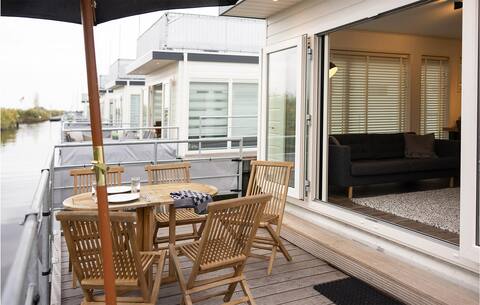
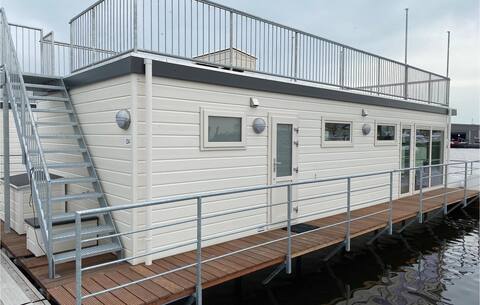
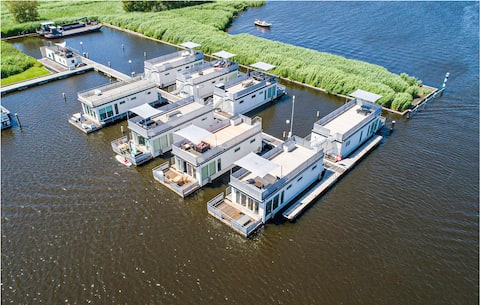
Top Performing Airbnb Properties in Leimuiden (2025)
Benchmark your potential! Explore examples of top-performing Airbnb properties in Leimuidenbased on Trailing Twelve Month (TTM) revenue. Analyze their characteristics, revenue, occupancy rate, and ADR to understand what drives success in this market.
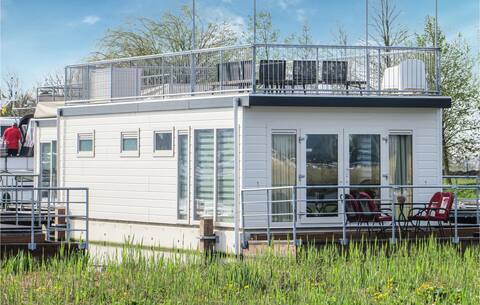
Bluff
Entire Place • 2 bedrooms
Atmospheric zen house in idyllic Bilderdam
Entire Place • 1 bedroom
2 bedroom cozy ship in Aalsmeer
Entire Place • 2 bedrooms

Rest in the Randstad (for vacation or work)
Entire Place • 2 bedrooms
Aqualiving Kempers
Entire Place • 2 bedrooms
d'azur
Entire Place • 2 bedrooms
Note: Performance varies based on location, size, amenities, seasonality, and management quality. Data reflects the past 12 months.
Top Performing Airbnb Hosts in Leimuiden (2025)
Learn from the best! This table showcases top-performing Airbnb hosts in Leimuiden based on the number of properties managed and estimated total revenue over the past year. Analyze their scale and performance metrics.
| Host Name | Properties | Grossing Revenue | Stay Reviews | Avg Rating |
|---|---|---|---|---|
| Novasol | 4 | $125,015 | 33 | 3.20/5.0 |
| Novasol | 4 | $114,008 | 24 | 4.09/5.0 |
| Host #410220920 | 2 | $47,008 | 12 | 2.30/5.0 |
| Yoney | 1 | $40,616 | 116 | 4.91/5.0 |
| Annemarie | 1 | $36,715 | 163 | 4.91/5.0 |
| Novasol | 3 | $35,785 | 14 | 3.12/5.0 |
| Novasol | 1 | $34,716 | 14 | 4.57/5.0 |
| T.M | 1 | $23,999 | 116 | 4.79/5.0 |
| Frans | 1 | $21,425 | 160 | 4.96/5.0 |
| Dea | 1 | $7,704 | 36 | 4.86/5.0 |
Analyzing the strategies of top hosts, such as their property selection, pricing, and guest communication, can offer valuable lessons for optimizing your own Airbnb operations in Leimuiden.
Dive Deeper: Advanced Leimuiden STR Market Data (2025)
Ready to unlock more insights? AirROI provides access to advanced metrics and comprehensive Airbnb data for Leimuiden. Explore detailed analytics beyond this report to refine your investment strategy, optimize pricing, and maximize your vacation rental profits.
Explore Advanced MetricsLeimuiden Short-Term Rental Market Composition (2025): Property & Room Types
Room Type Distribution
Property Type Distribution
Market Composition Insights for Leimuiden
- The Leimuiden Airbnb market composition is heavily skewed towards Entire Home/Apt listings, which make up 90.5% of the 21 active rentals. This indicates strong guest preference for privacy and space.
- Looking at the property type distribution in Leimuiden, Outdoor/Unique properties are the most common (76.2%), reflecting the local real estate landscape.
- Smaller segments like hotel/boutique, unique stays (combined 9.6%) offer potential for unique stay experiences.
Leimuiden Airbnb Room Capacity Analysis (2025): Bedroom Distribution
Distribution of Listings by Number of Bedrooms
Room Capacity Insights for Leimuiden
- The dominant room capacity in Leimuiden is 2 bedrooms listings, making up 76.2% of the market. This suggests a strong demand for properties suitable for couples or solo travelers.
- Together, 2 bedrooms and 1 bedroom properties represent 95.2% of the active Airbnb listings in Leimuiden, indicating a high concentration in these sizes.
Leimuiden Vacation Rental Guest Capacity Trends (2025)
Distribution of Listings by Guest Capacity
Guest Capacity Insights for Leimuiden
- The most common guest capacity trend in Leimuiden vacation rentals is listings accommodating 4 guests (47.6%). This suggests the primary traveler segment is likely small families or groups.
- Properties designed for 4 guests and 5 guests dominate the Leimuiden STR market, accounting for 76.2% of listings.
- On average, properties in Leimuiden are equipped to host 3.6 guests.
Leimuiden Airbnb Booking Patterns (2025): Available vs. Booked Days
Available Days Distribution
Booked Days Distribution
Booking Pattern Insights for Leimuiden
- The most common availability pattern in Leimuiden falls within the 271-366 days range, representing 57.1% of listings. This suggests many properties have significant open periods on their calendars.
- Approximately 85.7% of listings show high availability (181+ days open annually), indicating potential for increased bookings or specific owner usage patterns.
- For booked days, the 31-90 days range is most frequent in Leimuiden (38.1%), reflecting common guest stay durations or potential owner blocking patterns.
- A notable 14.3% of properties secure long booking periods (181+ days booked per year), highlighting successful long-term rental strategies or significant owner usage.
Leimuiden Airbnb Minimum Stay Requirements Analysis
Distribution of Listings by Minimum Night Requirement
1 Night
5 listings
26.3% of total
2 Nights
2 listings
10.5% of total
3 Nights
1 listings
5.3% of total
30+ Nights
11 listings
57.9% of total
Key Insights
- The most prevalent minimum stay requirement in Leimuiden is 30+ Nights, adopted by 57.9% of listings. This highlights the market's preference for longer commitments.
- A significant segment (57.9%) caters to monthly stays (30+ nights) in Leimuiden, pointing to opportunities in the extended-stay market.
Recommendations
- Align with the market by considering a 30+ Nights minimum stay, as 57.9% of Leimuiden hosts use this setting.
- If feasible, allowing 1-night stays, especially midweek or during low season, could capture last-minute bookings, as only 26.3% currently do.
- Explore offering discounts for stays of 30+ nights to attract the 57.9% of the market seeking extended stays.
- Adjust minimum nights based on seasonality – potentially shorter during low season and longer during peak demand periods in Leimuiden.
Leimuiden Airbnb Cancellation Policy Trends Analysis (2025)
Super Strict 60 Days
9 listings
56.3% of total
Flexible
5 listings
31.3% of total
Moderate
1 listings
6.3% of total
Strict
1 listings
6.3% of total
Cancellation Policy Insights for Leimuiden
- The prevailing Airbnb cancellation policy trend in Leimuiden is Super Strict 60 Days, used by 56.3% of listings.
- There's a relatively balanced mix between guest-friendly (37.6%) and stricter (6.3%) policies, offering choices for different guest needs.
- Strict cancellation policies are quite rare (6.3%), potentially making listings with this policy less competitive unless justified by high demand or property type.
Recommendations for Hosts
- Consider adopting a Super Strict 60 Days policy to align with the 56.3% market standard in Leimuiden.
- Using a Strict policy might deter some guests, as only 6.3% of listings use it. Evaluate if potential revenue protection outweighs possible lower booking rates.
- Regularly review your cancellation policy against competitors and market demand shifts in Leimuiden.
Leimuiden STR Booking Lead Time Analysis (2025)
Average Booking Lead Time by Month
Booking Lead Time Insights for Leimuiden
- The overall average booking lead time for vacation rentals in Leimuiden is 85 days.
- Guests book furthest in advance for stays during August (average 121 days), likely coinciding with peak travel demand or local events.
- The shortest booking windows occur for stays in November (average 13 days), indicating more last-minute travel plans during this time.
- Seasonally, Summer (115 days avg.) sees the longest lead times, while Winter (31 days avg.) has the shortest, reflecting typical travel planning cycles.
Recommendations for Hosts
- Use the overall average lead time (85 days) as a baseline for your pricing and availability strategy in Leimuiden.
- For August stays, consider implementing length-of-stay discounts or slightly higher rates for bookings made less than 121 days out to capitalize on advance planning.
- During November, focus on last-minute booking availability and promotions, as guests book with very short notice (13 days avg.).
- Target marketing efforts for the Summer season well in advance (at least 115 days) to capture early planners.
- Monitor your own booking lead times against these Leimuiden averages to identify opportunities for dynamic pricing adjustments.
Popular & Essential Airbnb Amenities in Leimuiden (2025)
Amenity Prevalence
Amenity Insights for Leimuiden
- Essential amenities in Leimuiden that guests expect include: Wifi, Heating, Smoke alarm, Hangers, Refrigerator, Dishes and silverware, Private entrance. Lacking these (any) could significantly impact bookings.
- Popular amenities like Coffee maker, TV, Free street parking are common but not universal. Offering these can provide a competitive edge.
Recommendations for Hosts
- Ensure your listing includes all essential amenities for Leimuiden: Wifi, Heating, Smoke alarm, Hangers, Refrigerator, Dishes and silverware, Private entrance.
- Prioritize adding missing essentials: Hangers, Refrigerator, Dishes and silverware, Private entrance.
- Consider adding popular differentiators like Coffee maker or TV to increase appeal.
- Highlight unique or less common amenities you offer (e.g., hot tub, dedicated workspace, EV charger) in your listing description and photos.
- Regularly check competitor amenities in Leimuiden to stay competitive.
Leimuiden Airbnb Guest Demographics & Profile Analysis (2025)
Guest Profile Summary for Leimuiden
- The typical guest profile for Airbnb in Leimuiden consists of predominantly international visitors (91%), with top international origins including France, typically belonging to the Post-2000s (Gen Z/Alpha) group (50%), primarily speaking English or German.
- Domestic travelers account for 8.9% of guests.
- Key international markets include Germany (28.6%) and France (17.9%).
- Top languages spoken are English (42.6%) followed by German (19.1%).
- A significant demographic segment is the Post-2000s (Gen Z/Alpha) group, representing 50% of guests.
Recommendations for Hosts
- Focus marketing internationally, particularly towards travelers from France.
- Tailor amenities and listing descriptions to appeal to the dominant Post-2000s (Gen Z/Alpha) demographic (e.g., highlight fast WiFi, smart home features, local guides).
- Highlight unique local experiences or amenities relevant to the primary guest profile.
- Consider seasonal promotions aligned with peak travel times for key origin markets.
Nearby Short-Term Rental Market Comparison
How does the Leimuiden Airbnb market stack up against its neighbors? Compare key performance metrics like average monthly revenue, ADR, and occupancy rates in surrounding areas to understand the broader regional STR landscape.
| Market | Active Properties | Monthly Revenue | Daily Rate | Avg. Occupancy |
|---|---|---|---|---|
| Kockengen | 12 | $7,560 | $396.31 | 61% |
| Bentveld | 13 | $4,798 | $443.61 | 54% |
| Halfweg | 17 | $4,307 | $231.13 | 55% |
| Aerdenhout | 17 | $4,288 | $694.02 | 53% |
| Merksplas | 10 | $3,885 | $256.59 | 44% |
| Oud Ade | 17 | $3,779 | $277.47 | 51% |
| Rijs | 27 | $3,772 | $356.97 | 45% |
| Zwanenburg | 24 | $3,720 | $240.77 | 66% |
| Kerkdriel | 25 | $3,607 | $323.16 | 40% |
| Brecht | 10 | $3,531 | $251.70 | 54% |