Bodegraven Airbnb Market Analysis 2025: Short Term Rental Data & Vacation Rental Statistics in South Holland, Netherlands
Is Airbnb profitable in Bodegraven in 2025? Explore comprehensive Airbnb analytics for Bodegraven, South Holland, Netherlands to uncover income potential. This 2025 STR market report for Bodegraven, based on AirROI data from April 2024 to March 2025, reveals key trends in the niche market of 21 active listings.
Whether you're considering an Airbnb investment in Bodegraven, optimizing your existing vacation rental, or exploring rental arbitrage opportunities, understanding the Bodegraven Airbnb data is crucial. Leveraging the low regulation environment is key to maximizing your short term rental income potential. Let's dive into the specifics.
Key Bodegraven Airbnb Performance Metrics Overview
Monthly Airbnb Revenue Variations & Income Potential in Bodegraven (2025)
Understanding the monthly revenue variations for Airbnb listings in Bodegraven is key to maximizing your short term rental income potential. Seasonality significantly impacts earnings. Our analysis, based on data from the past 12 months, shows that the peak revenue month for STRs in Bodegraven is typically July, while January often presents the lowest earnings, highlighting opportunities for strategic pricing adjustments during shoulder and low seasons. Explore the typical Airbnb income in Bodegraven across different performance tiers:
- Best-in-class properties (Top 10%) achieve $4,891+ monthly, often utilizing dynamic pricing and superior guest experiences.
- Strong performing properties (Top 25%) earn $3,630 or more, indicating effective management and desirable locations/amenities.
- Typical properties (Median) generate around $2,418 per month, representing the average market performance.
- Entry-level properties (Bottom 25%) see earnings around $1,665, often with potential for optimization.
Average Monthly Airbnb Earnings Trend in Bodegraven
Bodegraven Airbnb Occupancy Rate Trends (2025)
Maximize your bookings by understanding the Bodegraven STR occupancy trends. Seasonal demand shifts significantly influence how often properties are booked. Typically, Octobersees the highest demand (peak season occupancy), while January experiences the lowest (low season). Effective strategies, like adjusting minimum stays or offering promotions, can boost occupancy during slower periods. Here's how different property tiers perform in Bodegraven:
- Best-in-class properties (Top 10%) achieve 83%+ occupancy, indicating high desirability and potentially optimized availability.
- Strong performing properties (Top 25%) maintain 69% or higher occupancy, suggesting good market fit and guest satisfaction.
- Typical properties (Median) have an occupancy rate around 51%.
- Entry-level properties (Bottom 25%) average 34% occupancy, potentially facing higher vacancy.
Average Monthly Occupancy Rate Trend in Bodegraven
Average Daily Rate (ADR) Airbnb Trends in Bodegraven (2025)
Effective short term rental pricing strategy in Bodegraven involves understanding monthly ADR fluctuations. The Average Daily Rate (ADR) for Airbnb in Bodegraven typically peaks in October and dips lowest during February. Leveraging Airbnb dynamic pricing tools or strategies based on this seasonality can significantly boost revenue. Here's a look at the typical nightly rates achieved:
- Best-in-class properties (Top 10%) command rates of $246+ per night, often due to premium features or locations.
- Strong performing properties (Top 25%) achieve nightly rates of $195 or more.
- Typical properties (Median) charge around $151 per night.
- Entry-level properties (Bottom 25%) earn around $124 per night.
Average Daily Rate (ADR) Trend by Month in Bodegraven
Get Live Bodegraven Market Intelligence 👇
Explore Real-time Analytics
Airbnb Seasonality Analysis & Trends in Bodegraven (2025)
Peak Season (July, August, May)
- Revenue averages $3,877 per month
- Occupancy rates average 66.3%
- Daily rates average $172
Shoulder Season
- Revenue averages $2,816 per month
- Occupancy maintains around 52.4%
- Daily rates hold near $172
Low Season (January, March, November)
- Revenue drops to average $1,781 per month
- Occupancy decreases to average 36.6%
- Daily rates adjust to average $170
Seasonality Insights for Bodegraven
- The Airbnb seasonality in Bodegraven shows highly seasonal trends requiring careful strategy. While the sections above show seasonal averages, it's also insightful to look at the extremes:
- During the high season, the absolute peak month showcases Bodegraven's highest earning potential, with monthly revenues capable of climbing to $4,181, occupancy reaching a high of 72.1%, and ADRs peaking at $174.
- Conversely, the slowest single month of the year, typically falling within the low season, marks the market's lowest point. In this month, revenue might dip to $1,487, occupancy could drop to 31.2%, and ADRs may adjust down to $168.
- Understanding both the seasonal averages and these monthly peaks and troughs in revenue, occupancy, and ADR is crucial for maximizing your Airbnb profit potential in Bodegraven.
Seasonal Strategies for Maximizing Profit
- Peak Season: Maximize revenue through premium pricing and potentially longer minimum stays. Ensure high availability.
- Low Season: Offer competitive pricing, special promotions (e.g., extended stay discounts), and flexible cancellation policies. Target off-season travelers like remote workers or budget-conscious guests.
- Shoulder Seasons: Implement dynamic pricing that balances peak and low rates. Target weekend travelers or specific events. Offer slightly more flexible terms than peak season.
- Regularly analyze your own performance against these Bodegraven seasonality benchmarks and adjust your pricing and availability strategy accordingly.
Best Areas for Airbnb Investment in Bodegraven (2025)
Exploring the top neighborhoods for short-term rentals in Bodegraven? This section highlights key areas, outlining why they are attractive for hosts and guests, along with notable local attractions. Consider these locations based on your target guest profile and investment strategy.
| Neighborhood / Area | Why Host Here? (Target Guests & Appeal) | Key Attractions & Landmarks |
|---|---|---|
| Bodegraven Center | The heart of Bodegraven, known for its charming streets, local shops, and cafes. Perfect for tourists who want to experience the local culture and community. | Bodegraven Museum, Local Markets, Historic Windmill, St. Vincentius Church, Bodegraven Nature Park |
| Reeuwijkse Plassen | Scenic lakes and nature reserves close to Bodegraven. Ideal for nature lovers and outdoor enthusiasts looking for a peaceful retreat. | Reeuwijkse Plassen, Water sports activities, Nature walks, Fishing spots, Picnic areas |
| Alphen aan den Rijn | Close proximity to Bodegraven with a vibrant shopping and entertainment scene. Attracts visitors looking for a mix of urban life and nature. | Historisch Park, Archeon, Plantage College Park, Zanderij Park, Shopping Center de Ridderhof |
| Woerden | A nearby town with a rich history and beautiful canals. Offers a quaint atmosphere combined with modern amenities, appealing to tourists and business travelers alike. | Woerden Castle, Canal tours, Market Square, Oudewater, Theater Aan de Slinger |
| Leiden | A historic city with a rich academic background, beautiful canals, and museums. Popular among international visitors and students. | Rijksmuseum van Oudheden, Botanical Garden, Canals of Leiden, Museum of the History of Science, Pieterskerk |
| The Hague | A major city with international institutions, beautiful beaches, and extensive cultural offerings. A prime location for tourists and business travelers. | Mauritshuis, Scheveningen Beach, Peace Palace, Madurodam, Noordeinde Palace |
| Amsterdam | The capital of the Netherlands, famous for its canals, cultural heritage, and vibrant nightlife. Attracts millions of visitors each year, making it a hotspot for Airbnb. | Rijksmuseum, Van Gogh Museum, Anne Frank House, Dam Square, Canal Cruise |
| Utrecht | Known for its medieval old town, unique canals, and vibrant atmosphere. A great destination for those looking for culture and history close to Bodegraven. | Utrechts Archief, Dom Tower, Museum Speelklok, Canals of Utrecht, Griftpark |
Understanding Airbnb License Requirements & STR Laws in Bodegraven (2025)
While Bodegraven, South Holland, Netherlands currently shows low STR regulations, specific Airbnb license requirements might still exist or change. Always verify the latest short term rental regulations and Airbnb license requirements directly with local government authorities for Bodegraven to ensure full compliance before hosting.
(Source: AirROI data, 2025, based on 5% licensed listings)
Top Performing Airbnb Properties in Bodegraven (2025)
Benchmark your potential! Explore examples of top-performing Airbnb properties in Bodegravenbased on Trailing Twelve Month (TTM) revenue. Analyze their characteristics, revenue, occupancy rate, and ADR to understand what drives success in this market.

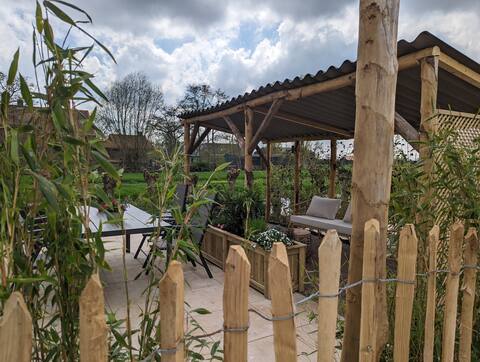
Luxury farmhouse in the nature.
Entire Place • 3 bedrooms
Cloakhouse Hartenlust
Entire Place • 3 bedrooms
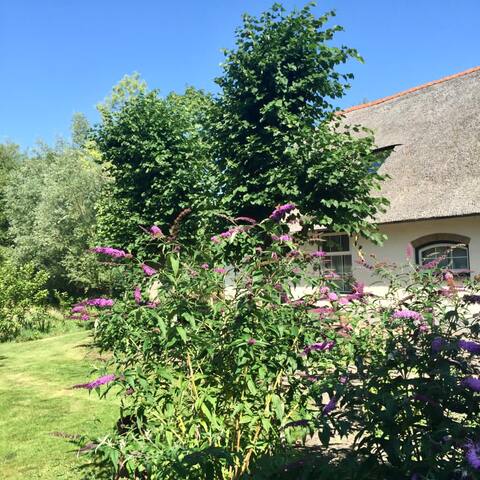
Luxury accommodation in the Groene Hart
Entire Place • 2 bedrooms
Well located house near brewery de Molen and Gouda
Entire Place • 3 bedrooms

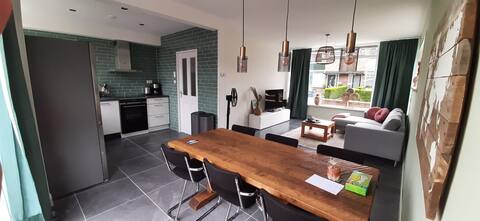
Fine spacious apartment in centrally situated town
Entire Place • 2 bedrooms

Waterfall Wellness Suite with Sauna! Close to Amsterdam
Entire Place • 1 bedroom
Note: Performance varies based on location, size, amenities, seasonality, and management quality. Data reflects the past 12 months.
Top Performing Airbnb Hosts in Bodegraven (2025)
Learn from the best! This table showcases top-performing Airbnb hosts in Bodegraven based on the number of properties managed and estimated total revenue over the past year. Analyze their scale and performance metrics.
| Host Name | Properties | Grossing Revenue | Stay Reviews | Avg Rating |
|---|---|---|---|---|
| Judith | 4 | $114,438 | 114 | 5.00/5.0 |
| Dirk | 1 | $61,062 | 16 | 4.94/5.0 |
| Marja | 2 | $50,681 | 36 | 4.95/5.0 |
| De Hollandse Boerderij | 2 | $43,982 | 85 | 4.54/5.0 |
| Rianka | 1 | $43,838 | 86 | 4.92/5.0 |
| Niels | 1 | $43,214 | 72 | 4.97/5.0 |
| Nick | 1 | $41,889 | 72 | 4.92/5.0 |
| Mariel | 1 | $37,380 | 28 | 4.82/5.0 |
| Tim | 1 | $29,063 | 104 | 4.94/5.0 |
| Diana | 1 | $22,566 | 83 | 4.94/5.0 |
Analyzing the strategies of top hosts, such as their property selection, pricing, and guest communication, can offer valuable lessons for optimizing your own Airbnb operations in Bodegraven.
Dive Deeper: Advanced Bodegraven STR Market Data (2025)
Ready to unlock more insights? AirROI provides access to advanced metrics and comprehensive Airbnb data for Bodegraven. Explore detailed analytics beyond this report to refine your investment strategy, optimize pricing, and maximize your vacation rental profits.
Explore Advanced MetricsBodegraven Short-Term Rental Market Composition (2025): Property & Room Types
Room Type Distribution
Property Type Distribution
Market Composition Insights for Bodegraven
- The Bodegraven Airbnb market composition is heavily skewed towards Entire Home/Apt listings, which make up 81% of the 21 active rentals. This indicates strong guest preference for privacy and space.
- Looking at the property type distribution in Bodegraven, House properties are the most common (52.4%), reflecting the local real estate landscape.
- Houses represent a significant 52.4% portion, catering likely to families or larger groups.
- The presence of 14.3% Hotel/Boutique listings indicates integration with traditional hospitality.
- Smaller segments like unique stays, others (combined 9.6%) offer potential for unique stay experiences.
Bodegraven Airbnb Room Capacity Analysis (2025): Bedroom Distribution
Distribution of Listings by Number of Bedrooms
Room Capacity Insights for Bodegraven
- The dominant room capacity in Bodegraven is 3 bedrooms listings, making up 23.8% of the market. This suggests a strong demand for properties suitable for families or small groups.
- Together, 3 bedrooms and 1 bedroom properties represent 47.6% of the active Airbnb listings in Bodegraven, indicating a high concentration in these sizes.
- A significant 33.4% of listings offer 3+ bedrooms, catering to larger groups and families seeking more space in Bodegraven.
Bodegraven Vacation Rental Guest Capacity Trends (2025)
Distribution of Listings by Guest Capacity
Guest Capacity Insights for Bodegraven
- The most common guest capacity trend in Bodegraven vacation rentals is listings accommodating 4 guests (33.3%). This suggests the primary traveler segment is likely small families or groups.
- Properties designed for 4 guests and 2 guests dominate the Bodegraven STR market, accounting for 52.3% of listings.
- Listings for large groups (6+ guests) are relatively rare (4.8%), potentially indicating an opportunity for hosts targeting this segment in Bodegraven.
- On average, properties in Bodegraven are equipped to host 3.2 guests.
Bodegraven Airbnb Booking Patterns (2025): Available vs. Booked Days
Available Days Distribution
Booked Days Distribution
Booking Pattern Insights for Bodegraven
- The most common availability pattern in Bodegraven falls within the 181-270 days range, representing 42.9% of listings. This suggests many properties have significant open periods on their calendars.
- Approximately 71.5% of listings show high availability (181+ days open annually), indicating potential for increased bookings or specific owner usage patterns.
- For booked days, the 91-180 days range is most frequent in Bodegraven (42.9%), reflecting common guest stay durations or potential owner blocking patterns.
- A notable 33.3% of properties secure long booking periods (181+ days booked per year), highlighting successful long-term rental strategies or significant owner usage.
Bodegraven Airbnb Minimum Stay Requirements Analysis
Distribution of Listings by Minimum Night Requirement
1 Night
7 listings
35% of total
2 Nights
3 listings
15% of total
3 Nights
2 listings
10% of total
4-6 Nights
5 listings
25% of total
30+ Nights
3 listings
15% of total
Key Insights
- The most prevalent minimum stay requirement in Bodegraven is 1 Night, adopted by 35% of listings. This highlights the market's preference for shorter, flexible bookings.
- A significant segment (15%) caters to monthly stays (30+ nights) in Bodegraven, pointing to opportunities in the extended-stay market.
Recommendations
- Align with the market by considering a 1 Night minimum stay, as 35% of Bodegraven hosts use this setting.
- Explore offering discounts for stays of 30+ nights to attract the 15% of the market seeking extended stays.
- Adjust minimum nights based on seasonality – potentially shorter during low season and longer during peak demand periods in Bodegraven.
Bodegraven Airbnb Cancellation Policy Trends Analysis (2025)
Flexible
5 listings
25% of total
Moderate
9 listings
45% of total
Firm
4 listings
20% of total
Strict
2 listings
10% of total
Cancellation Policy Insights for Bodegraven
- The prevailing Airbnb cancellation policy trend in Bodegraven is Moderate, used by 45% of listings.
- There's a relatively balanced mix between guest-friendly (70.0%) and stricter (30.0%) policies, offering choices for different guest needs.
Recommendations for Hosts
- Consider adopting a Moderate policy to align with the 45% market standard in Bodegraven.
- Using a Strict policy might deter some guests, as only 10% of listings use it. Evaluate if potential revenue protection outweighs possible lower booking rates.
- Regularly review your cancellation policy against competitors and market demand shifts in Bodegraven.
Bodegraven STR Booking Lead Time Analysis (2025)
Average Booking Lead Time by Month
Booking Lead Time Insights for Bodegraven
- The overall average booking lead time for vacation rentals in Bodegraven is 51 days.
- Guests book furthest in advance for stays during June (average 98 days), likely coinciding with peak travel demand or local events.
- The shortest booking windows occur for stays in November (average 22 days), indicating more last-minute travel plans during this time.
- Seasonally, Summer (73 days avg.) sees the longest lead times, while Winter (46 days avg.) has the shortest, reflecting typical travel planning cycles.
Recommendations for Hosts
- Use the overall average lead time (51 days) as a baseline for your pricing and availability strategy in Bodegraven.
- For June stays, consider implementing length-of-stay discounts or slightly higher rates for bookings made less than 98 days out to capitalize on advance planning.
- Target marketing efforts for the Summer season well in advance (at least 73 days) to capture early planners.
- Monitor your own booking lead times against these Bodegraven averages to identify opportunities for dynamic pricing adjustments.
Popular & Essential Airbnb Amenities in Bodegraven (2025)
Amenity Prevalence
Amenity Insights for Bodegraven
- Essential amenities in Bodegraven that guests expect include: Wifi, Smoke alarm, Free parking on premises, Heating, Coffee maker. Lacking these (any) could significantly impact bookings.
- Popular amenities like Refrigerator, TV, Kitchen are common but not universal. Offering these can provide a competitive edge.
Recommendations for Hosts
- Ensure your listing includes all essential amenities for Bodegraven: Wifi, Smoke alarm, Free parking on premises, Heating, Coffee maker.
- Prioritize adding missing essentials: Smoke alarm, Free parking on premises, Heating, Coffee maker.
- Consider adding popular differentiators like Refrigerator or TV to increase appeal.
- Highlight unique or less common amenities you offer (e.g., hot tub, dedicated workspace, EV charger) in your listing description and photos.
- Regularly check competitor amenities in Bodegraven to stay competitive.
Bodegraven Airbnb Guest Demographics & Profile Analysis (2025)
Guest Profile Summary for Bodegraven
- The typical guest profile for Airbnb in Bodegraven consists of predominantly international visitors (82%), with top international origins including France, typically belonging to the Post-2000s (Gen Z/Alpha) group (50%), primarily speaking English or German.
- Domestic travelers account for 17.8% of guests.
- Key international markets include Germany (20.8%) and France (20.3%).
- Top languages spoken are English (43%) followed by German (16.3%).
- A significant demographic segment is the Post-2000s (Gen Z/Alpha) group, representing 50% of guests.
Recommendations for Hosts
- Focus marketing internationally, particularly towards travelers from France.
- Tailor amenities and listing descriptions to appeal to the dominant Post-2000s (Gen Z/Alpha) demographic (e.g., highlight fast WiFi, smart home features, local guides).
- Highlight unique local experiences or amenities relevant to the primary guest profile.
- Consider seasonal promotions aligned with peak travel times for key origin markets.
Nearby Short-Term Rental Market Comparison
How does the Bodegraven Airbnb market stack up against its neighbors? Compare key performance metrics like average monthly revenue, ADR, and occupancy rates in surrounding areas to understand the broader regional STR landscape.
| Market | Active Properties | Monthly Revenue | Daily Rate | Avg. Occupancy |
|---|---|---|---|---|
| Kockengen | 12 | $7,560 | $396.31 | 61% |
| Bentveld | 13 | $4,798 | $443.61 | 54% |
| Halfweg | 17 | $4,307 | $231.13 | 55% |
| Aerdenhout | 17 | $4,288 | $694.02 | 53% |
| Merksplas | 10 | $3,885 | $256.59 | 44% |
| Oud Ade | 17 | $3,779 | $277.47 | 51% |
| Rijs | 27 | $3,772 | $356.97 | 45% |
| Zwanenburg | 24 | $3,720 | $240.77 | 66% |
| Kerkdriel | 25 | $3,607 | $323.16 | 40% |
| Brecht | 10 | $3,531 | $251.70 | 54% |