Lowlands Airbnb Market Analysis 2025: Short Term Rental Data & Vacation Rental Statistics in Sint Maarten, Netherlands
Is Airbnb profitable in Lowlands in 2025? Explore comprehensive Airbnb analytics for Lowlands, Sint Maarten, Netherlands to uncover income potential. This 2025 STR market report for Lowlands, based on AirROI data from April 2024 to March 2025, reveals key trends in the market of 372 active listings.
Whether you're considering an Airbnb investment in Lowlands, optimizing your existing vacation rental, or exploring rental arbitrage opportunities, understanding the Lowlands Airbnb data is crucial. Leveraging the low regulation environment is key to maximizing your short term rental income potential. Let's dive into the specifics.
Key Lowlands Airbnb Performance Metrics Overview
Monthly Airbnb Revenue Variations & Income Potential in Lowlands (2025)
Understanding the monthly revenue variations for Airbnb listings in Lowlands is key to maximizing your short term rental income potential. Seasonality significantly impacts earnings. Our analysis, based on data from the past 12 months, shows that the peak revenue month for STRs in Lowlands is typically January, while September often presents the lowest earnings, highlighting opportunities for strategic pricing adjustments during shoulder and low seasons. Explore the typical Airbnb income in Lowlands across different performance tiers:
- Best-in-class properties (Top 10%) achieve $8,796+ monthly, often utilizing dynamic pricing and superior guest experiences.
- Strong performing properties (Top 25%) earn $5,792 or more, indicating effective management and desirable locations/amenities.
- Typical properties (Median) generate around $3,240 per month, representing the average market performance.
- Entry-level properties (Bottom 25%) see earnings around $1,726, often with potential for optimization.
Average Monthly Airbnb Earnings Trend in Lowlands
Lowlands Airbnb Occupancy Rate Trends (2025)
Maximize your bookings by understanding the Lowlands STR occupancy trends. Seasonal demand shifts significantly influence how often properties are booked. Typically, Februarysees the highest demand (peak season occupancy), while September experiences the lowest (low season). Effective strategies, like adjusting minimum stays or offering promotions, can boost occupancy during slower periods. Here's how different property tiers perform in Lowlands:
- Best-in-class properties (Top 10%) achieve 82%+ occupancy, indicating high desirability and potentially optimized availability.
- Strong performing properties (Top 25%) maintain 67% or higher occupancy, suggesting good market fit and guest satisfaction.
- Typical properties (Median) have an occupancy rate around 46%.
- Entry-level properties (Bottom 25%) average 24% occupancy, potentially facing higher vacancy.
Average Monthly Occupancy Rate Trend in Lowlands
Average Daily Rate (ADR) Airbnb Trends in Lowlands (2025)
Effective short term rental pricing strategy in Lowlands involves understanding monthly ADR fluctuations. The Average Daily Rate (ADR) for Airbnb in Lowlands typically peaks in January and dips lowest during November. Leveraging Airbnb dynamic pricing tools or strategies based on this seasonality can significantly boost revenue. Here's a look at the typical nightly rates achieved:
- Best-in-class properties (Top 10%) command rates of $741+ per night, often due to premium features or locations.
- Strong performing properties (Top 25%) achieve nightly rates of $420 or more.
- Typical properties (Median) charge around $251 per night.
- Entry-level properties (Bottom 25%) earn around $153 per night.
Average Daily Rate (ADR) Trend by Month in Lowlands
Get Live Lowlands Market Intelligence 👇

Explore Real-time Analytics
Airbnb Seasonality Analysis & Trends in Lowlands (2025)
Peak Season (January, February, December)
- Revenue averages $6,077 per month
- Occupancy rates average 61.5%
- Daily rates average $391
Shoulder Season
- Revenue averages $4,364 per month
- Occupancy maintains around 44.5%
- Daily rates hold near $356
Low Season (August, September, October)
- Revenue drops to average $2,529 per month
- Occupancy decreases to average 35.7%
- Daily rates adjust to average $351
Seasonality Insights for Lowlands
- The Airbnb seasonality in Lowlands shows highly seasonal trends requiring careful strategy. While the sections above show seasonal averages, it's also insightful to look at the extremes:
- During the high season, the absolute peak month showcases Lowlands's highest earning potential, with monthly revenues capable of climbing to $6,528, occupancy reaching a high of 68.5%, and ADRs peaking at $394.
- Conversely, the slowest single month of the year, typically falling within the low season, marks the market's lowest point. In this month, revenue might dip to $2,065, occupancy could drop to 30.4%, and ADRs may adjust down to $311.
- Understanding both the seasonal averages and these monthly peaks and troughs in revenue, occupancy, and ADR is crucial for maximizing your Airbnb profit potential in Lowlands.
Seasonal Strategies for Maximizing Profit
- Peak Season: Maximize revenue through premium pricing and potentially longer minimum stays. Ensure high availability.
- Low Season: Offer competitive pricing, special promotions (e.g., extended stay discounts), and flexible cancellation policies. Target off-season travelers like remote workers or budget-conscious guests.
- Shoulder Seasons: Implement dynamic pricing that balances peak and low rates. Target weekend travelers or specific events. Offer slightly more flexible terms than peak season.
- Regularly analyze your own performance against these Lowlands seasonality benchmarks and adjust your pricing and availability strategy accordingly.
Best Areas for Airbnb Investment in Lowlands (2025)
Exploring the top neighborhoods for short-term rentals in Lowlands? This section highlights key areas, outlining why they are attractive for hosts and guests, along with notable local attractions. Consider these locations based on your target guest profile and investment strategy.
| Neighborhood / Area | Why Host Here? (Target Guests & Appeal) | Key Attractions & Landmarks |
|---|---|---|
| Philipsburg | The capital of Sint Maarten, known for its historic architecture, shopping, and vibrant beachfront. A popular destination for cruise ship passengers and tourists seeking local culture and nightlife. | Great Bay Beach, Front Street Shopping, Museum of Sint Maarten, Fort Amsterdam, Waterfront Promenade |
| Simpson Bay | A lively area with a mix of beautiful beaches, boating activities, and diverse dining options. Ideal for tourists wanting an active vacation experience close to the water. | Simpson Bay Beach, Marigot Bay, Loterie Farm, Pelican Key, Casinos |
| Maho Beach | Famous for its spectacular views of incoming airplanes, Maho Beach is a unique spot that attracts many tourists, especially aviation enthusiasts and beach lovers. | Maho Beach, Sunset Beach Bar, Airplane Spotting, Maho Village, Nightlife |
| Cupecoy | Known for its stunning cliffs and beautiful beaches, Cupecoy is a quieter area with luxury resorts and proximity to the Dutch side's nightlife and beaches. | Cupecoy Beach, Blue Mall, Mullet Bay Beach, Golf courses, Fine dining |
| Dawn Beach | A serene beach area known for its tranquility and natural beauty, perfect for those looking for a relaxing getaway with opportunities for snorkeling and diving. | Dawn Beach, Oyster Bay Beach Resort, Captain's Bay, Snorkeling spots, Local beach bars |
| French Quarter | A culturally rich area that showcases the French side of the island, featuring beautiful architecture, local markets, and a laid-back atmosphere. | Local markets, Culinary experiences, Historical architecture, Beaches, Cultural festivals |
| Pelican Key | An upscale residential area with beautiful beaches and stunning views, popular among tourists seeking a more luxurious and peaceful vacation. | Pelican Beach, Restaurants, Spa facilities, Water sports, Sunset views |
| Mullet Bay | A famous beach known for its soft sand and clear waters, Mullet Bay is a hotspot for both relaxation and water sports, attracting visitors from all over the island. | Mullet Bay Beach, Water sports rentals, Beach bars, Nearby golf course, Family-friendly environment |
Understanding Airbnb License Requirements & STR Laws in Lowlands (2025)
While Lowlands, Sint Maarten, Netherlands currently shows low STR regulations, specific Airbnb license requirements might still exist or change. Always verify the latest short term rental regulations and Airbnb license requirements directly with local government authorities for Lowlands to ensure full compliance before hosting.
(Source: AirROI data, 2025, based on 1% licensed listings)
Top Performing Airbnb Properties in Lowlands (2025)
Benchmark your potential! Explore examples of top-performing Airbnb properties in Lowlandsbased on Trailing Twelve Month (TTM) revenue. Analyze their characteristics, revenue, occupancy rate, and ADR to understand what drives success in this market.
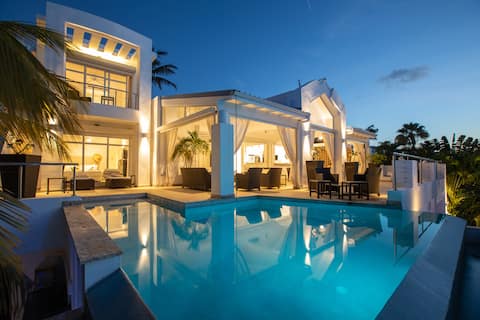
Abracadabra Villa - View - Sea - Pool
Entire Place • 5 bedrooms
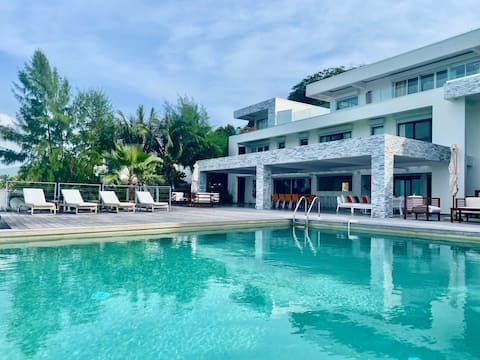
Luxury Villa on the lagoon
Entire Place • 5 bedrooms
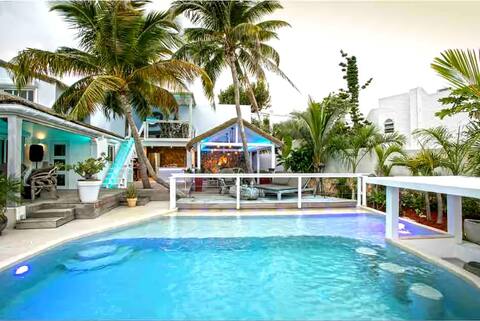
Villa Blue Lagoon SXM
Entire Place • 6 bedrooms

Magnificent 5 bedroom villa, with private pool
Entire Place • 5 bedrooms
Serenity Penthouse - The Pinnacle of Luxury
Entire Place • 4 bedrooms
Penthouse! 3-Bdr. Apartment with Stunning Views!
Entire Place • 3 bedrooms
Note: Performance varies based on location, size, amenities, seasonality, and management quality. Data reflects the past 12 months.
Top Performing Airbnb Hosts in Lowlands (2025)
Learn from the best! This table showcases top-performing Airbnb hosts in Lowlands based on the number of properties managed and estimated total revenue over the past year. Analyze their scale and performance metrics.
| Host Name | Properties | Grossing Revenue | Stay Reviews | Avg Rating |
|---|---|---|---|---|
| Ophelie H. | 90 | $3,716,268 | 708 | 3.50/5.0 |
| Smaart Vacation NV | 16 | $762,820 | 263 | 4.52/5.0 |
| Noah | 18 | $514,887 | 1194 | 4.10/5.0 |
| Alexandra | 4 | $361,951 | 87 | 4.79/5.0 |
| Joy | 6 | $294,366 | 12 | 1.67/5.0 |
| Tamara | 2 | $273,906 | 41 | 4.93/5.0 |
| Lux Villa Vacation | 2 | $232,555 | 42 | 4.83/5.0 |
| St Martin Sotheby'S Realty | 4 | $230,977 | 15 | 2.46/5.0 |
| Jayne | 6 | $206,559 | 446 | 4.74/5.0 |
| Jamila | 5 | $175,023 | 73 | 4.94/5.0 |
Analyzing the strategies of top hosts, such as their property selection, pricing, and guest communication, can offer valuable lessons for optimizing your own Airbnb operations in Lowlands.
Dive Deeper: Advanced Lowlands STR Market Data (2025)
Ready to unlock more insights? AirROI provides access to advanced metrics and comprehensive Airbnb data for Lowlands. Explore detailed analytics beyond this report to refine your investment strategy, optimize pricing, and maximize your vacation rental profits.
Explore Advanced MetricsLowlands Short-Term Rental Market Composition (2025): Property & Room Types
Room Type Distribution
Property Type Distribution
Market Composition Insights for Lowlands
- The Lowlands Airbnb market composition is heavily skewed towards Entire Home/Apt listings, which make up 98.7% of the 372 active rentals. This indicates strong guest preference for privacy and space.
- Looking at the property type distribution in Lowlands, Apartment/Condo properties are the most common (86.8%), reflecting the local real estate landscape.
- Smaller segments like others, hotel/boutique (combined 1.6%) offer potential for unique stay experiences.
Lowlands Airbnb Room Capacity Analysis (2025): Bedroom Distribution
Distribution of Listings by Number of Bedrooms
Room Capacity Insights for Lowlands
- The dominant room capacity in Lowlands is 1 bedroom listings, making up 40.3% of the market. This suggests a strong demand for properties suitable for couples or solo travelers.
- Together, 1 bedroom and 2 bedrooms properties represent 71.5% of the active Airbnb listings in Lowlands, indicating a high concentration in these sizes.
Lowlands Vacation Rental Guest Capacity Trends (2025)
Distribution of Listings by Guest Capacity
Guest Capacity Insights for Lowlands
- The most common guest capacity trend in Lowlands vacation rentals is listings accommodating 2 guests (36.6%). This suggests the primary traveler segment is likely couples or solo travelers.
- Properties designed for 2 guests and 4 guests dominate the Lowlands STR market, accounting for 68.1% of listings.
- 23.7% of properties accommodate 6+ guests, serving the market segment for larger families or group travel in Lowlands.
- On average, properties in Lowlands are equipped to host 3.8 guests.
Lowlands Airbnb Booking Patterns (2025): Available vs. Booked Days
Available Days Distribution
Booked Days Distribution
Booking Pattern Insights for Lowlands
- The most common availability pattern in Lowlands falls within the 271-366 days range, representing 40.9% of listings. This suggests many properties have significant open periods on their calendars.
- Approximately 72.1% of listings show high availability (181+ days open annually), indicating potential for increased bookings or specific owner usage patterns.
- For booked days, the 91-180 days range is most frequent in Lowlands (30.9%), reflecting common guest stay durations or potential owner blocking patterns.
- A notable 29.0% of properties secure long booking periods (181+ days booked per year), highlighting successful long-term rental strategies or significant owner usage.
Lowlands Airbnb Minimum Stay Requirements Analysis
Distribution of Listings by Minimum Night Requirement
1 Night
20 listings
5.6% of total
2 Nights
43 listings
12.1% of total
3 Nights
69 listings
19.4% of total
4-6 Nights
83 listings
23.3% of total
7-29 Nights
13 listings
3.7% of total
30+ Nights
128 listings
36% of total
Key Insights
- The most prevalent minimum stay requirement in Lowlands is 30+ Nights, adopted by 36% of listings. This highlights the market's preference for longer commitments.
- Very short stays (1-2 nights) are less common (17.7%), suggesting hosts prefer slightly longer bookings to optimize turnover.
- A significant segment (36%) caters to monthly stays (30+ nights) in Lowlands, pointing to opportunities in the extended-stay market.
Recommendations
- Align with the market by considering a 30+ Nights minimum stay, as 36% of Lowlands hosts use this setting.
- If feasible, allowing 1-night stays, especially midweek or during low season, could capture last-minute bookings, as only 5.6% currently do.
- Explore offering discounts for stays of 30+ nights to attract the 36% of the market seeking extended stays.
- Adjust minimum nights based on seasonality – potentially shorter during low season and longer during peak demand periods in Lowlands.
Lowlands Airbnb Cancellation Policy Trends Analysis (2025)
Super Strict 60 Days
3 listings
1% of total
Super Strict 30 Days
5 listings
1.7% of total
Flexible
37 listings
12.7% of total
Moderate
72 listings
24.7% of total
Firm
59 listings
20.2% of total
Strict
116 listings
39.7% of total
Cancellation Policy Insights for Lowlands
- The prevailing Airbnb cancellation policy trend in Lowlands is Strict, used by 39.7% of listings.
- A majority (59.9%) of hosts in Lowlands utilize Firm or Strict policies, indicating a market where hosts prioritize booking security.
Recommendations for Hosts
- Consider adopting a Strict policy to align with the 39.7% market standard in Lowlands.
- With 39.7% using Strict terms, this is a viable option in Lowlands, particularly for high-value properties or during peak demand periods.
- Regularly review your cancellation policy against competitors and market demand shifts in Lowlands.
Lowlands STR Booking Lead Time Analysis (2025)
Average Booking Lead Time by Month
Booking Lead Time Insights for Lowlands
- The overall average booking lead time for vacation rentals in Lowlands is 65 days.
- Guests book furthest in advance for stays during February (average 99 days), likely coinciding with peak travel demand or local events.
- The shortest booking windows occur for stays in September (average 44 days), indicating more last-minute travel plans during this time.
- Seasonally, Winter (85 days avg.) sees the longest lead times, while Fall (56 days avg.) has the shortest, reflecting typical travel planning cycles.
Recommendations for Hosts
- Use the overall average lead time (65 days) as a baseline for your pricing and availability strategy in Lowlands.
- For February stays, consider implementing length-of-stay discounts or slightly higher rates for bookings made less than 99 days out to capitalize on advance planning.
- Target marketing efforts for the Winter season well in advance (at least 85 days) to capture early planners.
- Monitor your own booking lead times against these Lowlands averages to identify opportunities for dynamic pricing adjustments.
Popular & Essential Airbnb Amenities in Lowlands (2025)
Amenity Prevalence
Amenity Insights for Lowlands
- Essential amenities in Lowlands that guests expect include: Air conditioning, Wifi, Kitchen, TV. Lacking these (any) could significantly impact bookings.
- Popular amenities like Essentials, Refrigerator, Hot water are common but not universal. Offering these can provide a competitive edge.
Recommendations for Hosts
- Ensure your listing includes all essential amenities for Lowlands: Air conditioning, Wifi, Kitchen, TV.
- Prioritize adding missing essentials: Kitchen, TV.
- Consider adding popular differentiators like Essentials or Refrigerator to increase appeal.
- Highlight unique or less common amenities you offer (e.g., hot tub, dedicated workspace, EV charger) in your listing description and photos.
- Regularly check competitor amenities in Lowlands to stay competitive.
Lowlands Airbnb Guest Demographics & Profile Analysis (2025)
Guest Profile Summary for Lowlands
- The typical guest profile for Airbnb in Lowlands consists of predominantly international visitors (99%), with top international origins including Canada, typically belonging to the Post-2000s (Gen Z/Alpha) group (50%), primarily speaking English or French.
- Domestic travelers account for 1.5% of guests.
- Key international markets include United States (61.6%) and Canada (15.6%).
- Top languages spoken are English (57.2%) followed by French (13.6%).
- A significant demographic segment is the Post-2000s (Gen Z/Alpha) group, representing 50% of guests.
Recommendations for Hosts
- Focus marketing internationally, particularly towards travelers from Canada.
- Tailor amenities and listing descriptions to appeal to the dominant Post-2000s (Gen Z/Alpha) demographic (e.g., highlight fast WiFi, smart home features, local guides).
- Highlight unique local experiences or amenities relevant to the primary guest profile.
- Consider seasonal promotions aligned with peak travel times for key origin markets.
Nearby Short-Term Rental Market Comparison
How does the Lowlands Airbnb market stack up against its neighbors? Compare key performance metrics like average monthly revenue, ADR, and occupancy rates in surrounding areas to understand the broader regional STR landscape.
| Market | Active Properties | Monthly Revenue | Daily Rate | Avg. Occupancy |
|---|---|---|---|---|
| Buck Island | 14 | $9,544 | $2582.84 | 22% |
| Cruz Bay | 14 | $7,013 | $619.90 | 52% |
| Central | 17 | $6,787 | $1102.16 | 46% |
| Saint Barthélemy | 769 | $5,753 | $1511.68 | 32% |
| Simpson Bay | 48 | $5,549 | $506.49 | 43% |
| Coral Harbour | 162 | $5,244 | $446.89 | 51% |
| Fleming Estate | 15 | $5,216 | $507.12 | 45% |
| Cruz Bay | 404 | $4,994 | $561.57 | 43% |
| Long Bay Village | 25 | $4,235 | $666.52 | 33% |
| Road Town | 212 | $4,219 | $476.08 | 40% |