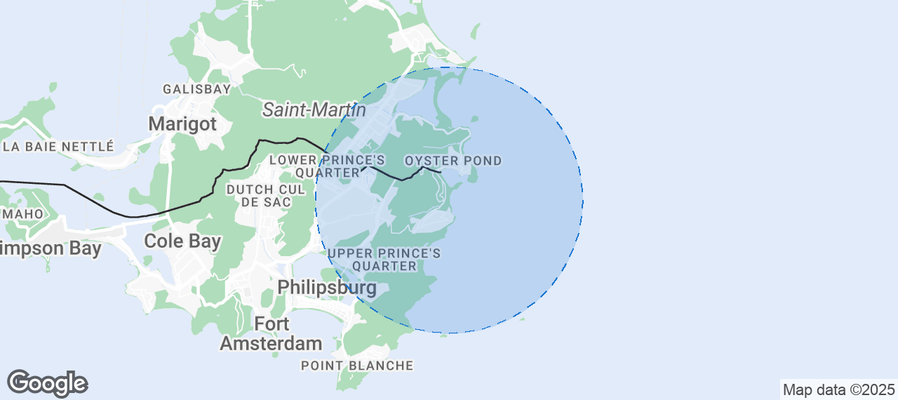
Dawn Beach Airbnb Market Analysis 2025: Short Term Rental Data & Vacation Rental Statistics in Sint Maarten, Netherlands
Is Airbnb profitable in Dawn Beach in 2025? Explore comprehensive Airbnb analytics for Dawn Beach, Sint Maarten, Netherlands to uncover income potential. This 2025 STR market report for Dawn Beach, based on AirROI data from April 2024 to March 2025, reveals key trends in the niche market of 59 active listings.
Whether you're considering an Airbnb investment in Dawn Beach, optimizing your existing vacation rental, or exploring rental arbitrage opportunities, understanding the Dawn Beach Airbnb data is crucial. Leveraging the low regulation environment is key to maximizing your short term rental income potential. Let's dive into the specifics.
Key Dawn Beach Airbnb Performance Metrics Overview
Monthly Airbnb Revenue Variations & Income Potential in Dawn Beach (2025)
Understanding the monthly revenue variations for Airbnb listings in Dawn Beach is key to maximizing your short term rental income potential. Seasonality significantly impacts earnings. Our analysis, based on data from the past 12 months, shows that the peak revenue month for STRs in Dawn Beach is typically February, while September often presents the lowest earnings, highlighting opportunities for strategic pricing adjustments during shoulder and low seasons. Explore the typical Airbnb income in Dawn Beach across different performance tiers:
- Best-in-class properties (Top 10%) achieve $11,902+ monthly, often utilizing dynamic pricing and superior guest experiences.
- Strong performing properties (Top 25%) earn $7,484 or more, indicating effective management and desirable locations/amenities.
- Typical properties (Median) generate around $3,279 per month, representing the average market performance.
- Entry-level properties (Bottom 25%) see earnings around $1,638, often with potential for optimization.
Average Monthly Airbnb Earnings Trend in Dawn Beach
Dawn Beach Airbnb Occupancy Rate Trends (2025)
Maximize your bookings by understanding the Dawn Beach STR occupancy trends. Seasonal demand shifts significantly influence how often properties are booked. Typically, Februarysees the highest demand (peak season occupancy), while June experiences the lowest (low season). Effective strategies, like adjusting minimum stays or offering promotions, can boost occupancy during slower periods. Here's how different property tiers perform in Dawn Beach:
- Best-in-class properties (Top 10%) achieve 76%+ occupancy, indicating high desirability and potentially optimized availability.
- Strong performing properties (Top 25%) maintain 57% or higher occupancy, suggesting good market fit and guest satisfaction.
- Typical properties (Median) have an occupancy rate around 34%.
- Entry-level properties (Bottom 25%) average 19% occupancy, potentially facing higher vacancy.
Average Monthly Occupancy Rate Trend in Dawn Beach
Average Daily Rate (ADR) Airbnb Trends in Dawn Beach (2025)
Effective short term rental pricing strategy in Dawn Beach involves understanding monthly ADR fluctuations. The Average Daily Rate (ADR) for Airbnb in Dawn Beach typically peaks in April and dips lowest during November. Leveraging Airbnb dynamic pricing tools or strategies based on this seasonality can significantly boost revenue. Here's a look at the typical nightly rates achieved:
- Best-in-class properties (Top 10%) command rates of $1,002+ per night, often due to premium features or locations.
- Strong performing properties (Top 25%) achieve nightly rates of $690 or more.
- Typical properties (Median) charge around $406 per night.
- Entry-level properties (Bottom 25%) earn around $225 per night.
Average Daily Rate (ADR) Trend by Month in Dawn Beach
Get Live Dawn Beach Market Intelligence 👇
Explore Real-time Analytics
Airbnb Seasonality Analysis & Trends in Dawn Beach (2025)
Peak Season (February, January, December)
- Revenue averages $8,331 per month
- Occupancy rates average 56.1%
- Daily rates average $465
Shoulder Season
- Revenue averages $5,220 per month
- Occupancy maintains around 36.1%
- Daily rates hold near $490
Low Season (July, September, October)
- Revenue drops to average $3,567 per month
- Occupancy decreases to average 29.6%
- Daily rates adjust to average $522
Seasonality Insights for Dawn Beach
- The Airbnb seasonality in Dawn Beach shows highly seasonal trends requiring careful strategy. While the sections above show seasonal averages, it's also insightful to look at the extremes:
- During the high season, the absolute peak month showcases Dawn Beach's highest earning potential, with monthly revenues capable of climbing to $9,031, occupancy reaching a high of 68.0%, and ADRs peaking at $533.
- Conversely, the slowest single month of the year, typically falling within the low season, marks the market's lowest point. In this month, revenue might dip to $3,185, occupancy could drop to 25.2%, and ADRs may adjust down to $396.
- Understanding both the seasonal averages and these monthly peaks and troughs in revenue, occupancy, and ADR is crucial for maximizing your Airbnb profit potential in Dawn Beach.
Seasonal Strategies for Maximizing Profit
- Peak Season: Maximize revenue through premium pricing and potentially longer minimum stays. Ensure high availability.
- Low Season: Offer competitive pricing, special promotions (e.g., extended stay discounts), and flexible cancellation policies. Target off-season travelers like remote workers or budget-conscious guests.
- Shoulder Seasons: Implement dynamic pricing that balances peak and low rates. Target weekend travelers or specific events. Offer slightly more flexible terms than peak season.
- Regularly analyze your own performance against these Dawn Beach seasonality benchmarks and adjust your pricing and availability strategy accordingly.
Best Areas for Airbnb Investment in Dawn Beach (2025)
Exploring the top neighborhoods for short-term rentals in Dawn Beach? This section highlights key areas, outlining why they are attractive for hosts and guests, along with notable local attractions. Consider these locations based on your target guest profile and investment strategy.
| Neighborhood / Area | Why Host Here? (Target Guests & Appeal) | Key Attractions & Landmarks |
|---|---|---|
| Dawn Beach | Dawn Beach is known for its stunning natural beauty and serene atmosphere, making it an ideal location for vacation rentals. It's close to beach activities and offers a relaxed environment for tourists looking to unwind. | Dawn Beach, Coralita Beach, Guana Bay Beach, Greenhouse Restaurant, The Oyster Pond, Sapphire Beach |
| Simpson Bay | Simpson Bay is a lively neighborhood famous for its nightlife and water sports, making it attractive for tourists who want both relaxation and excitement. | Simpson Bay Beach, Maho Beach, Sunset Beach Bar, Yacht Club, Casino Royale, Kite Beach |
| Philipsburg | The capital of Sint Maarten, Philipsburg is a bustling area with shopping, historical sites, and a vibrant boardwalk, attracting large numbers of tourists and cruise ship visitors. | Front Street, Great Bay Beach, Fort Amsterdam, St. Maarten Museum, The Courthouse, Walter Plantz Square |
| Maho | Maho Beach is famous for its proximity to the airport, where visitors can watch planes land very closely. It's popular with thrill-seekers and beach enthusiasts. | Maho Beach, Sunset Beach Bar, The Maho Plaza, Hotel Sonesta, Airport runway |
| Grand Case | Known for its gourmet cuisine and charming atmosphere, Grand Case attracts food lovers and tourists looking for a more upscale dining experience by the beach. | Grand Case Beach, Lolos (local restaurants), Grand Case Boulevard, Hurricane Maria Memorial, Creole Rock |
| Cupecoy | Cupecoy is known for its beautiful cliffs and beaches, providing a more secluded atmosphere, ideal for tourists looking for privacy and scenic views. | Cupecoy Beach, L'Escapade Beach, Tropicana Beach Club, Cupecoy Village, Mullet Bay |
| Orient Bay | Orient Bay is a popular clothing-optional beach known for its lively atmosphere, water sports, and numerous beach restaurants, attracting a diverse crowd. | Orient Bay Beach, Koko Beach, La Playa, Club Orient, Sandy Ground |
| Browns Bay | A hidden gem, Browns Bay offers a more relaxed beach experience, perfect for tourists seeking tranquility and natural beauty away from the busier areas. | Browns Bay Beach, Long Bay Beach, Daphne Beach, Pinel Island, Turtle Beach |
Understanding Airbnb License Requirements & STR Laws in Dawn Beach (2025)
While Dawn Beach, Sint Maarten, Netherlands currently shows low STR regulations, specific Airbnb license requirements might still exist or change. Always verify the latest short term rental regulations and Airbnb license requirements directly with local government authorities for Dawn Beach to ensure full compliance before hosting.
(Source: AirROI data, 2025, finding no licensed listings among those analyzed)
Top Performing Airbnb Properties in Dawn Beach (2025)
Benchmark your potential! Explore examples of top-performing Airbnb properties in Dawn Beachbased on Trailing Twelve Month (TTM) revenue. Analyze their characteristics, revenue, occupancy rate, and ADR to understand what drives success in this market.

Villa Bel Amour, luxury and awesome sea view
Entire Place • 9 bedrooms

"La Vue SXM" Paradise "Villa Rosa" 5 bedroom Rate
Entire Place • 5 bedrooms

Villa Tamarind | Luxury Oasis | Ocean views | 4BDR
Entire Place • 4 bedrooms

La maison de l 'île
Entire Place • 6 bedrooms
Sea Haven Villa - Breathtaking Views of Dawn Beach
Entire Place • 3 bedrooms

Endless Views @ Acqua Bleu
Entire Place • 2 bedrooms
Note: Performance varies based on location, size, amenities, seasonality, and management quality. Data reflects the past 12 months.
Top Performing Airbnb Hosts in Dawn Beach (2025)
Learn from the best! This table showcases top-performing Airbnb hosts in Dawn Beach based on the number of properties managed and estimated total revenue over the past year. Analyze their scale and performance metrics.
| Host Name | Properties | Grossing Revenue | Stay Reviews | Avg Rating |
|---|---|---|---|---|
| Gilles | 1 | $374,502 | 45 | 4.98/5.0 |
| Justyna | 1 | $193,294 | 12 | 5.00/5.0 |
| Maia | 3 | $146,594 | 29 | 3.32/5.0 |
| Vincent | 1 | $143,034 | 64 | 4.97/5.0 |
| Brett | 1 | $122,765 | 4 | 5.00/5.0 |
| Esheen | 1 | $107,051 | 54 | 4.98/5.0 |
| Island Properties | 4 | $104,556 | 36 | 4.68/5.0 |
| Brandon | 1 | $87,055 | 36 | 5.00/5.0 |
| Marcus & Jocelyn | 1 | $82,022 | 30 | 4.93/5.0 |
| Mariana And Manoj | 2 | $81,776 | 22 | 4.94/5.0 |
Analyzing the strategies of top hosts, such as their property selection, pricing, and guest communication, can offer valuable lessons for optimizing your own Airbnb operations in Dawn Beach.
Dive Deeper: Advanced Dawn Beach STR Market Data (2025)
Ready to unlock more insights? AirROI provides access to advanced metrics and comprehensive Airbnb data for Dawn Beach. Explore detailed analytics beyond this report to refine your investment strategy, optimize pricing, and maximize your vacation rental profits.
Explore Advanced MetricsDawn Beach Short-Term Rental Market Composition (2025): Property & Room Types
Room Type Distribution
Property Type Distribution
Market Composition Insights for Dawn Beach
- The Dawn Beach Airbnb market composition is heavily skewed towards Entire Home/Apt listings, which make up 94.9% of the 59 active rentals. This indicates strong guest preference for privacy and space.
- Looking at the property type distribution in Dawn Beach, House properties are the most common (54.2%), reflecting the local real estate landscape.
- Houses represent a significant 54.2% portion, catering likely to families or larger groups.
- The presence of 5.1% Hotel/Boutique listings indicates integration with traditional hospitality.
Dawn Beach Airbnb Room Capacity Analysis (2025): Bedroom Distribution
Distribution of Listings by Number of Bedrooms
Room Capacity Insights for Dawn Beach
- The dominant room capacity in Dawn Beach is 2 bedrooms listings, making up 32.2% of the market. This suggests a strong demand for properties suitable for couples or solo travelers.
- Together, 2 bedrooms and 3 bedrooms properties represent 55.9% of the active Airbnb listings in Dawn Beach, indicating a high concentration in these sizes.
- A significant 45.8% of listings offer 3+ bedrooms, catering to larger groups and families seeking more space in Dawn Beach.
Dawn Beach Vacation Rental Guest Capacity Trends (2025)
Distribution of Listings by Guest Capacity
Guest Capacity Insights for Dawn Beach
- The most common guest capacity trend in Dawn Beach vacation rentals is listings accommodating 8+ guests (33.9%). This suggests the primary traveler segment is likely larger groups.
- Properties designed for 8+ guests and 4 guests dominate the Dawn Beach STR market, accounting for 64.4% of listings.
- 52.5% of properties accommodate 6+ guests, serving the market segment for larger families or group travel in Dawn Beach.
- On average, properties in Dawn Beach are equipped to host 5.4 guests.
Dawn Beach Airbnb Booking Patterns (2025): Available vs. Booked Days
Available Days Distribution
Booked Days Distribution
Booking Pattern Insights for Dawn Beach
- The most common availability pattern in Dawn Beach falls within the 271-366 days range, representing 62.7% of listings. This suggests many properties have significant open periods on their calendars.
- Approximately 79.6% of listings show high availability (181+ days open annually), indicating potential for increased bookings or specific owner usage patterns.
- For booked days, the 31-90 days range is most frequent in Dawn Beach (32.2%), reflecting common guest stay durations or potential owner blocking patterns.
- A notable 20.4% of properties secure long booking periods (181+ days booked per year), highlighting successful long-term rental strategies or significant owner usage.
Dawn Beach Airbnb Minimum Stay Requirements Analysis
Distribution of Listings by Minimum Night Requirement
1 Night
1 listings
1.8% of total
2 Nights
8 listings
14.3% of total
3 Nights
11 listings
19.6% of total
4-6 Nights
21 listings
37.5% of total
7-29 Nights
12 listings
21.4% of total
30+ Nights
3 listings
5.4% of total
Key Insights
- The most prevalent minimum stay requirement in Dawn Beach is 4-6 Nights, adopted by 37.5% of listings. This highlights the market's preference for longer commitments.
- Very short stays (1-2 nights) are less common (16.1%), suggesting hosts prefer slightly longer bookings to optimize turnover.
Recommendations
- Align with the market by considering a 4-6 Nights minimum stay, as 37.5% of Dawn Beach hosts use this setting.
- If feasible, allowing 1-night stays, especially midweek or during low season, could capture last-minute bookings, as only 1.8% currently do.
- Explore offering discounts for stays of 30+ nights to attract the 5.4% of the market seeking extended stays.
- Adjust minimum nights based on seasonality – potentially shorter during low season and longer during peak demand periods in Dawn Beach.
Dawn Beach Airbnb Cancellation Policy Trends Analysis (2025)
Super Strict 60 Days
4 listings
9.3% of total
Flexible
14 listings
32.6% of total
Moderate
8 listings
18.6% of total
Firm
12 listings
27.9% of total
Strict
5 listings
11.6% of total
Cancellation Policy Insights for Dawn Beach
- The prevailing Airbnb cancellation policy trend in Dawn Beach is Flexible, used by 32.6% of listings.
- There's a relatively balanced mix between guest-friendly (51.2%) and stricter (39.5%) policies, offering choices for different guest needs.
Recommendations for Hosts
- Consider adopting a Flexible policy to align with the 32.6% market standard in Dawn Beach.
- Using a Strict policy might deter some guests, as only 11.6% of listings use it. Evaluate if potential revenue protection outweighs possible lower booking rates.
- Regularly review your cancellation policy against competitors and market demand shifts in Dawn Beach.
Dawn Beach STR Booking Lead Time Analysis (2025)
Average Booking Lead Time by Month
Booking Lead Time Insights for Dawn Beach
- The overall average booking lead time for vacation rentals in Dawn Beach is 73 days.
- Guests book furthest in advance for stays during April (average 91 days), likely coinciding with peak travel demand or local events.
- The shortest booking windows occur for stays in June (average 48 days), indicating more last-minute travel plans during this time.
- Seasonally, Spring (86 days avg.) sees the longest lead times, while Summer (60 days avg.) has the shortest, reflecting typical travel planning cycles.
Recommendations for Hosts
- Use the overall average lead time (73 days) as a baseline for your pricing and availability strategy in Dawn Beach.
- For April stays, consider implementing length-of-stay discounts or slightly higher rates for bookings made less than 91 days out to capitalize on advance planning.
- Target marketing efforts for the Spring season well in advance (at least 86 days) to capture early planners.
- Monitor your own booking lead times against these Dawn Beach averages to identify opportunities for dynamic pricing adjustments.
Popular & Essential Airbnb Amenities in Dawn Beach (2025)
Amenity Prevalence
Amenity Insights for Dawn Beach
- Essential amenities in Dawn Beach that guests expect include: TV, Air conditioning, Wifi, Kitchen, Free parking on premises. Lacking these (any) could significantly impact bookings.
- Popular amenities like Essentials, Hot water, Washer are common but not universal. Offering these can provide a competitive edge.
Recommendations for Hosts
- Ensure your listing includes all essential amenities for Dawn Beach: TV, Air conditioning, Wifi, Kitchen, Free parking on premises.
- Prioritize adding missing essentials: Kitchen, Free parking on premises.
- Consider adding popular differentiators like Essentials or Hot water to increase appeal.
- Highlight unique or less common amenities you offer (e.g., hot tub, dedicated workspace, EV charger) in your listing description and photos.
- Regularly check competitor amenities in Dawn Beach to stay competitive.
Dawn Beach Airbnb Guest Demographics & Profile Analysis (2025)
Guest Profile Summary for Dawn Beach
- The typical guest profile for Airbnb in Dawn Beach consists of predominantly international visitors (99%), with top international origins including Canada, typically belonging to the Post-2000s (Gen Z/Alpha) group (50%), primarily speaking English or French.
- Domestic travelers account for 1.5% of guests.
- Key international markets include United States (66.2%) and Canada (18.5%).
- Top languages spoken are English (59.3%) followed by French (16.3%).
- A significant demographic segment is the Post-2000s (Gen Z/Alpha) group, representing 50% of guests.
Recommendations for Hosts
- Focus marketing internationally, particularly towards travelers from Canada.
- Tailor amenities and listing descriptions to appeal to the dominant Post-2000s (Gen Z/Alpha) demographic (e.g., highlight fast WiFi, smart home features, local guides).
- Highlight unique local experiences or amenities relevant to the primary guest profile.
- Consider seasonal promotions aligned with peak travel times for key origin markets.
Nearby Short-Term Rental Market Comparison
How does the Dawn Beach Airbnb market stack up against its neighbors? Compare key performance metrics like average monthly revenue, ADR, and occupancy rates in surrounding areas to understand the broader regional STR landscape.
| Market | Active Properties | Monthly Revenue | Daily Rate | Avg. Occupancy |
|---|---|---|---|---|
| Buck Island | 14 | $9,544 | $2582.84 | 22% |
| Cruz Bay | 14 | $7,013 | $619.90 | 52% |
| Central | 17 | $6,787 | $1102.16 | 46% |
| Saint Barthélemy | 769 | $5,753 | $1511.68 | 32% |
| Simpson Bay | 48 | $5,549 | $506.49 | 43% |
| Coral Harbour | 162 | $5,244 | $446.89 | 51% |
| Fleming Estate | 15 | $5,216 | $507.12 | 45% |
| Cruz Bay | 404 | $4,994 | $561.57 | 43% |
| Long Bay Village | 25 | $4,235 | $666.52 | 33% |
| Road Town | 212 | $4,219 | $476.08 | 40% |