Kampen Airbnb Market Analysis 2025: Short Term Rental Data & Vacation Rental Statistics in Overijssel, Netherlands
Is Airbnb profitable in Kampen in 2025? Explore comprehensive Airbnb analytics for Kampen, Overijssel, Netherlands to uncover income potential. This 2025 STR market report for Kampen, based on AirROI data from April 2024 to March 2025, reveals key trends in the niche market of 37 active listings.
Whether you're considering an Airbnb investment in Kampen, optimizing your existing vacation rental, or exploring rental arbitrage opportunities, understanding the Kampen Airbnb data is crucial. Leveraging the low regulation environment is key to maximizing your short term rental income potential. Let's dive into the specifics.
Key Kampen Airbnb Performance Metrics Overview
Monthly Airbnb Revenue Variations & Income Potential in Kampen (2025)
Understanding the monthly revenue variations for Airbnb listings in Kampen is key to maximizing your short term rental income potential. Seasonality significantly impacts earnings. Our analysis, based on data from the past 12 months, shows that the peak revenue month for STRs in Kampen is typically June, while March often presents the lowest earnings, highlighting opportunities for strategic pricing adjustments during shoulder and low seasons. Explore the typical Airbnb income in Kampen across different performance tiers:
- Best-in-class properties (Top 10%) achieve $4,326+ monthly, often utilizing dynamic pricing and superior guest experiences.
- Strong performing properties (Top 25%) earn $2,749 or more, indicating effective management and desirable locations/amenities.
- Typical properties (Median) generate around $1,555 per month, representing the average market performance.
- Entry-level properties (Bottom 25%) see earnings around $944, often with potential for optimization.
Average Monthly Airbnb Earnings Trend in Kampen
Kampen Airbnb Occupancy Rate Trends (2025)
Maximize your bookings by understanding the Kampen STR occupancy trends. Seasonal demand shifts significantly influence how often properties are booked. Typically, Junesees the highest demand (peak season occupancy), while March experiences the lowest (low season). Effective strategies, like adjusting minimum stays or offering promotions, can boost occupancy during slower periods. Here's how different property tiers perform in Kampen:
- Best-in-class properties (Top 10%) achieve 71%+ occupancy, indicating high desirability and potentially optimized availability.
- Strong performing properties (Top 25%) maintain 60% or higher occupancy, suggesting good market fit and guest satisfaction.
- Typical properties (Median) have an occupancy rate around 42%.
- Entry-level properties (Bottom 25%) average 23% occupancy, potentially facing higher vacancy.
Average Monthly Occupancy Rate Trend in Kampen
Average Daily Rate (ADR) Airbnb Trends in Kampen (2025)
Effective short term rental pricing strategy in Kampen involves understanding monthly ADR fluctuations. The Average Daily Rate (ADR) for Airbnb in Kampen typically peaks in August and dips lowest during November. Leveraging Airbnb dynamic pricing tools or strategies based on this seasonality can significantly boost revenue. Here's a look at the typical nightly rates achieved:
- Best-in-class properties (Top 10%) command rates of $243+ per night, often due to premium features or locations.
- Strong performing properties (Top 25%) achieve nightly rates of $172 or more.
- Typical properties (Median) charge around $105 per night.
- Entry-level properties (Bottom 25%) earn around $86 per night.
Average Daily Rate (ADR) Trend by Month in Kampen
Get Live Kampen Market Intelligence 👇

Explore Real-time Analytics
Airbnb Seasonality Analysis & Trends in Kampen (2025)
Peak Season (June, May, April)
- Revenue averages $3,554 per month
- Occupancy rates average 54.8%
- Daily rates average $141
Shoulder Season
- Revenue averages $1,797 per month
- Occupancy maintains around 42.3%
- Daily rates hold near $137
Low Season (January, February, March)
- Revenue drops to average $963 per month
- Occupancy decreases to average 29.6%
- Daily rates adjust to average $130
Seasonality Insights for Kampen
- The Airbnb seasonality in Kampen shows highly seasonal trends requiring careful strategy. While the sections above show seasonal averages, it's also insightful to look at the extremes:
- During the high season, the absolute peak month showcases Kampen's highest earning potential, with monthly revenues capable of climbing to $3,669, occupancy reaching a high of 60.3%, and ADRs peaking at $146.
- Conversely, the slowest single month of the year, typically falling within the low season, marks the market's lowest point. In this month, revenue might dip to $879, occupancy could drop to 26.8%, and ADRs may adjust down to $127.
- Understanding both the seasonal averages and these monthly peaks and troughs in revenue, occupancy, and ADR is crucial for maximizing your Airbnb profit potential in Kampen.
Seasonal Strategies for Maximizing Profit
- Peak Season: Maximize revenue through premium pricing and potentially longer minimum stays. Ensure high availability.
- Low Season: Offer competitive pricing, special promotions (e.g., extended stay discounts), and flexible cancellation policies. Target off-season travelers like remote workers or budget-conscious guests.
- Shoulder Seasons: Implement dynamic pricing that balances peak and low rates. Target weekend travelers or specific events. Offer slightly more flexible terms than peak season.
- Regularly analyze your own performance against these Kampen seasonality benchmarks and adjust your pricing and availability strategy accordingly.
Best Areas for Airbnb Investment in Kampen (2025)
Exploring the top neighborhoods for short-term rentals in Kampen? This section highlights key areas, outlining why they are attractive for hosts and guests, along with notable local attractions. Consider these locations based on your target guest profile and investment strategy.
| Neighborhood / Area | Why Host Here? (Target Guests & Appeal) | Key Attractions & Landmarks |
|---|---|---|
| Kampen City Center | The heart of Kampen, offering visitors historical architecture, shops, and dining options. A hub for cultural activities and local events, it's perfect for tourists who want an authentic experience. | Stichting Stadsherinnering Kampen, Kampen's Old Town, Bovenkerk Kampen, The IJssel River, Museum van de 20e Eeuw, Stadsbreed |
| IJssel River Area | Scenic views and outdoor activities along the river. This area is popular among nature lovers and offers recreational opportunities, appealing to both tourists and locals who enjoy water sports. | IJssel River Promenade, Biking and Walking Trails, Fishing opportunities, Nearby parks and nature reserves, Scenic boat tours, Local wildlife observation |
| Kampen's Historic District | Known for its well-preserved medieval buildings and charming streets, this district attracts history enthusiasts and offers a picturesque setting for tourists exploring Kampen's past. | Kampen's Historic Gateway, The Sphinx Tower, Old City Walls, Local museums, Historical reenactments, Walking tours of the district |
| Deventer | A nearby city with a vibrant cultural scene and historical significance, easy to reach from Kampen. Attracts visitors for its rich history, events, and beautiful river views. | Deventer Book Market, Sculpture Gallery, Historic Old Town, The Lebuinus Church, The IJssel River, Various festivals throughout the year |
| Kampen's Parks | Areas like 'Stadspark' and 'Wilhelminapark' provide green spaces for relaxation and recreation. Popular among families and those looking to unwind in nature, making it attractive for vacation rentals. | Stadspark, Wilhelminapark, Picnic areas, Playgrounds, Walking paths, Seasonal events |
| Nearby Veluwe National Park | A short drive from Kampen, this park is a major draw for tourists interested in nature, hiking, and wildlife. Great potential for attracting guests who enjoy outdoor adventures. | Hiking trails, Wildlife watching, Scenic landscapes, Cycling routes, Campsites, Visitor centers with information on nature |
| Kampen's Cultural Venues | This area includes theaters, galleries, and music venues that attract visitors for performances, exhibitions, and arts festivals, appealing to the creative crowd. | Theater Kampen, Cultural Festivals, Art Galleries, Live music venues, Workshops and classes, Community art projects |
| Local Culinary Spots | Kampen is home to several restaurants and cafes that focus on local cuisine, attracting foodies and those interested in local dining experiences, a plus for Airbnb guests. | Local restaurants, Culinary festivals, Food tours, Traditional Dutch cuisine, Bakeries and coffee shops, Markets showcasing local produce |
Understanding Airbnb License Requirements & STR Laws in Kampen (2025)
While Kampen, Overijssel, Netherlands currently shows low STR regulations, specific Airbnb license requirements might still exist or change. Always verify the latest short term rental regulations and Airbnb license requirements directly with local government authorities for Kampen to ensure full compliance before hosting.
(Source: AirROI data, 2025, finding no licensed listings among those analyzed)
Top Performing Airbnb Properties in Kampen (2025)
Benchmark your potential! Explore examples of top-performing Airbnb properties in Kampenbased on Trailing Twelve Month (TTM) revenue. Analyze their characteristics, revenue, occupancy rate, and ADR to understand what drives success in this market.
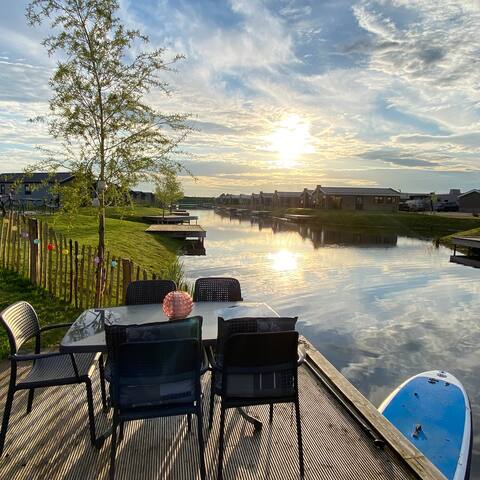
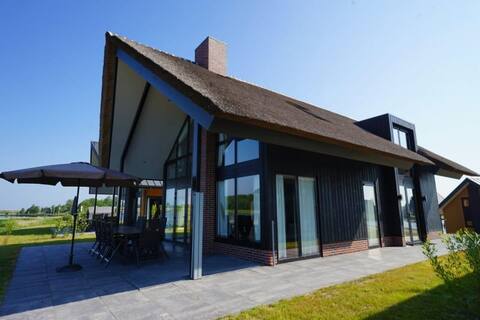
DREAM elegant Chalet on a natural lake Netherlands
Entire Place • 2 bedrooms
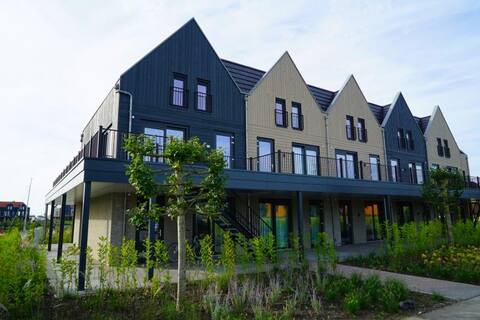
De Scheepswerf 8
Entire Place • 4 bedrooms
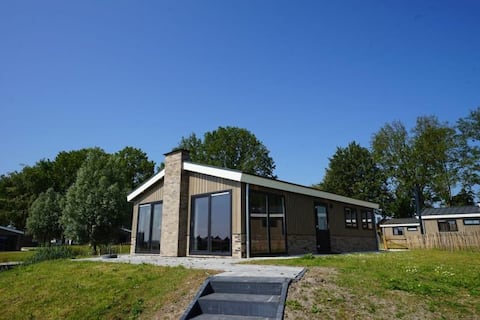
Hackfort 6
Entire Place • 3 bedrooms
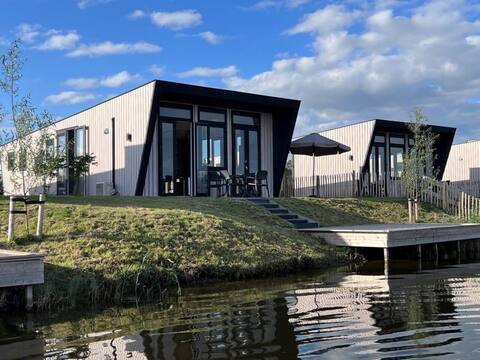
Just Nature 6
Entire Place • 3 bedrooms
Meervilla MIVA 10
Entire Place • 5 bedrooms
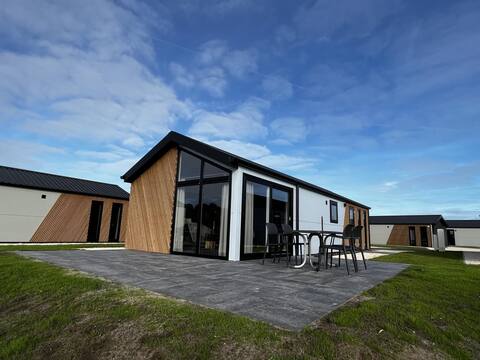
Modern chalet 5 km from Kampen
Entire Place • 2 bedrooms
Note: Performance varies based on location, size, amenities, seasonality, and management quality. Data reflects the past 12 months.
Top Performing Airbnb Hosts in Kampen (2025)
Learn from the best! This table showcases top-performing Airbnb hosts in Kampen based on the number of properties managed and estimated total revenue over the past year. Analyze their scale and performance metrics.
| Host Name | Properties | Grossing Revenue | Stay Reviews | Avg Rating |
|---|---|---|---|---|
| Host #387867368 | 5 | $200,933 | 44 | 4.49/5.0 |
| Helen | 5 | $81,704 | 93 | 3.80/5.0 |
| Hilde | 5 | $75,625 | 135 | 4.38/5.0 |
| Simon | 4 | $72,312 | 618 | 4.73/5.0 |
| Diana - BELVILLA | 3 | $70,853 | 21 | 4.65/5.0 |
| Inna | 1 | $49,190 | 14 | 4.93/5.0 |
| Brenda | 1 | $34,570 | 45 | 4.78/5.0 |
| Iris | 1 | $29,500 | 13 | 5.00/5.0 |
| Jan Rein | 1 | $28,227 | 74 | 4.82/5.0 |
| Paulien | 1 | $27,023 | 29 | 4.79/5.0 |
Analyzing the strategies of top hosts, such as their property selection, pricing, and guest communication, can offer valuable lessons for optimizing your own Airbnb operations in Kampen.
Dive Deeper: Advanced Kampen STR Market Data (2025)
Ready to unlock more insights? AirROI provides access to advanced metrics and comprehensive Airbnb data for Kampen. Explore detailed analytics beyond this report to refine your investment strategy, optimize pricing, and maximize your vacation rental profits.
Explore Advanced MetricsKampen Short-Term Rental Market Composition (2025): Property & Room Types
Room Type Distribution
Property Type Distribution
Market Composition Insights for Kampen
- The Kampen Airbnb market composition is heavily skewed towards Entire Home/Apt listings, which make up 64.9% of the 37 active rentals. This indicates strong guest preference for privacy and space.
- However, a notable 35.1% share for Private Rooms suggests opportunities for budget-conscious travelers or hosts renting out spare rooms.
- Looking at the property type distribution in Kampen, House properties are the most common (54.1%), reflecting the local real estate landscape.
- Houses represent a significant 54.1% portion, catering likely to families or larger groups.
- The presence of 8.1% Hotel/Boutique listings indicates integration with traditional hospitality.
- Smaller segments like unique stays, others, outdoor/unique (combined 8.1%) offer potential for unique stay experiences.
Kampen Airbnb Room Capacity Analysis (2025): Bedroom Distribution
Distribution of Listings by Number of Bedrooms
Room Capacity Insights for Kampen
- The dominant room capacity in Kampen is 1 bedroom listings, making up 35.1% of the market. This suggests a strong demand for properties suitable for couples or solo travelers.
- Together, 1 bedroom and 2 bedrooms properties represent 59.4% of the active Airbnb listings in Kampen, indicating a high concentration in these sizes.
Kampen Vacation Rental Guest Capacity Trends (2025)
Distribution of Listings by Guest Capacity
Guest Capacity Insights for Kampen
- The most common guest capacity trend in Kampen vacation rentals is listings accommodating 2 guests (37.8%). This suggests the primary traveler segment is likely couples or solo travelers.
- Properties designed for 2 guests and 4 guests dominate the Kampen STR market, accounting for 56.7% of listings.
- 16.2% of properties accommodate 6+ guests, serving the market segment for larger families or group travel in Kampen.
- On average, properties in Kampen are equipped to host 2.7 guests.
Kampen Airbnb Booking Patterns (2025): Available vs. Booked Days
Available Days Distribution
Booked Days Distribution
Booking Pattern Insights for Kampen
- The most common availability pattern in Kampen falls within the 181-270 days range, representing 54.1% of listings. This suggests many properties have significant open periods on their calendars.
- Approximately 81.1% of listings show high availability (181+ days open annually), indicating potential for increased bookings or specific owner usage patterns.
- For booked days, the 91-180 days range is most frequent in Kampen (51.4%), reflecting common guest stay durations or potential owner blocking patterns.
- A notable 24.3% of properties secure long booking periods (181+ days booked per year), highlighting successful long-term rental strategies or significant owner usage.
Kampen Airbnb Minimum Stay Requirements Analysis
Distribution of Listings by Minimum Night Requirement
1 Night
19 listings
65.5% of total
2 Nights
6 listings
20.7% of total
3 Nights
3 listings
10.3% of total
30+ Nights
1 listings
3.4% of total
Key Insights
- The most prevalent minimum stay requirement in Kampen is 1 Night, adopted by 65.5% of listings. This highlights the market's preference for shorter, flexible bookings.
- A strong majority (86.2%) of the Kampen Airbnb data shows acceptance of very short stays (1-2 nights), indicating a dynamic, high-turnover market.
Recommendations
- Align with the market by considering a 1 Night minimum stay, as 65.5% of Kampen hosts use this setting.
- Adjust minimum nights based on seasonality – potentially shorter during low season and longer during peak demand periods in Kampen.
Kampen Airbnb Cancellation Policy Trends Analysis (2025)
Flexible
10 listings
34.5% of total
Moderate
5 listings
17.2% of total
Firm
5 listings
17.2% of total
Strict
9 listings
31% of total
Cancellation Policy Insights for Kampen
- The prevailing Airbnb cancellation policy trend in Kampen is Flexible, used by 34.5% of listings.
- There's a relatively balanced mix between guest-friendly (51.7%) and stricter (48.2%) policies, offering choices for different guest needs.
Recommendations for Hosts
- Consider adopting a Flexible policy to align with the 34.5% market standard in Kampen.
- With 31% using Strict terms, this is a viable option in Kampen, particularly for high-value properties or during peak demand periods.
- Regularly review your cancellation policy against competitors and market demand shifts in Kampen.
Kampen STR Booking Lead Time Analysis (2025)
Average Booking Lead Time by Month
Booking Lead Time Insights for Kampen
- The overall average booking lead time for vacation rentals in Kampen is 41 days.
- Guests book furthest in advance for stays during June (average 71 days), likely coinciding with peak travel demand or local events.
- The shortest booking windows occur for stays in October (average 30 days), indicating more last-minute travel plans during this time.
- Seasonally, Summer (60 days avg.) sees the longest lead times, while Fall (32 days avg.) has the shortest, reflecting typical travel planning cycles.
Recommendations for Hosts
- Use the overall average lead time (41 days) as a baseline for your pricing and availability strategy in Kampen.
- For June stays, consider implementing length-of-stay discounts or slightly higher rates for bookings made less than 71 days out to capitalize on advance planning.
- Target marketing efforts for the Summer season well in advance (at least 60 days) to capture early planners.
- Monitor your own booking lead times against these Kampen averages to identify opportunities for dynamic pricing adjustments.
Popular & Essential Airbnb Amenities in Kampen (2025)
Amenity Prevalence
Amenity Insights for Kampen
- Essential amenities in Kampen that guests expect include: Wifi. Lacking these (this) could significantly impact bookings.
- Popular amenities like Heating, Smoke alarm, Kitchen are common but not universal. Offering these can provide a competitive edge.
Recommendations for Hosts
- Ensure your listing includes all essential amenities for Kampen: Wifi.
- Prioritize adding missing essentials: Wifi.
- Consider adding popular differentiators like Heating or Smoke alarm to increase appeal.
- Highlight unique or less common amenities you offer (e.g., hot tub, dedicated workspace, EV charger) in your listing description and photos.
- Regularly check competitor amenities in Kampen to stay competitive.
Kampen Airbnb Guest Demographics & Profile Analysis (2025)
Guest Profile Summary for Kampen
- The typical guest profile for Airbnb in Kampen consists of a mix of domestic (42%) and international guests, with top international origins including Germany, typically belonging to the Post-2000s (Gen Z/Alpha) group (50%), primarily speaking English or German.
- Domestic travelers account for 42.0% of guests.
- Key international markets include Netherlands (42%) and Germany (31.9%).
- Top languages spoken are English (38.6%) followed by German (19.6%).
- A significant demographic segment is the Post-2000s (Gen Z/Alpha) group, representing 50% of guests.
Recommendations for Hosts
- Balance marketing efforts between domestic and international channels based on the guest mix.
- Tailor amenities and listing descriptions to appeal to the dominant Post-2000s (Gen Z/Alpha) demographic (e.g., highlight fast WiFi, smart home features, local guides).
- Highlight unique local experiences or amenities relevant to the primary guest profile.
- Consider seasonal promotions aligned with peak travel times for key origin markets.
Nearby Short-Term Rental Market Comparison
How does the Kampen Airbnb market stack up against its neighbors? Compare key performance metrics like average monthly revenue, ADR, and occupancy rates in surrounding areas to understand the broader regional STR landscape.
| Market | Active Properties | Monthly Revenue | Daily Rate | Avg. Occupancy |
|---|---|---|---|---|
| Kockengen | 12 | $7,560 | $396.31 | 61% |
| Baarlo | 18 | $5,602 | $313.73 | 60% |
| Bentveld | 13 | $4,798 | $443.61 | 54% |
| Halfweg | 17 | $4,307 | $231.13 | 55% |
| Aerdenhout | 17 | $4,288 | $694.02 | 53% |
| Merksplas | 10 | $3,885 | $256.59 | 44% |
| Oud Ade | 17 | $3,779 | $277.47 | 51% |
| Rijs | 27 | $3,772 | $356.97 | 45% |
| Zwanenburg | 24 | $3,720 | $240.77 | 66% |
| Kerkdriel | 25 | $3,607 | $323.16 | 40% |