Zandvoort Airbnb Market Analysis 2025: Short Term Rental Data & Vacation Rental Statistics in North Holland, Netherlands
Is Airbnb profitable in Zandvoort in 2025? Explore comprehensive Airbnb analytics for Zandvoort, North Holland, Netherlands to uncover income potential. This 2025 STR market report for Zandvoort, based on AirROI data from April 2024 to March 2025, reveals key trends in the market of 553 active listings.
Whether you're considering an Airbnb investment in Zandvoort, optimizing your existing vacation rental, or exploring rental arbitrage opportunities, understanding the Zandvoort Airbnb data is crucial. Navigating the high regulation landscape is key to maximizing your short term rental income potential. Let's dive into the specifics.
Key Zandvoort Airbnb Performance Metrics Overview
Monthly Airbnb Revenue Variations & Income Potential in Zandvoort (2025)
Understanding the monthly revenue variations for Airbnb listings in Zandvoort is key to maximizing your short term rental income potential. Seasonality significantly impacts earnings. Our analysis, based on data from the past 12 months, shows that the peak revenue month for STRs in Zandvoort is typically August, while February often presents the lowest earnings, highlighting opportunities for strategic pricing adjustments during shoulder and low seasons. Explore the typical Airbnb income in Zandvoort across different performance tiers:
- Best-in-class properties (Top 10%) achieve $5,971+ monthly, often utilizing dynamic pricing and superior guest experiences.
- Strong performing properties (Top 25%) earn $4,053 or more, indicating effective management and desirable locations/amenities.
- Typical properties (Median) generate around $2,613 per month, representing the average market performance.
- Entry-level properties (Bottom 25%) see earnings around $1,610, often with potential for optimization.
Average Monthly Airbnb Earnings Trend in Zandvoort
Zandvoort Airbnb Occupancy Rate Trends (2025)
Maximize your bookings by understanding the Zandvoort STR occupancy trends. Seasonal demand shifts significantly influence how often properties are booked. Typically, Julysees the highest demand (peak season occupancy), while January experiences the lowest (low season). Effective strategies, like adjusting minimum stays or offering promotions, can boost occupancy during slower periods. Here's how different property tiers perform in Zandvoort:
- Best-in-class properties (Top 10%) achieve 87%+ occupancy, indicating high desirability and potentially optimized availability.
- Strong performing properties (Top 25%) maintain 72% or higher occupancy, suggesting good market fit and guest satisfaction.
- Typical properties (Median) have an occupancy rate around 51%.
- Entry-level properties (Bottom 25%) average 27% occupancy, potentially facing higher vacancy.
Average Monthly Occupancy Rate Trend in Zandvoort
Average Daily Rate (ADR) Airbnb Trends in Zandvoort (2025)
Effective short term rental pricing strategy in Zandvoort involves understanding monthly ADR fluctuations. The Average Daily Rate (ADR) for Airbnb in Zandvoort typically peaks in August and dips lowest during February. Leveraging Airbnb dynamic pricing tools or strategies based on this seasonality can significantly boost revenue. Here's a look at the typical nightly rates achieved:
- Best-in-class properties (Top 10%) command rates of $356+ per night, often due to premium features or locations.
- Strong performing properties (Top 25%) achieve nightly rates of $239 or more.
- Typical properties (Median) charge around $162 per night.
- Entry-level properties (Bottom 25%) earn around $120 per night.
Average Daily Rate (ADR) Trend by Month in Zandvoort
Get Live Zandvoort Market Intelligence 👇

Explore Real-time Analytics
Airbnb Seasonality Analysis & Trends in Zandvoort (2025)
Peak Season (August, July, May)
- Revenue averages $4,760 per month
- Occupancy rates average 63.5%
- Daily rates average $233
Shoulder Season
- Revenue averages $3,137 per month
- Occupancy maintains around 50.0%
- Daily rates hold near $210
Low Season (January, February, March)
- Revenue drops to average $1,584 per month
- Occupancy decreases to average 35.8%
- Daily rates adjust to average $180
Seasonality Insights for Zandvoort
- The Airbnb seasonality in Zandvoort shows highly seasonal trends requiring careful strategy. While the sections above show seasonal averages, it's also insightful to look at the extremes:
- During the high season, the absolute peak month showcases Zandvoort's highest earning potential, with monthly revenues capable of climbing to $5,046, occupancy reaching a high of 66.9%, and ADRs peaking at $246.
- Conversely, the slowest single month of the year, typically falling within the low season, marks the market's lowest point. In this month, revenue might dip to $1,402, occupancy could drop to 30.1%, and ADRs may adjust down to $179.
- Understanding both the seasonal averages and these monthly peaks and troughs in revenue, occupancy, and ADR is crucial for maximizing your Airbnb profit potential in Zandvoort.
Seasonal Strategies for Maximizing Profit
- Peak Season: Maximize revenue through premium pricing and potentially longer minimum stays. Ensure high availability.
- Low Season: Offer competitive pricing, special promotions (e.g., extended stay discounts), and flexible cancellation policies. Target off-season travelers like remote workers or budget-conscious guests.
- Shoulder Seasons: Implement dynamic pricing that balances peak and low rates. Target weekend travelers or specific events. Offer slightly more flexible terms than peak season.
- Regularly analyze your own performance against these Zandvoort seasonality benchmarks and adjust your pricing and availability strategy accordingly.
Best Areas for Airbnb Investment in Zandvoort (2025)
Exploring the top neighborhoods for short-term rentals in Zandvoort? This section highlights key areas, outlining why they are attractive for hosts and guests, along with notable local attractions. Consider these locations based on your target guest profile and investment strategy.
| Neighborhood / Area | Why Host Here? (Target Guests & Appeal) | Key Attractions & Landmarks |
|---|---|---|
| Zandvoort Beach | A popular destination for beach lovers and tourists, Zandvoort Beach offers sun, sand, and various water sports. Its close proximity to Amsterdam makes it a favorite for weekend trips. | Zandvoort Beach, Zandvoort Circuit, Holland Casino Zandvoort, Juttersmu-Zee-Um, Skyline Beach Club |
| Zandvoort Village | The charming village center with shops, cafes, and restaurants. It provides a cozy atmosphere that attracts visitors seeking local culture and dining experiences. | Gereformeerde Kerk, Zandvoorts Museum, Park Zuid, local markets, restaurants |
| Amsterdamse Waterleidingduinen | A nature reserve offering beautiful hiking trails and the chance to see wildlife, especially for those who enjoy outdoor activities. A great location for nature lovers. | Amsterdamse Waterleidingduinen, hiking trails, wild deer, floral diversity, scenic views |
| Zandvoort Marina | The marina area appeals to those who enjoy boating and water activities, with opportunities for yacht rentals and stunning views of the ocean. | Marina Zandvoort, boating activities, restaurants by the water, fishing, yachting experiences |
| Zandvoort Noord | A quieter area favored by families and longer-term stays, offering a more relaxed environment while still being close to the beach and village amenities. | local parks, family-friendly attractions, bike rentals, Zandvoortse Heide, community markets |
| Near Circuit Park Zandvoort | Host events and races at the circuit, attracting motorsport fans and event-goers. A unique aspect of Zandvoort that draws visitors during race weekends. | Circuit Park Zandvoort, race events, car exhibitions, motorsport festivals, local food stalls |
| Zandvoort Nature Reserve | Ideal for eco-tourism and sustainable stays, this area focuses on the natural beauty around Zandvoort, promoting outdoor and environmental activities. | nature trails, bird watching, landscape photography, educational tours, eco-friendly accommodations |
| Zandvoort Seafront Promenade | The lively promenade offers a vibrant atmosphere with restaurants, bars, and shops alongside stunning views of the North Sea, making it a hotspot for visitors. | promenade activities, beach clubs, seafood restaurants, shopping stalls, scenic views of the ocean |
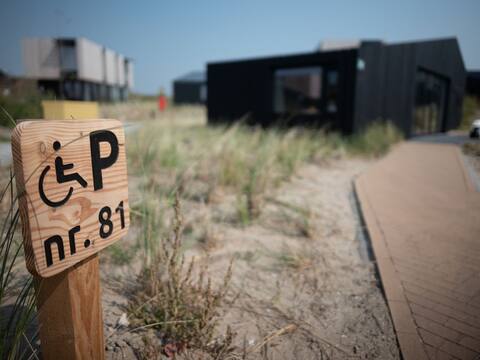
Understanding Airbnb License Requirements & STR Laws in Zandvoort (2025)
Yes, Zandvoort, North Holland, Netherlands enforces high STR regulations. Obtaining a license and ensuring compliance is almost certainly required according to current 2025 STR laws. Always verify the latest short term rental regulations and Airbnb license requirements directly with local government authorities for Zandvoort to ensure full compliance before hosting.
(Source: AirROI data, 2025, based on 88% licensed listings)
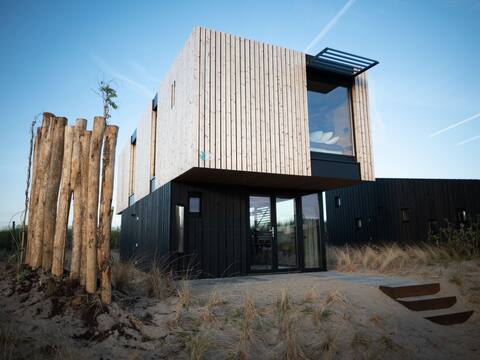
Top Performing Airbnb Properties in Zandvoort (2025)
Benchmark your potential! Explore examples of top-performing Airbnb properties in Zandvoortbased on Trailing Twelve Month (TTM) revenue. Analyze their characteristics, revenue, occupancy rate, and ADR to understand what drives success in this market.

It's Fab - Villa by the sea
Entire Place • 5 bedrooms

Spacious lodge only 100m from the sea
Entire Place • 2 bedrooms

Time Out Beach House
Entire Place • 4 bedrooms
Modern lodge, just 100 m from the sea
Entire Place • 2 bedrooms
Modified lodge, at just 100 m. from the beach
Entire Place • 2 bedrooms

Experience our Casa Luna! The place to stay:)
Entire Place • 3 bedrooms
Note: Performance varies based on location, size, amenities, seasonality, and management quality. Data reflects the past 12 months.
Top Performing Airbnb Hosts in Zandvoort (2025)
Learn from the best! This table showcases top-performing Airbnb hosts in Zandvoort based on the number of properties managed and estimated total revenue over the past year. Analyze their scale and performance metrics.
| Host Name | Properties | Grossing Revenue | Stay Reviews | Avg Rating |
|---|---|---|---|---|
| Rental Valley | 67 | $2,654,093 | 3744 | 4.37/5.0 |
| Dionne | 104 | $2,534,478 | 3527 | 4.37/5.0 |
| Lisette | 15 | $679,231 | 2208 | 4.80/5.0 |
| Center Parcs Europe | 9 | $596,669 | 127 | 2.95/5.0 |
| Diana - BELVILLA | 7 | $488,546 | 48 | 3.25/5.0 |
| EnJoy | 18 | $377,601 | 288 | 4.27/5.0 |
| Strandpaviljoen Thalassa | 11 | $340,021 | 168 | 4.73/5.0 |
| Zandvoortferienwohnungen | 10 | $272,032 | 123 | 4.22/5.0 |
| Eva | 6 | $171,634 | 287 | 4.55/5.0 |
| Host #135880227 | 6 | $154,717 | 204 | 4.86/5.0 |
Analyzing the strategies of top hosts, such as their property selection, pricing, and guest communication, can offer valuable lessons for optimizing your own Airbnb operations in Zandvoort.
Dive Deeper: Advanced Zandvoort STR Market Data (2025)
Ready to unlock more insights? AirROI provides access to advanced metrics and comprehensive Airbnb data for Zandvoort. Explore detailed analytics beyond this report to refine your investment strategy, optimize pricing, and maximize your vacation rental profits.
Explore Advanced MetricsZandvoort Short-Term Rental Market Composition (2025): Property & Room Types
Room Type Distribution
Property Type Distribution
Market Composition Insights for Zandvoort
- The Zandvoort Airbnb market composition is heavily skewed towards Entire Home/Apt listings, which make up 89.2% of the 553 active rentals. This indicates strong guest preference for privacy and space.
- Looking at the property type distribution in Zandvoort, Apartment/Condo properties are the most common (56.6%), reflecting the local real estate landscape.
- Houses represent a significant 25.9% portion, catering likely to families or larger groups.
- The presence of 12.8% Hotel/Boutique listings indicates integration with traditional hospitality.
- Smaller segments like others, outdoor/unique (combined 4.7%) offer potential for unique stay experiences.
Zandvoort Airbnb Room Capacity Analysis (2025): Bedroom Distribution
Distribution of Listings by Number of Bedrooms
Room Capacity Insights for Zandvoort
- The dominant room capacity in Zandvoort is 1 bedroom listings, making up 60.2% of the market. This suggests a strong demand for properties suitable for couples or solo travelers.
- Together, 1 bedroom and 2 bedrooms properties represent 80.3% of the active Airbnb listings in Zandvoort, indicating a high concentration in these sizes.
- With over half the market (60.2%) consisting of studios or 1-bedroom units, Zandvoort is particularly well-suited for individuals or couples.
- Listings with 3+ bedrooms (6.6%) represent a smaller niche, potentially indicating an underserved market for larger group accommodations in Zandvoort.
Zandvoort Vacation Rental Guest Capacity Trends (2025)
Distribution of Listings by Guest Capacity
Guest Capacity Insights for Zandvoort
- The most common guest capacity trend in Zandvoort vacation rentals is listings accommodating 2 guests (56.2%). This suggests the primary traveler segment is likely couples or solo travelers.
- Properties designed for 2 guests and 4 guests dominate the Zandvoort STR market, accounting for 79.9% of listings.
- A significant 56.2% of listings cater specifically to 1-2 guests, highlighting strong demand from couples and solo travelers in Zandvoort.
- On average, properties in Zandvoort are equipped to host 2.8 guests.
Zandvoort Airbnb Booking Patterns (2025): Available vs. Booked Days
Available Days Distribution
Booked Days Distribution
Booking Pattern Insights for Zandvoort
- The most common availability pattern in Zandvoort falls within the 181-270 days range, representing 35.3% of listings. This suggests many properties have significant open periods on their calendars.
- Approximately 62.1% of listings show high availability (181+ days open annually), indicating potential for increased bookings or specific owner usage patterns.
- For booked days, the 91-180 days range is most frequent in Zandvoort (37.3%), reflecting common guest stay durations or potential owner blocking patterns.
- A notable 38.2% of properties secure long booking periods (181+ days booked per year), highlighting successful long-term rental strategies or significant owner usage.
Zandvoort Airbnb Minimum Stay Requirements Analysis
Distribution of Listings by Minimum Night Requirement
1 Night
61 listings
11.7% of total
2 Nights
220 listings
42.3% of total
3 Nights
79 listings
15.2% of total
4-6 Nights
33 listings
6.3% of total
7-29 Nights
18 listings
3.5% of total
30+ Nights
109 listings
21% of total
Key Insights
- The most prevalent minimum stay requirement in Zandvoort is 2 Nights, adopted by 42.3% of listings. This highlights the market's preference for shorter, flexible bookings.
- A significant segment (21%) caters to monthly stays (30+ nights) in Zandvoort, pointing to opportunities in the extended-stay market.
Recommendations
- Align with the market by considering a 2 Nights minimum stay, as 42.3% of Zandvoort hosts use this setting.
- If feasible, allowing 1-night stays, especially midweek or during low season, could capture last-minute bookings, as only 11.7% currently do.
- A 2-night minimum appears standard (42.3%). Consider this for weekends or peak periods.
- Explore offering discounts for stays of 30+ nights to attract the 21% of the market seeking extended stays.
- Adjust minimum nights based on seasonality – potentially shorter during low season and longer during peak demand periods in Zandvoort.
Zandvoort Airbnb Cancellation Policy Trends Analysis (2025)
Super Strict 30 Days
54 listings
10.6% of total
Super Strict 60 Days
13 listings
2.6% of total
Flexible
27 listings
5.3% of total
Moderate
87 listings
17.1% of total
Firm
205 listings
40.4% of total
Strict
122 listings
24% of total
Cancellation Policy Insights for Zandvoort
- The prevailing Airbnb cancellation policy trend in Zandvoort is Firm, used by 40.4% of listings.
- A majority (64.4%) of hosts in Zandvoort utilize Firm or Strict policies, indicating a market where hosts prioritize booking security.
Recommendations for Hosts
- Consider adopting a Firm policy to align with the 40.4% market standard in Zandvoort.
- Regularly review your cancellation policy against competitors and market demand shifts in Zandvoort.
Zandvoort STR Booking Lead Time Analysis (2025)
Average Booking Lead Time by Month
Booking Lead Time Insights for Zandvoort
- The overall average booking lead time for vacation rentals in Zandvoort is 61 days.
- Guests book furthest in advance for stays during June (average 99 days), likely coinciding with peak travel demand or local events.
- The shortest booking windows occur for stays in February (average 39 days), indicating more last-minute travel plans during this time.
- Seasonally, Summer (87 days avg.) sees the longest lead times, while Winter (49 days avg.) has the shortest, reflecting typical travel planning cycles.
Recommendations for Hosts
- Use the overall average lead time (61 days) as a baseline for your pricing and availability strategy in Zandvoort.
- For June stays, consider implementing length-of-stay discounts or slightly higher rates for bookings made less than 99 days out to capitalize on advance planning.
- Target marketing efforts for the Summer season well in advance (at least 87 days) to capture early planners.
- Monitor your own booking lead times against these Zandvoort averages to identify opportunities for dynamic pricing adjustments.
Popular & Essential Airbnb Amenities in Zandvoort (2025)
Amenity Prevalence
Amenity Insights for Zandvoort
- Essential amenities in Zandvoort that guests expect include: Wifi, Heating, TV. Lacking these (any) could significantly impact bookings.
- Popular amenities like Coffee maker, Essentials, Smoke alarm are common but not universal. Offering these can provide a competitive edge.
Recommendations for Hosts
- Ensure your listing includes all essential amenities for Zandvoort: Wifi, Heating, TV.
- Prioritize adding missing essentials: Wifi, Heating, TV.
- Consider adding popular differentiators like Coffee maker or Essentials to increase appeal.
- Highlight unique or less common amenities you offer (e.g., hot tub, dedicated workspace, EV charger) in your listing description and photos.
- Regularly check competitor amenities in Zandvoort to stay competitive.
Zandvoort Airbnb Guest Demographics & Profile Analysis (2025)
Guest Profile Summary for Zandvoort
- The typical guest profile for Airbnb in Zandvoort consists of predominantly international visitors (93%), with top international origins including Netherlands, typically belonging to the Post-2000s (Gen Z/Alpha) group (50%), primarily speaking English or German.
- Domestic travelers account for 6.7% of guests.
- Key international markets include Germany (65.7%) and Netherlands (6.7%).
- Top languages spoken are English (41.9%) followed by German (33.7%).
- A significant demographic segment is the Post-2000s (Gen Z/Alpha) group, representing 50% of guests.
Recommendations for Hosts
- Focus marketing internationally, particularly towards travelers from Netherlands.
- Tailor amenities and listing descriptions to appeal to the dominant Post-2000s (Gen Z/Alpha) demographic (e.g., highlight fast WiFi, smart home features, local guides).
- Highlight unique local experiences or amenities relevant to the primary guest profile.
- Consider seasonal promotions aligned with peak travel times for key origin markets.
Nearby Short-Term Rental Market Comparison
How does the Zandvoort Airbnb market stack up against its neighbors? Compare key performance metrics like average monthly revenue, ADR, and occupancy rates in surrounding areas to understand the broader regional STR landscape.
| Market | Active Properties | Monthly Revenue | Daily Rate | Avg. Occupancy |
|---|---|---|---|---|
| Kockengen | 12 | $7,560 | $396.31 | 61% |
| Bentveld | 13 | $4,798 | $443.61 | 54% |
| Halfweg | 17 | $4,307 | $231.13 | 55% |
| Aerdenhout | 17 | $4,288 | $694.02 | 53% |
| Merksplas | 10 | $3,885 | $256.59 | 44% |
| Oud Ade | 17 | $3,779 | $277.47 | 51% |
| Rijs | 27 | $3,772 | $356.97 | 45% |
| Zwanenburg | 24 | $3,720 | $240.77 | 66% |
| Kerkdriel | 25 | $3,607 | $323.16 | 40% |
| Brecht | 10 | $3,531 | $251.70 | 54% |