Sint Maarten Airbnb Market Analysis 2025: Short Term Rental Data & Vacation Rental Statistics in North Holland, Netherlands
Is Airbnb profitable in Sint Maarten in 2025? Explore comprehensive Airbnb analytics for Sint Maarten, North Holland, Netherlands to uncover income potential. This 2025 STR market report for Sint Maarten, based on AirROI data from April 2024 to March 2025, reveals key trends in the niche market of 79 active listings.
Whether you're considering an Airbnb investment in Sint Maarten, optimizing your existing vacation rental, or exploring rental arbitrage opportunities, understanding the Sint Maarten Airbnb data is crucial. Leveraging the low regulation environment is key to maximizing your short term rental income potential. Let's dive into the specifics.
Key Sint Maarten Airbnb Performance Metrics Overview
Monthly Airbnb Revenue Variations & Income Potential in Sint Maarten (2025)
Understanding the monthly revenue variations for Airbnb listings in Sint Maarten is key to maximizing your short term rental income potential. Seasonality significantly impacts earnings. Our analysis, based on data from the past 12 months, shows that the peak revenue month for STRs in Sint Maarten is typically July, while January often presents the lowest earnings, highlighting opportunities for strategic pricing adjustments during shoulder and low seasons. Explore the typical Airbnb income in Sint Maarten across different performance tiers:
- Best-in-class properties (Top 10%) achieve $4,300+ monthly, often utilizing dynamic pricing and superior guest experiences.
- Strong performing properties (Top 25%) earn $2,685 or more, indicating effective management and desirable locations/amenities.
- Typical properties (Median) generate around $1,687 per month, representing the average market performance.
- Entry-level properties (Bottom 25%) see earnings around $887, often with potential for optimization.
Average Monthly Airbnb Earnings Trend in Sint Maarten
Sint Maarten Airbnb Occupancy Rate Trends (2025)
Maximize your bookings by understanding the Sint Maarten STR occupancy trends. Seasonal demand shifts significantly influence how often properties are booked. Typically, Augustsees the highest demand (peak season occupancy), while January experiences the lowest (low season). Effective strategies, like adjusting minimum stays or offering promotions, can boost occupancy during slower periods. Here's how different property tiers perform in Sint Maarten:
- Best-in-class properties (Top 10%) achieve 77%+ occupancy, indicating high desirability and potentially optimized availability.
- Strong performing properties (Top 25%) maintain 58% or higher occupancy, suggesting good market fit and guest satisfaction.
- Typical properties (Median) have an occupancy rate around 35%.
- Entry-level properties (Bottom 25%) average 19% occupancy, potentially facing higher vacancy.
Average Monthly Occupancy Rate Trend in Sint Maarten
Average Daily Rate (ADR) Airbnb Trends in Sint Maarten (2025)
Effective short term rental pricing strategy in Sint Maarten involves understanding monthly ADR fluctuations. The Average Daily Rate (ADR) for Airbnb in Sint Maarten typically peaks in July and dips lowest during March. Leveraging Airbnb dynamic pricing tools or strategies based on this seasonality can significantly boost revenue. Here's a look at the typical nightly rates achieved:
- Best-in-class properties (Top 10%) command rates of $285+ per night, often due to premium features or locations.
- Strong performing properties (Top 25%) achieve nightly rates of $200 or more.
- Typical properties (Median) charge around $140 per night.
- Entry-level properties (Bottom 25%) earn around $113 per night.
Average Daily Rate (ADR) Trend by Month in Sint Maarten
Get Live Sint Maarten Market Intelligence 👇

Explore Real-time Analytics
Airbnb Seasonality Analysis & Trends in Sint Maarten (2025)
Peak Season (July, August, May)
- Revenue averages $3,650 per month
- Occupancy rates average 59.9%
- Daily rates average $224
Shoulder Season
- Revenue averages $2,018 per month
- Occupancy maintains around 37.2%
- Daily rates hold near $194
Low Season (January, February, March)
- Revenue drops to average $1,147 per month
- Occupancy decreases to average 24.9%
- Daily rates adjust to average $143
Seasonality Insights for Sint Maarten
- The Airbnb seasonality in Sint Maarten shows highly seasonal trends requiring careful strategy. While the sections above show seasonal averages, it's also insightful to look at the extremes:
- During the high season, the absolute peak month showcases Sint Maarten's highest earning potential, with monthly revenues capable of climbing to $4,075, occupancy reaching a high of 66.9%, and ADRs peaking at $231.
- Conversely, the slowest single month of the year, typically falling within the low season, marks the market's lowest point. In this month, revenue might dip to $1,002, occupancy could drop to 20.7%, and ADRs may adjust down to $137.
- Understanding both the seasonal averages and these monthly peaks and troughs in revenue, occupancy, and ADR is crucial for maximizing your Airbnb profit potential in Sint Maarten.
Seasonal Strategies for Maximizing Profit
- Peak Season: Maximize revenue through premium pricing and potentially longer minimum stays. Ensure high availability.
- Low Season: Offer competitive pricing, special promotions (e.g., extended stay discounts), and flexible cancellation policies. Target off-season travelers like remote workers or budget-conscious guests.
- Shoulder Seasons: Implement dynamic pricing that balances peak and low rates. Target weekend travelers or specific events. Offer slightly more flexible terms than peak season.
- Regularly analyze your own performance against these Sint Maarten seasonality benchmarks and adjust your pricing and availability strategy accordingly.
Best Areas for Airbnb Investment in Sint Maarten (2025)
Exploring the top neighborhoods for short-term rentals in Sint Maarten? This section highlights key areas, outlining why they are attractive for hosts and guests, along with notable local attractions. Consider these locations based on your target guest profile and investment strategy.
| Neighborhood / Area | Why Host Here? (Target Guests & Appeal) | Key Attractions & Landmarks |
|---|---|---|
| Philipsburg | The capital of Sint Maarten, it offers rich history and culture along with beautiful beaches. It's a major cruise ship destination, attracting thousands of tourists year-round. | Great Bay Beach, Fort Amsterdam, Little Bay Beach, Philipsburg Courthouse, Boardwalk, Shopping Street |
| Maho Beach | Famous for its vibrant nightlife and the remarkable sight of planes flying right above the beach. It's a hot spot for young adults and tourists looking for excitement. | Maho Beach, Maho Village, Sunset Beach Bar, Casino Royale, flying experiences |
| Simpson Bay | A lively area known for its beach bars and restaurants, perfect for those looking to enjoy water sports and nightlife. A great location for vacation rentals. | Simpson Bay Beach, Kim Sha Beach, Simpson Bay Lagoon, Bounty Beach, Dolphin Discovery |
| Cole Bay | A residential area that attracts tourists due to its proximity to Maho and Simpson Bay, offering a more local experience while still being close to attractions. | Cole Bay Hill, Captain Oliver's, Bamboo Bed & Breakfast, Layla's Beach Bar, local shops |
| Cupecoy | Known for its upscale villas and luxurious accommodations, it's a popular destination for affluent visitors and honeymooners, making it ideal for high-end Airbnbs. | Cupecoy Beach, Sandy Ground, La Samanna Beach Resort, golf courses, fine dining |
| Dawn Beach | Famous for its beautiful white sand and calm waters, it's a favorite for families and those seeking a relaxing beach vacation. | Dawn Beach, Oyster Pond, Coral Beach Club, Dawn Beach Club, water sports |
| Grand Case | The culinary capital of the Caribbean, known for its gourmet restaurants and beach vibes. Attracts food lovers and those looking for cultural experiences. | Grand Case Beach, Lolo's Restaurants, Creole Rock, Butterfly Farm, local art galleries |
| Orient Bay | Known for its vibrant beach scene and water sports, this area is popular among tourists looking for beach activities and nightlife, also featuring a nudist beach. | Orient Bay Beach, Club Orient, water sports activities, restaurants along the beach, nightlife events |
Understanding Airbnb License Requirements & STR Laws in Sint Maarten (2025)
While Sint Maarten, North Holland, Netherlands currently shows low STR regulations, specific Airbnb license requirements might still exist or change. Always verify the latest short term rental regulations and Airbnb license requirements directly with local government authorities for Sint Maarten to ensure full compliance before hosting.
(Source: AirROI data, 2025, finding no licensed listings among those analyzed)
Top Performing Airbnb Properties in Sint Maarten (2025)
Benchmark your potential! Explore examples of top-performing Airbnb properties in Sint Maartenbased on Trailing Twelve Month (TTM) revenue. Analyze their characteristics, revenue, occupancy rate, and ADR to understand what drives success in this market.

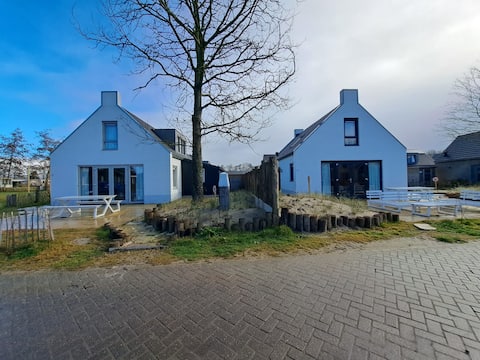
Villa aan het Wiel at Recreatiepark De Wielen
Entire Place • 6 bedrooms

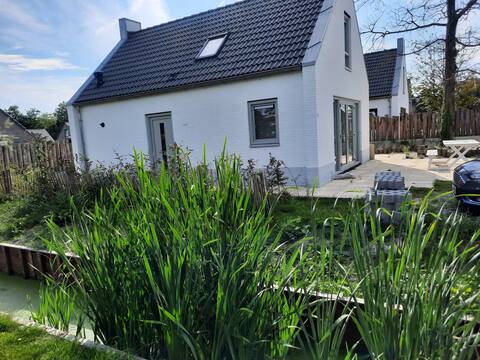
Holidayhouse Modern Sint Maarten by Droomvilla
Entire Place • 3 bedrooms
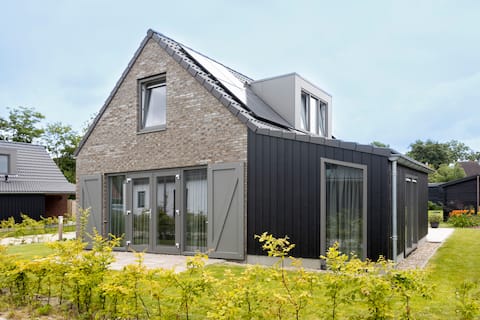
Luxury Villas, 2 side by side, 5km from the sea
Entire Place • 6 bedrooms

Lake Villa 81 at Recreatiepark De Wielen
Entire Place • 3 bedrooms
Villa, 5km from Sea, Swimming Pool, Sauna
Entire Place • 3 bedrooms
Beautiful luxury holiday Villa 15 min from the sea
Entire Place • 2 bedrooms
Note: Performance varies based on location, size, amenities, seasonality, and management quality. Data reflects the past 12 months.
Top Performing Airbnb Hosts in Sint Maarten (2025)
Learn from the best! This table showcases top-performing Airbnb hosts in Sint Maarten based on the number of properties managed and estimated total revenue over the past year. Analyze their scale and performance metrics.
| Host Name | Properties | Grossing Revenue | Stay Reviews | Avg Rating |
|---|---|---|---|---|
| Recreatiepark De Wielen | 45 | $674,567 | 292 | 3.37/5.0 |
| Chr | 3 | $130,433 | 139 | 4.70/5.0 |
| Droomvilla | 5 | $113,366 | 26 | 2.62/5.0 |
| Astrid | 1 | $51,076 | 5 | 4.40/5.0 |
| Jeannette | 1 | $39,851 | 35 | 5.00/5.0 |
| Simone | 1 | $32,017 | 56 | 4.98/5.0 |
| Anneke | 1 | $30,643 | 61 | 4.87/5.0 |
| Maike | 2 | $27,282 | 33 | 4.88/5.0 |
| Yvonne | 1 | $27,008 | 358 | 4.91/5.0 |
| Zahra | 1 | $26,877 | 135 | 4.50/5.0 |
Analyzing the strategies of top hosts, such as their property selection, pricing, and guest communication, can offer valuable lessons for optimizing your own Airbnb operations in Sint Maarten.
Dive Deeper: Advanced Sint Maarten STR Market Data (2025)
Ready to unlock more insights? AirROI provides access to advanced metrics and comprehensive Airbnb data for Sint Maarten. Explore detailed analytics beyond this report to refine your investment strategy, optimize pricing, and maximize your vacation rental profits.
Explore Advanced MetricsSint Maarten Short-Term Rental Market Composition (2025): Property & Room Types
Room Type Distribution
Property Type Distribution
Market Composition Insights for Sint Maarten
- The Sint Maarten Airbnb market composition is heavily skewed towards Entire Home/Apt listings, which make up 98.7% of the 79 active rentals. This indicates strong guest preference for privacy and space.
- Looking at the property type distribution in Sint Maarten, House properties are the most common (81%), reflecting the local real estate landscape.
- Houses represent a significant 81% portion, catering likely to families or larger groups.
- Smaller segments like outdoor/unique, others, unique stays, hotel/boutique (combined 11.3%) offer potential for unique stay experiences.
Sint Maarten Airbnb Room Capacity Analysis (2025): Bedroom Distribution
Distribution of Listings by Number of Bedrooms
Room Capacity Insights for Sint Maarten
- The dominant room capacity in Sint Maarten is 2 bedrooms listings, making up 41.8% of the market. This suggests a strong demand for properties suitable for couples or solo travelers.
- Together, 2 bedrooms and 3 bedrooms properties represent 81.0% of the active Airbnb listings in Sint Maarten, indicating a high concentration in these sizes.
- A significant 43.0% of listings offer 3+ bedrooms, catering to larger groups and families seeking more space in Sint Maarten.
Sint Maarten Vacation Rental Guest Capacity Trends (2025)
Distribution of Listings by Guest Capacity
Guest Capacity Insights for Sint Maarten
- The most common guest capacity trend in Sint Maarten vacation rentals is listings accommodating 4 guests (35.4%). This suggests the primary traveler segment is likely small families or groups.
- Properties designed for 4 guests and 6 guests dominate the Sint Maarten STR market, accounting for 69.6% of listings.
- 41.8% of properties accommodate 6+ guests, serving the market segment for larger families or group travel in Sint Maarten.
- On average, properties in Sint Maarten are equipped to host 4.8 guests.
Sint Maarten Airbnb Booking Patterns (2025): Available vs. Booked Days
Available Days Distribution
Booked Days Distribution
Booking Pattern Insights for Sint Maarten
- The most common availability pattern in Sint Maarten falls within the 271-366 days range, representing 57% of listings. This suggests many properties have significant open periods on their calendars.
- Approximately 86.1% of listings show high availability (181+ days open annually), indicating potential for increased bookings or specific owner usage patterns.
- For booked days, the 31-90 days range is most frequent in Sint Maarten (31.6%), reflecting common guest stay durations or potential owner blocking patterns.
- A notable 15.2% of properties secure long booking periods (181+ days booked per year), highlighting successful long-term rental strategies or significant owner usage.
Sint Maarten Airbnb Minimum Stay Requirements Analysis
Distribution of Listings by Minimum Night Requirement
1 Night
27 listings
36% of total
2 Nights
15 listings
20% of total
3 Nights
10 listings
13.3% of total
4-6 Nights
4 listings
5.3% of total
30+ Nights
19 listings
25.3% of total
Key Insights
- The most prevalent minimum stay requirement in Sint Maarten is 1 Night, adopted by 36% of listings. This highlights the market's preference for shorter, flexible bookings.
- A significant segment (25.3%) caters to monthly stays (30+ nights) in Sint Maarten, pointing to opportunities in the extended-stay market.
Recommendations
- Align with the market by considering a 1 Night minimum stay, as 36% of Sint Maarten hosts use this setting.
- Explore offering discounts for stays of 30+ nights to attract the 25.3% of the market seeking extended stays.
- Adjust minimum nights based on seasonality – potentially shorter during low season and longer during peak demand periods in Sint Maarten.
Sint Maarten Airbnb Cancellation Policy Trends Analysis (2025)
Super Strict 30 Days
1 listings
1.5% of total
Super Strict 60 Days
1 listings
1.5% of total
Flexible
2 listings
3.1% of total
Moderate
4 listings
6.2% of total
Firm
11 listings
16.9% of total
Strict
46 listings
70.8% of total
Cancellation Policy Insights for Sint Maarten
- The prevailing Airbnb cancellation policy trend in Sint Maarten is Strict, used by 70.8% of listings.
- A majority (87.7%) of hosts in Sint Maarten utilize Firm or Strict policies, indicating a market where hosts prioritize booking security.
Recommendations for Hosts
- Consider adopting a Strict policy to align with the 70.8% market standard in Sint Maarten.
- With 70.8% using Strict terms, this is a viable option in Sint Maarten, particularly for high-value properties or during peak demand periods.
- Regularly review your cancellation policy against competitors and market demand shifts in Sint Maarten.
Sint Maarten STR Booking Lead Time Analysis (2025)
Average Booking Lead Time by Month
Booking Lead Time Insights for Sint Maarten
- The overall average booking lead time for vacation rentals in Sint Maarten is 50 days.
- Guests book furthest in advance for stays during July (average 92 days), likely coinciding with peak travel demand or local events.
- The shortest booking windows occur for stays in April (average 40 days), indicating more last-minute travel plans during this time.
- Seasonally, Summer (80 days avg.) sees the longest lead times, while Winter (51 days avg.) has the shortest, reflecting typical travel planning cycles.
Recommendations for Hosts
- Use the overall average lead time (50 days) as a baseline for your pricing and availability strategy in Sint Maarten.
- For July stays, consider implementing length-of-stay discounts or slightly higher rates for bookings made less than 92 days out to capitalize on advance planning.
- Target marketing efforts for the Summer season well in advance (at least 80 days) to capture early planners.
- Monitor your own booking lead times against these Sint Maarten averages to identify opportunities for dynamic pricing adjustments.
Popular & Essential Airbnb Amenities in Sint Maarten (2025)
Amenity Prevalence
Amenity Insights for Sint Maarten
- Essential amenities in Sint Maarten that guests expect include: Wifi, Heating, Kitchen, TV, Hot water. Lacking these (any) could significantly impact bookings.
- Popular amenities like Free parking on premises, Dishes and silverware, Refrigerator are common but not universal. Offering these can provide a competitive edge.
Recommendations for Hosts
- Ensure your listing includes all essential amenities for Sint Maarten: Wifi, Heating, Kitchen, TV, Hot water.
- Prioritize adding missing essentials: Kitchen, TV, Hot water.
- Consider adding popular differentiators like Free parking on premises or Dishes and silverware to increase appeal.
- Highlight unique or less common amenities you offer (e.g., hot tub, dedicated workspace, EV charger) in your listing description and photos.
- Regularly check competitor amenities in Sint Maarten to stay competitive.
Sint Maarten Airbnb Guest Demographics & Profile Analysis (2025)
Guest Profile Summary for Sint Maarten
- The typical guest profile for Airbnb in Sint Maarten consists of predominantly international visitors (75%), with top international origins including Netherlands, typically belonging to the Post-2000s (Gen Z/Alpha) group (50%), primarily speaking English or German.
- Domestic travelers account for 25.2% of guests.
- Key international markets include Germany (56%) and Netherlands (25.2%).
- Top languages spoken are English (36.8%) followed by German (30%).
- A significant demographic segment is the Post-2000s (Gen Z/Alpha) group, representing 50% of guests.
Recommendations for Hosts
- Focus marketing internationally, particularly towards travelers from Netherlands.
- Tailor amenities and listing descriptions to appeal to the dominant Post-2000s (Gen Z/Alpha) demographic (e.g., highlight fast WiFi, smart home features, local guides).
- Highlight unique local experiences or amenities relevant to the primary guest profile.
- Consider seasonal promotions aligned with peak travel times for key origin markets.
Nearby Short-Term Rental Market Comparison
How does the Sint Maarten Airbnb market stack up against its neighbors? Compare key performance metrics like average monthly revenue, ADR, and occupancy rates in surrounding areas to understand the broader regional STR landscape.
| Market | Active Properties | Monthly Revenue | Daily Rate | Avg. Occupancy |
|---|---|---|---|---|
| Kockengen | 12 | $7,560 | $396.31 | 61% |
| Bentveld | 13 | $4,798 | $443.61 | 54% |
| Halfweg | 17 | $4,307 | $231.13 | 55% |
| Aerdenhout | 17 | $4,288 | $694.02 | 53% |
| Merksplas | 10 | $3,885 | $256.59 | 44% |
| Oud Ade | 17 | $3,779 | $277.47 | 51% |
| Rijs | 27 | $3,772 | $356.97 | 45% |
| Zwanenburg | 24 | $3,720 | $240.77 | 66% |
| Kerkdriel | 25 | $3,607 | $323.16 | 40% |
| Brecht | 10 | $3,531 | $251.70 | 54% |