Opmeer Airbnb Market Analysis 2025: Short Term Rental Data & Vacation Rental Statistics in North Holland, Netherlands
Is Airbnb profitable in Opmeer in 2025? Explore comprehensive Airbnb analytics for Opmeer, North Holland, Netherlands to uncover income potential. This 2025 STR market report for Opmeer, based on AirROI data from April 2024 to March 2025, reveals key trends in the niche market of 38 active listings.
Whether you're considering an Airbnb investment in Opmeer, optimizing your existing vacation rental, or exploring rental arbitrage opportunities, understanding the Opmeer Airbnb data is crucial. Leveraging the low regulation environment is key to maximizing your short term rental income potential. Let's dive into the specifics.
Key Opmeer Airbnb Performance Metrics Overview
Monthly Airbnb Revenue Variations & Income Potential in Opmeer (2025)
Understanding the monthly revenue variations for Airbnb listings in Opmeer is key to maximizing your short term rental income potential. Seasonality significantly impacts earnings. Our analysis, based on data from the past 12 months, shows that the peak revenue month for STRs in Opmeer is typically August, while January often presents the lowest earnings, highlighting opportunities for strategic pricing adjustments during shoulder and low seasons. Explore the typical Airbnb income in Opmeer across different performance tiers:
- Best-in-class properties (Top 10%) achieve $3,869+ monthly, often utilizing dynamic pricing and superior guest experiences.
- Strong performing properties (Top 25%) earn $2,535 or more, indicating effective management and desirable locations/amenities.
- Typical properties (Median) generate around $1,785 per month, representing the average market performance.
- Entry-level properties (Bottom 25%) see earnings around $1,051, often with potential for optimization.
Average Monthly Airbnb Earnings Trend in Opmeer
Opmeer Airbnb Occupancy Rate Trends (2025)
Maximize your bookings by understanding the Opmeer STR occupancy trends. Seasonal demand shifts significantly influence how often properties are booked. Typically, Augustsees the highest demand (peak season occupancy), while January experiences the lowest (low season). Effective strategies, like adjusting minimum stays or offering promotions, can boost occupancy during slower periods. Here's how different property tiers perform in Opmeer:
- Best-in-class properties (Top 10%) achieve 79%+ occupancy, indicating high desirability and potentially optimized availability.
- Strong performing properties (Top 25%) maintain 65% or higher occupancy, suggesting good market fit and guest satisfaction.
- Typical properties (Median) have an occupancy rate around 50%.
- Entry-level properties (Bottom 25%) average 28% occupancy, potentially facing higher vacancy.
Average Monthly Occupancy Rate Trend in Opmeer
Average Daily Rate (ADR) Airbnb Trends in Opmeer (2025)
Effective short term rental pricing strategy in Opmeer involves understanding monthly ADR fluctuations. The Average Daily Rate (ADR) for Airbnb in Opmeer typically peaks in May and dips lowest during February. Leveraging Airbnb dynamic pricing tools or strategies based on this seasonality can significantly boost revenue. Here's a look at the typical nightly rates achieved:
- Best-in-class properties (Top 10%) command rates of $250+ per night, often due to premium features or locations.
- Strong performing properties (Top 25%) achieve nightly rates of $164 or more.
- Typical properties (Median) charge around $112 per night.
- Entry-level properties (Bottom 25%) earn around $94 per night.
Average Daily Rate (ADR) Trend by Month in Opmeer
Get Live Opmeer Market Intelligence 👇

Explore Real-time Analytics
Airbnb Seasonality Analysis & Trends in Opmeer (2025)
Peak Season (August, July, June)
- Revenue averages $3,325 per month
- Occupancy rates average 65.9%
- Daily rates average $168
Shoulder Season
- Revenue averages $2,175 per month
- Occupancy maintains around 46.9%
- Daily rates hold near $159
Low Season (January, February, November)
- Revenue drops to average $1,151 per month
- Occupancy decreases to average 31.0%
- Daily rates adjust to average $137
Seasonality Insights for Opmeer
- The Airbnb seasonality in Opmeer shows highly seasonal trends requiring careful strategy. While the sections above show seasonal averages, it's also insightful to look at the extremes:
- During the high season, the absolute peak month showcases Opmeer's highest earning potential, with monthly revenues capable of climbing to $3,685, occupancy reaching a high of 73.7%, and ADRs peaking at $170.
- Conversely, the slowest single month of the year, typically falling within the low season, marks the market's lowest point. In this month, revenue might dip to $982, occupancy could drop to 22.9%, and ADRs may adjust down to $130.
- Understanding both the seasonal averages and these monthly peaks and troughs in revenue, occupancy, and ADR is crucial for maximizing your Airbnb profit potential in Opmeer.
Seasonal Strategies for Maximizing Profit
- Peak Season: Maximize revenue through premium pricing and potentially longer minimum stays. Ensure high availability.
- Low Season: Offer competitive pricing, special promotions (e.g., extended stay discounts), and flexible cancellation policies. Target off-season travelers like remote workers or budget-conscious guests.
- Shoulder Seasons: Implement dynamic pricing that balances peak and low rates. Target weekend travelers or specific events. Offer slightly more flexible terms than peak season.
- Regularly analyze your own performance against these Opmeer seasonality benchmarks and adjust your pricing and availability strategy accordingly.
Best Areas for Airbnb Investment in Opmeer (2025)
Exploring the top neighborhoods for short-term rentals in Opmeer? This section highlights key areas, outlining why they are attractive for hosts and guests, along with notable local attractions. Consider these locations based on your target guest profile and investment strategy.
| Neighborhood / Area | Why Host Here? (Target Guests & Appeal) | Key Attractions & Landmarks |
|---|---|---|
| Opmeer Village | Quaint village atmosphere with local charm and easy access to parks and nature. Ideal for families and travelers seeking a peaceful retreat. | Local parks, Historical sites, Cycling routes, Community events |
| De Weere | A small yet vibrant community known for its accessibility to larger towns and natural surroundings. Great for short stays exploring the countryside. | Nature walks, Nearby cycling paths, Community festivals |
| Oosthulst | Scenic environment with typical Dutch countryside views. Perfect for nature enthusiasts and those looking to escape city life. | Farmlands, Scenic routes, Local farms, Bird watching spots |
| Hoogwoud | Features rustic charm and is close to surrounding nature reserves. Attracts visitors interested in agriculture and rural experiences. | Nature reserves, Local farms, Cycling paths |
| Spierdijk | Historic village known for its old buildings and community spirit. Offers a unique glimpse into rural Dutch life. | Historic architecture, Local shops, Annual festivals |
| Camping de Waal | Popular camping site in the region that attracts outdoor lovers and families. Good for hosting nature-oriented travelers and groups. | Camping activities, Nature exploration, Outdoor sports |
| Groenveld | Close-knit community with easy access to nature and local attractions, ideal for short-term visitors seeking tranquility. | Natural parks, Cycling tracks, Local gatherings |
| Westwoud | Charming village surrounded by greenery, popular for its relaxed pace and welcoming community. Great for serene retreats. | Tranquil parks, Local heritage sites, Surrounding countryside |
Understanding Airbnb License Requirements & STR Laws in Opmeer (2025)
While Opmeer, North Holland, Netherlands currently shows low STR regulations, specific Airbnb license requirements might still exist or change. Always verify the latest short term rental regulations and Airbnb license requirements directly with local government authorities for Opmeer to ensure full compliance before hosting.
(Source: AirROI data, 2025, finding no licensed listings among those analyzed)
Top Performing Airbnb Properties in Opmeer (2025)
Benchmark your potential! Explore examples of top-performing Airbnb properties in Opmeerbased on Trailing Twelve Month (TTM) revenue. Analyze their characteristics, revenue, occupancy rate, and ADR to understand what drives success in this market.

Hoeve Joy
Entire Place • 2 bedrooms
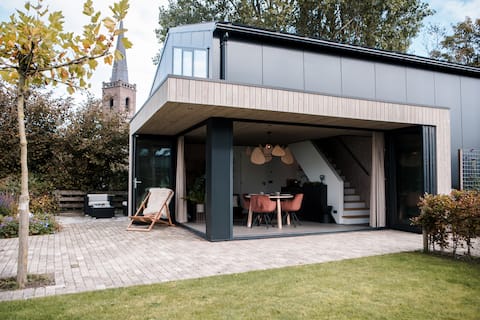
Luxury guesthouse with sauna - B&B Spanbroek.
Entire Place • 1 bedroom
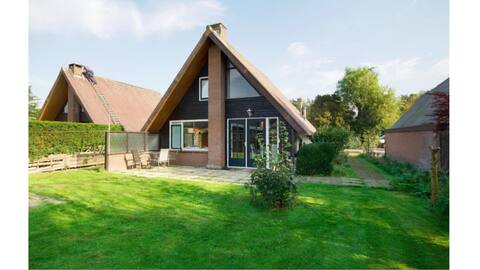
Family bungalow 8p. near the beach & Amsterdam
Entire Place • 4 bedrooms
Cozy house till 6 pers. near Amsterdam and sea
Entire Place • 3 bedrooms
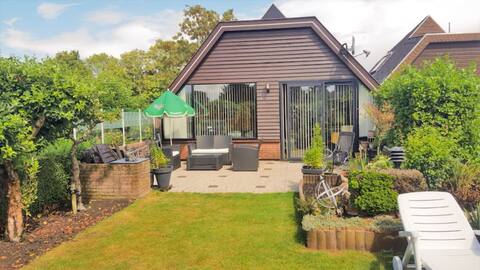
Bungalow 8 p. Close to beach and Amsterdam
Entire Place • 4 bedrooms
Family bungalow 6 p. near beach & Amsterdam (4)
Entire Place • 3 bedrooms
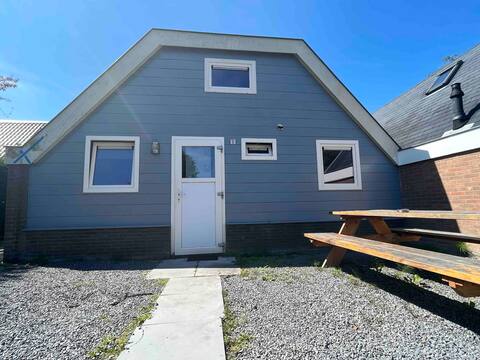
Note: Performance varies based on location, size, amenities, seasonality, and management quality. Data reflects the past 12 months.
Top Performing Airbnb Hosts in Opmeer (2025)
Learn from the best! This table showcases top-performing Airbnb hosts in Opmeer based on the number of properties managed and estimated total revenue over the past year. Analyze their scale and performance metrics.
| Host Name | Properties | Grossing Revenue | Stay Reviews | Avg Rating |
|---|---|---|---|---|
| Jos | 4 | $112,490 | 445 | 4.46/5.0 |
| Novasol | 1 | $66,159 | 11 | 4.45/5.0 |
| Bianca | 2 | $56,050 | 34 | 4.53/5.0 |
| Marianne | 1 | $51,800 | 23 | 5.00/5.0 |
| Natallia | 1 | $38,153 | 107 | 4.71/5.0 |
| Suco & Ajsela | 3 | $37,548 | 54 | 4.51/5.0 |
| Isra | 1 | $24,346 | 45 | 4.78/5.0 |
| Christel | 1 | $21,769 | 86 | 4.95/5.0 |
| Christin | 2 | $19,847 | 135 | 4.51/5.0 |
| Judith | 1 | $19,837 | 7 | 4.71/5.0 |
Analyzing the strategies of top hosts, such as their property selection, pricing, and guest communication, can offer valuable lessons for optimizing your own Airbnb operations in Opmeer.
Dive Deeper: Advanced Opmeer STR Market Data (2025)
Ready to unlock more insights? AirROI provides access to advanced metrics and comprehensive Airbnb data for Opmeer. Explore detailed analytics beyond this report to refine your investment strategy, optimize pricing, and maximize your vacation rental profits.
Explore Advanced MetricsOpmeer Short-Term Rental Market Composition (2025): Property & Room Types
Room Type Distribution
Property Type Distribution
Market Composition Insights for Opmeer
- The Opmeer Airbnb market composition is heavily skewed towards Entire Home/Apt listings, which make up 94.7% of the 38 active rentals. This indicates strong guest preference for privacy and space.
- Looking at the property type distribution in Opmeer, House properties are the most common (73.7%), reflecting the local real estate landscape.
- Houses represent a significant 73.7% portion, catering likely to families or larger groups.
- The presence of 5.3% Hotel/Boutique listings indicates integration with traditional hospitality.
- Smaller segments like outdoor/unique, others, unique stays (combined 7.8%) offer potential for unique stay experiences.
Opmeer Airbnb Room Capacity Analysis (2025): Bedroom Distribution
Distribution of Listings by Number of Bedrooms
Room Capacity Insights for Opmeer
- The dominant room capacity in Opmeer is 2 bedrooms listings, making up 42.1% of the market. This suggests a strong demand for properties suitable for couples or solo travelers.
- Together, 2 bedrooms and 3 bedrooms properties represent 65.8% of the active Airbnb listings in Opmeer, indicating a high concentration in these sizes.
- A significant 31.6% of listings offer 3+ bedrooms, catering to larger groups and families seeking more space in Opmeer.
Opmeer Vacation Rental Guest Capacity Trends (2025)
Distribution of Listings by Guest Capacity
Guest Capacity Insights for Opmeer
- The most common guest capacity trend in Opmeer vacation rentals is listings accommodating 4 guests (23.7%). This suggests the primary traveler segment is likely small families or groups.
- Properties designed for 4 guests and 6 guests dominate the Opmeer STR market, accounting for 44.8% of listings.
- 31.6% of properties accommodate 6+ guests, serving the market segment for larger families or group travel in Opmeer.
- On average, properties in Opmeer are equipped to host 4.2 guests.
Opmeer Airbnb Booking Patterns (2025): Available vs. Booked Days
Available Days Distribution
Booked Days Distribution
Booking Pattern Insights for Opmeer
- The most common availability pattern in Opmeer falls within the 181-270 days range, representing 44.7% of listings. This suggests many properties have significant open periods on their calendars.
- Approximately 76.3% of listings show high availability (181+ days open annually), indicating potential for increased bookings or specific owner usage patterns.
- For booked days, the 91-180 days range is most frequent in Opmeer (42.1%), reflecting common guest stay durations or potential owner blocking patterns.
- A notable 26.4% of properties secure long booking periods (181+ days booked per year), highlighting successful long-term rental strategies or significant owner usage.
Opmeer Airbnb Minimum Stay Requirements Analysis
Distribution of Listings by Minimum Night Requirement
1 Night
1 listings
2.9% of total
2 Nights
21 listings
61.8% of total
3 Nights
5 listings
14.7% of total
4-6 Nights
2 listings
5.9% of total
30+ Nights
5 listings
14.7% of total
Key Insights
- The most prevalent minimum stay requirement in Opmeer is 2 Nights, adopted by 61.8% of listings. This highlights the market's preference for shorter, flexible bookings.
- A strong majority (64.7%) of the Opmeer Airbnb data shows acceptance of very short stays (1-2 nights), indicating a dynamic, high-turnover market.
- A significant segment (14.7%) caters to monthly stays (30+ nights) in Opmeer, pointing to opportunities in the extended-stay market.
Recommendations
- Align with the market by considering a 2 Nights minimum stay, as 61.8% of Opmeer hosts use this setting.
- If feasible, allowing 1-night stays, especially midweek or during low season, could capture last-minute bookings, as only 2.9% currently do.
- A 2-night minimum appears standard (61.8%). Consider this for weekends or peak periods.
- Explore offering discounts for stays of 30+ nights to attract the 14.7% of the market seeking extended stays.
- Adjust minimum nights based on seasonality – potentially shorter during low season and longer during peak demand periods in Opmeer.
Opmeer Airbnb Cancellation Policy Trends Analysis (2025)
Super Strict 60 Days
1 listings
2.8% of total
Flexible
11 listings
30.6% of total
Moderate
13 listings
36.1% of total
Firm
5 listings
13.9% of total
Strict
6 listings
16.7% of total
Cancellation Policy Insights for Opmeer
- The prevailing Airbnb cancellation policy trend in Opmeer is Moderate, used by 36.1% of listings.
- There's a relatively balanced mix between guest-friendly (66.7%) and stricter (30.6%) policies, offering choices for different guest needs.
Recommendations for Hosts
- Consider adopting a Moderate policy to align with the 36.1% market standard in Opmeer.
- Regularly review your cancellation policy against competitors and market demand shifts in Opmeer.
Opmeer STR Booking Lead Time Analysis (2025)
Average Booking Lead Time by Month
Booking Lead Time Insights for Opmeer
- The overall average booking lead time for vacation rentals in Opmeer is 59 days.
- Guests book furthest in advance for stays during July (average 98 days), likely coinciding with peak travel demand or local events.
- The shortest booking windows occur for stays in March (average 33 days), indicating more last-minute travel plans during this time.
- Seasonally, Summer (82 days avg.) sees the longest lead times, while Winter (46 days avg.) has the shortest, reflecting typical travel planning cycles.
Recommendations for Hosts
- Use the overall average lead time (59 days) as a baseline for your pricing and availability strategy in Opmeer.
- For July stays, consider implementing length-of-stay discounts or slightly higher rates for bookings made less than 98 days out to capitalize on advance planning.
- Target marketing efforts for the Summer season well in advance (at least 82 days) to capture early planners.
- Monitor your own booking lead times against these Opmeer averages to identify opportunities for dynamic pricing adjustments.
Popular & Essential Airbnb Amenities in Opmeer (2025)
Amenity Prevalence
Amenity Insights for Opmeer
- Essential amenities in Opmeer that guests expect include: Free parking on premises. Lacking these (this) could significantly impact bookings.
- Popular amenities like Smoke alarm, Wifi, Heating are common but not universal. Offering these can provide a competitive edge.
- Warning: Wifi is not universally provided but is considered essential globally. Ensure reliable Wifi is offered.
Recommendations for Hosts
- Ensure your listing includes all essential amenities for Opmeer: Free parking on premises.
- Prioritize adding missing essentials: Free parking on premises.
- Consider adding popular differentiators like Smoke alarm or Wifi to increase appeal.
- Highlight unique or less common amenities you offer (e.g., hot tub, dedicated workspace, EV charger) in your listing description and photos.
- Regularly check competitor amenities in Opmeer to stay competitive.
Opmeer Airbnb Guest Demographics & Profile Analysis (2025)
Guest Profile Summary for Opmeer
- The typical guest profile for Airbnb in Opmeer consists of predominantly international visitors (81%), with top international origins including France, typically belonging to the Post-2000s (Gen Z/Alpha) group (50%), primarily speaking English or German.
- Domestic travelers account for 19.0% of guests.
- Key international markets include Germany (35%) and France (19.3%).
- Top languages spoken are English (36.6%) followed by German (22.6%).
- A significant demographic segment is the Post-2000s (Gen Z/Alpha) group, representing 50% of guests.
Recommendations for Hosts
- Focus marketing internationally, particularly towards travelers from France.
- Tailor amenities and listing descriptions to appeal to the dominant Post-2000s (Gen Z/Alpha) demographic (e.g., highlight fast WiFi, smart home features, local guides).
- Highlight unique local experiences or amenities relevant to the primary guest profile.
- Consider seasonal promotions aligned with peak travel times for key origin markets.
Nearby Short-Term Rental Market Comparison
How does the Opmeer Airbnb market stack up against its neighbors? Compare key performance metrics like average monthly revenue, ADR, and occupancy rates in surrounding areas to understand the broader regional STR landscape.
| Market | Active Properties | Monthly Revenue | Daily Rate | Avg. Occupancy |
|---|---|---|---|---|
| Kockengen | 12 | $7,560 | $396.31 | 61% |
| Bentveld | 13 | $4,798 | $443.61 | 54% |
| Halfweg | 17 | $4,307 | $231.13 | 55% |
| Aerdenhout | 17 | $4,288 | $694.02 | 53% |
| Merksplas | 10 | $3,885 | $256.59 | 44% |
| Oud Ade | 17 | $3,779 | $277.47 | 51% |
| Rijs | 27 | $3,772 | $356.97 | 45% |
| Zwanenburg | 24 | $3,720 | $240.77 | 66% |
| Kerkdriel | 25 | $3,607 | $323.16 | 40% |
| Brecht | 10 | $3,531 | $251.70 | 54% |