Noord-Scharwoude Airbnb Market Analysis 2025: Short Term Rental Data & Vacation Rental Statistics in North Holland, Netherlands
Is Airbnb profitable in Noord-Scharwoude in 2025? Explore comprehensive Airbnb analytics for Noord-Scharwoude, North Holland, Netherlands to uncover income potential. This 2025 STR market report for Noord-Scharwoude, based on AirROI data from April 2024 to March 2025, reveals key trends in the niche market of 18 active listings.
Whether you're considering an Airbnb investment in Noord-Scharwoude, optimizing your existing vacation rental, or exploring rental arbitrage opportunities, understanding the Noord-Scharwoude Airbnb data is crucial. Leveraging the low regulation environment is key to maximizing your short term rental income potential. Let's dive into the specifics.
Key Noord-Scharwoude Airbnb Performance Metrics Overview
Monthly Airbnb Revenue Variations & Income Potential in Noord-Scharwoude (2025)
Understanding the monthly revenue variations for Airbnb listings in Noord-Scharwoude is key to maximizing your short term rental income potential. Seasonality significantly impacts earnings. Our analysis, based on data from the past 12 months, shows that the peak revenue month for STRs in Noord-Scharwoude is typically April, while February often presents the lowest earnings, highlighting opportunities for strategic pricing adjustments during shoulder and low seasons. Explore the typical Airbnb income in Noord-Scharwoude across different performance tiers:
- Best-in-class properties (Top 10%) achieve $3,799+ monthly, often utilizing dynamic pricing and superior guest experiences.
- Strong performing properties (Top 25%) earn $3,343 or more, indicating effective management and desirable locations/amenities.
- Typical properties (Median) generate around $2,299 per month, representing the average market performance.
- Entry-level properties (Bottom 25%) see earnings around $1,608, often with potential for optimization.
Average Monthly Airbnb Earnings Trend in Noord-Scharwoude
Noord-Scharwoude Airbnb Occupancy Rate Trends (2025)
Maximize your bookings by understanding the Noord-Scharwoude STR occupancy trends. Seasonal demand shifts significantly influence how often properties are booked. Typically, Maysees the highest demand (peak season occupancy), while January experiences the lowest (low season). Effective strategies, like adjusting minimum stays or offering promotions, can boost occupancy during slower periods. Here's how different property tiers perform in Noord-Scharwoude:
- Best-in-class properties (Top 10%) achieve 35%+ occupancy, indicating high desirability and potentially optimized availability.
- Strong performing properties (Top 25%) maintain 28% or higher occupancy, suggesting good market fit and guest satisfaction.
- Typical properties (Median) have an occupancy rate around 15%.
- Entry-level properties (Bottom 25%) average 10% occupancy, potentially facing higher vacancy.
Average Monthly Occupancy Rate Trend in Noord-Scharwoude
Average Daily Rate (ADR) Airbnb Trends in Noord-Scharwoude (2025)
Effective short term rental pricing strategy in Noord-Scharwoude involves understanding monthly ADR fluctuations. The Average Daily Rate (ADR) for Airbnb in Noord-Scharwoude typically peaks in February and dips lowest during September. Leveraging Airbnb dynamic pricing tools or strategies based on this seasonality can significantly boost revenue. Here's a look at the typical nightly rates achieved:
- Best-in-class properties (Top 10%) command rates of $421+ per night, often due to premium features or locations.
- Strong performing properties (Top 25%) achieve nightly rates of $380 or more.
- Typical properties (Median) charge around $330 per night.
- Entry-level properties (Bottom 25%) earn around $279 per night.
Average Daily Rate (ADR) Trend by Month in Noord-Scharwoude
Get Live Noord-Scharwoude Market Intelligence 👇

Explore Real-time Analytics
Airbnb Seasonality Analysis & Trends in Noord-Scharwoude (2025)
Peak Season (April, May, June)
- Revenue averages $5,489 per month
- Occupancy rates average 29.6%
- Daily rates average $304
Shoulder Season
- Revenue averages $1,892 per month
- Occupancy maintains around 17.2%
- Daily rates hold near $307
Low Season (February, March, November)
- Revenue drops to average $250 per month
- Occupancy decreases to average 2.3%
- Daily rates adjust to average $345
Seasonality Insights for Noord-Scharwoude
- The Airbnb seasonality in Noord-Scharwoude shows highly seasonal trends requiring careful strategy. While the sections above show seasonal averages, it's also insightful to look at the extremes:
- During the high season, the absolute peak month showcases Noord-Scharwoude's highest earning potential, with monthly revenues capable of climbing to $6,319, occupancy reaching a high of 50.0%, and ADRs peaking at $350.
- Conversely, the slowest single month of the year, typically falling within the low season, marks the market's lowest point. In this month, revenue might dip to $0, occupancy could drop to 0.0%, and ADRs may adjust down to $277.
- Understanding both the seasonal averages and these monthly peaks and troughs in revenue, occupancy, and ADR is crucial for maximizing your Airbnb profit potential in Noord-Scharwoude.
Seasonal Strategies for Maximizing Profit
- Peak Season: Maximize revenue through premium pricing and potentially longer minimum stays. Ensure high availability.
- Low Season: Offer competitive pricing, special promotions (e.g., extended stay discounts), and flexible cancellation policies. Target off-season travelers like remote workers or budget-conscious guests.
- Shoulder Seasons: Implement dynamic pricing that balances peak and low rates. Target weekend travelers or specific events. Offer slightly more flexible terms than peak season.
- Regularly analyze your own performance against these Noord-Scharwoude seasonality benchmarks and adjust your pricing and availability strategy accordingly.
Best Areas for Airbnb Investment in Noord-Scharwoude (2025)
Exploring the top neighborhoods for short-term rentals in Noord-Scharwoude? This section highlights key areas, outlining why they are attractive for hosts and guests, along with notable local attractions. Consider these locations based on your target guest profile and investment strategy.
| Neighborhood / Area | Why Host Here? (Target Guests & Appeal) | Key Attractions & Landmarks |
|---|---|---|
| De Koog | A popular beach town on the island of Texel known for its stunning beaches and nature reserves. Ideal for tourists seeking outdoor activities and relaxation in a picturesque setting. | Texel National Park, Ecomare, De Koog Beach, Shipwreck and Beachcombing Museum, Texel Brewery |
| Utrecht | A vibrant city with a rich history, canals, and cultural events. Attracts both tourists and business travelers due to its central location in the Netherlands. | Dom Tower, Utrecht University, Rietveld Schröder House, Canals of Utrecht, Museum Speelklok |
| Alkmaar | Famous for its historical cheese market and charming old town, Alkmaar is a cultural gem attracting visitors interested in Dutch traditions and local cuisine. | Alkmaar Cheese Market, National Beer Museum, Grote Kerk, Stedelijk Museum Alkmaar, Windmill De Groot |
| Amsterdam | The capital city with iconic canals, museums, and vibrant nightlife. A top destination for international travelers seeking diverse experiences. | Rijksmuseum, Van Gogh Museum, Anne Frank House, Dam Square, Vondelpark |
| Haarlem | A historic city close to Amsterdam, known for its art, architecture, and the beautiful Haarlemse Hof. Offers a charming atmosphere for tourists. | Frans Hals Museum, Grote Markt, St. Bavo's Church, Teylers Museum, Haarlemmerhout |
| Zandvoort | A beach resort town known for its sandy beaches and proximity to the Zandvoort Circuit for motorsports. Attracts both sun-seekers and sports enthusiasts. | Zandvoort Beach, Circuit Zandvoort, Kennemer Duinen National Park, Zandvoort Museum, Beach clubs |
| Volendam | A picturesque fishing village known for its traditional wooden houses and rich maritime history. A must-visit for tourists exploring Dutch culture. | Volendam Museum, Cheese Factory Volendam, Fish Auction, Dijk van Volendam, Molen van Schermerhorn |
| Marken | A charming island village famous for its wooden houses and scenic views. It's a unique destination for visitors interested in traditional Dutch heritage. | Museum Marken, Lighthouse of Marken, Windmill De Bovenmeester, Marken Haven, Traditional wooden houses |
Understanding Airbnb License Requirements & STR Laws in Noord-Scharwoude (2025)
While Noord-Scharwoude, North Holland, Netherlands currently shows low STR regulations, specific Airbnb license requirements might still exist or change. Always verify the latest short term rental regulations and Airbnb license requirements directly with local government authorities for Noord-Scharwoude to ensure full compliance before hosting.
(Source: AirROI data, 2025, finding no licensed listings among those analyzed)
Top Performing Airbnb Properties in Noord-Scharwoude (2025)
Benchmark your potential! Explore examples of top-performing Airbnb properties in Noord-Scharwoudebased on Trailing Twelve Month (TTM) revenue. Analyze their characteristics, revenue, occupancy rate, and ADR to understand what drives success in this market.
Unique 4
Entire Place • 2 bedrooms
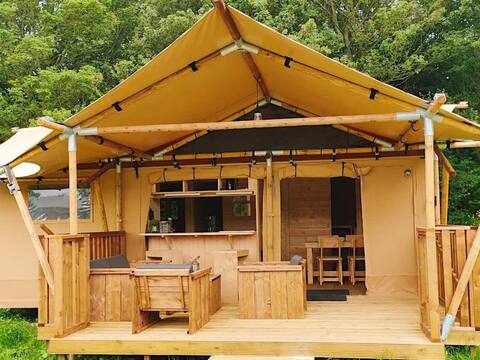
Nice tent with bathroom, near a recreation area
Entire Place • 2 bedrooms

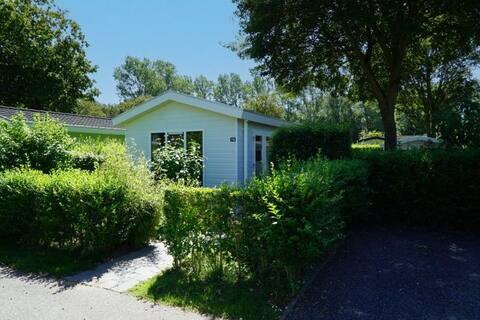
Nice chalet with dishwasher
Entire Place • 3 bedrooms
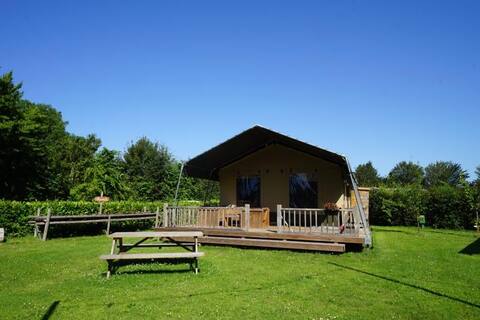
Safaritent 6
Entire Place • 2 bedrooms
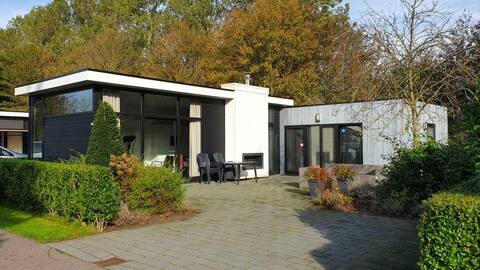
L-Cube 6
Entire Place • 3 bedrooms
Nice safari tent near recreation area
Entire Place • 2 bedrooms
Note: Performance varies based on location, size, amenities, seasonality, and management quality. Data reflects the past 12 months.
Top Performing Airbnb Hosts in Noord-Scharwoude (2025)
Learn from the best! This table showcases top-performing Airbnb hosts in Noord-Scharwoude based on the number of properties managed and estimated total revenue over the past year. Analyze their scale and performance metrics.
| Host Name | Properties | Grossing Revenue | Stay Reviews | Avg Rating |
|---|---|---|---|---|
| Host #124661153 | 9 | $69,321 | 4 | 0.00/5.0 |
| Host #387867368 | 9 | $67,900 | 5 | 0.56/5.0 |
Analyzing the strategies of top hosts, such as their property selection, pricing, and guest communication, can offer valuable lessons for optimizing your own Airbnb operations in Noord-Scharwoude.
Dive Deeper: Advanced Noord-Scharwoude STR Market Data (2025)
Ready to unlock more insights? AirROI provides access to advanced metrics and comprehensive Airbnb data for Noord-Scharwoude. Explore detailed analytics beyond this report to refine your investment strategy, optimize pricing, and maximize your vacation rental profits.
Explore Advanced MetricsNoord-Scharwoude Short-Term Rental Market Composition (2025): Property & Room Types
Room Type Distribution
Property Type Distribution
Market Composition Insights for Noord-Scharwoude
- The Noord-Scharwoude Airbnb market composition is heavily skewed towards Entire Home/Apt listings, which make up 100% of the 18 active rentals. This indicates strong guest preference for privacy and space.
- Looking at the property type distribution in Noord-Scharwoude, House properties are the most common (50%), reflecting the local real estate landscape.
- Houses represent a significant 50% portion, catering likely to families or larger groups.
Noord-Scharwoude Airbnb Room Capacity Analysis (2025): Bedroom Distribution
Distribution of Listings by Number of Bedrooms
Room Capacity Insights for Noord-Scharwoude
- The dominant room capacity in Noord-Scharwoude is 2 bedrooms listings, making up 72.2% of the market. This suggests a strong demand for properties suitable for couples or solo travelers.
- Together, 2 bedrooms and 3 bedrooms properties represent 88.9% of the active Airbnb listings in Noord-Scharwoude, indicating a high concentration in these sizes.
Noord-Scharwoude Vacation Rental Guest Capacity Trends (2025)
Distribution of Listings by Guest Capacity
Guest Capacity Insights for Noord-Scharwoude
- The most common guest capacity trend in Noord-Scharwoude vacation rentals is listings accommodating 4 guests (50%). This suggests the primary traveler segment is likely small families or groups.
- Properties designed for 4 guests and 6 guests dominate the Noord-Scharwoude STR market, accounting for 77.8% of listings.
- 27.8% of properties accommodate 6+ guests, serving the market segment for larger families or group travel in Noord-Scharwoude.
- On average, properties in Noord-Scharwoude are equipped to host 4.4 guests.
Noord-Scharwoude Airbnb Booking Patterns (2025): Available vs. Booked Days
Available Days Distribution
Booked Days Distribution
Booking Pattern Insights for Noord-Scharwoude
- The most common availability pattern in Noord-Scharwoude falls within the 271-366 days range, representing 94.4% of listings. This suggests many properties have significant open periods on their calendars.
- Approximately 100.0% of listings show high availability (181+ days open annually), indicating potential for increased bookings or specific owner usage patterns.
- For booked days, the 1-30 days range is most frequent in Noord-Scharwoude (72.2%), reflecting common guest stay durations or potential owner blocking patterns.
Noord-Scharwoude Airbnb Minimum Stay Requirements Analysis
Distribution of Listings by Minimum Night Requirement
1 Night
5 listings
100% of total
Key Insights
- The most prevalent minimum stay requirement in Noord-Scharwoude is 1 Night, adopted by 100% of listings. This highlights the market's preference for shorter, flexible bookings.
- A strong majority (100.0%) of the Noord-Scharwoude Airbnb data shows acceptance of very short stays (1-2 nights), indicating a dynamic, high-turnover market.
Recommendations
- Align with the market by considering a 1 Night minimum stay, as 100% of Noord-Scharwoude hosts use this setting.
- Adjust minimum nights based on seasonality – potentially shorter during low season and longer during peak demand periods in Noord-Scharwoude.
Noord-Scharwoude Airbnb Cancellation Policy Trends (2025)
Cancellation policy data is currently unavailable for Noord-Scharwoude.
Noord-Scharwoude STR Booking Lead Time Analysis (2025)
Average Booking Lead Time by Month
Booking Lead Time Insights for Noord-Scharwoude
- The overall average booking lead time for vacation rentals in Noord-Scharwoude is 32 days.
- Guests book furthest in advance for stays during January (average 42 days), likely coinciding with peak travel demand or local events.
- The shortest booking windows occur for stays in November (average 0 days), indicating more last-minute travel plans during this time.
- Seasonally, Winter (27 days avg.) sees the longest lead times, while Spring (0 days avg.) has the shortest, reflecting typical travel planning cycles.
Recommendations for Hosts
- Use the overall average lead time (32 days) as a baseline for your pricing and availability strategy in Noord-Scharwoude.
- During November, focus on last-minute booking availability and promotions, as guests book with very short notice (0 days avg.).
- Target marketing efforts for the Winter season well in advance (at least 27 days) to capture early planners.
- Monitor your own booking lead times against these Noord-Scharwoude averages to identify opportunities for dynamic pricing adjustments.
Popular & Essential Airbnb Amenities in Noord-Scharwoude (2025)
Amenity Prevalence
No amenities with partial availability (less than 100%) were found to display in the chart. All essential amenities might be present in all listings. Check insights below.
Amenity Insights for Noord-Scharwoude
- Essential amenities in Noord-Scharwoude that guests expect include: Carbon monoxide alarm, Kitchen, Wifi, Private entrance, Washer, Dryer, Essentials, Smoke alarm, Coffee maker, TV. Lacking these (any) could significantly impact bookings.
Recommendations for Hosts
- Ensure your listing includes all essential amenities for Noord-Scharwoude: Carbon monoxide alarm, Kitchen, Wifi, Private entrance, Washer, Dryer, Essentials, Smoke alarm, Coffee maker, TV.
- Highlight unique or less common amenities you offer (e.g., hot tub, dedicated workspace, EV charger) in your listing description and photos.
- Regularly check competitor amenities in Noord-Scharwoude to stay competitive.
Noord-Scharwoude Airbnb Guest Demographics & Profile Analysis (2025)
Guest Profile Summary for Noord-Scharwoude
- The typical guest profile for Airbnb in Noord-Scharwoude consists of predominantly international visitors (80%), with top international origins including France, typically belonging to the Post-2000s (Gen Z/Alpha) group (50%), primarily speaking English or German.
- Domestic travelers account for 20.0% of guests.
- Key international markets include Germany (50%) and France (20%).
- Top languages spoken are English (33.3%) followed by German (25%).
- A significant demographic segment is the Post-2000s (Gen Z/Alpha) group, representing 50% of guests.
Recommendations for Hosts
- Focus marketing internationally, particularly towards travelers from France.
- Tailor amenities and listing descriptions to appeal to the dominant Post-2000s (Gen Z/Alpha) demographic (e.g., highlight fast WiFi, smart home features, local guides).
- Highlight unique local experiences or amenities relevant to the primary guest profile.
- Consider seasonal promotions aligned with peak travel times for key origin markets.
Nearby Short-Term Rental Market Comparison
How does the Noord-Scharwoude Airbnb market stack up against its neighbors? Compare key performance metrics like average monthly revenue, ADR, and occupancy rates in surrounding areas to understand the broader regional STR landscape.
| Market | Active Properties | Monthly Revenue | Daily Rate | Avg. Occupancy |
|---|---|---|---|---|
| Kockengen | 12 | $7,560 | $396.31 | 61% |
| Bentveld | 13 | $4,798 | $443.61 | 54% |
| Halfweg | 17 | $4,307 | $231.13 | 55% |
| Aerdenhout | 17 | $4,288 | $694.02 | 53% |
| Merksplas | 10 | $3,885 | $256.59 | 44% |
| Oud Ade | 17 | $3,779 | $277.47 | 51% |
| Rijs | 27 | $3,772 | $356.97 | 45% |
| Zwanenburg | 24 | $3,720 | $240.77 | 66% |
| Kerkdriel | 25 | $3,607 | $323.16 | 40% |
| Brecht | 10 | $3,531 | $251.70 | 54% |