Heemstede Airbnb Market Analysis 2025: Short Term Rental Data & Vacation Rental Statistics in North Holland, Netherlands
Is Airbnb profitable in Heemstede in 2025? Explore comprehensive Airbnb analytics for Heemstede, North Holland, Netherlands to uncover income potential. This 2025 STR market report for Heemstede, based on AirROI data from April 2024 to March 2025, reveals key trends in the niche market of 82 active listings.
Whether you're considering an Airbnb investment in Heemstede, optimizing your existing vacation rental, or exploring rental arbitrage opportunities, understanding the Heemstede Airbnb data is crucial. Leveraging the low regulation environment is key to maximizing your short term rental income potential. Let's dive into the specifics.
Key Heemstede Airbnb Performance Metrics Overview
Monthly Airbnb Revenue Variations & Income Potential in Heemstede (2025)
Understanding the monthly revenue variations for Airbnb listings in Heemstede is key to maximizing your short term rental income potential. Seasonality significantly impacts earnings. Our analysis, based on data from the past 12 months, shows that the peak revenue month for STRs in Heemstede is typically July, while February often presents the lowest earnings, highlighting opportunities for strategic pricing adjustments during shoulder and low seasons. Explore the typical Airbnb income in Heemstede across different performance tiers:
- Best-in-class properties (Top 10%) achieve $8,946+ monthly, often utilizing dynamic pricing and superior guest experiences.
- Strong performing properties (Top 25%) earn $6,071 or more, indicating effective management and desirable locations/amenities.
- Typical properties (Median) generate around $3,455 per month, representing the average market performance.
- Entry-level properties (Bottom 25%) see earnings around $1,630, often with potential for optimization.
Average Monthly Airbnb Earnings Trend in Heemstede
Heemstede Airbnb Occupancy Rate Trends (2025)
Maximize your bookings by understanding the Heemstede STR occupancy trends. Seasonal demand shifts significantly influence how often properties are booked. Typically, Julysees the highest demand (peak season occupancy), while March experiences the lowest (low season). Effective strategies, like adjusting minimum stays or offering promotions, can boost occupancy during slower periods. Here's how different property tiers perform in Heemstede:
- Best-in-class properties (Top 10%) achieve 87%+ occupancy, indicating high desirability and potentially optimized availability.
- Strong performing properties (Top 25%) maintain 74% or higher occupancy, suggesting good market fit and guest satisfaction.
- Typical properties (Median) have an occupancy rate around 53%.
- Entry-level properties (Bottom 25%) average 30% occupancy, potentially facing higher vacancy.
Average Monthly Occupancy Rate Trend in Heemstede
Average Daily Rate (ADR) Airbnb Trends in Heemstede (2025)
Effective short term rental pricing strategy in Heemstede involves understanding monthly ADR fluctuations. The Average Daily Rate (ADR) for Airbnb in Heemstede typically peaks in August and dips lowest during April. Leveraging Airbnb dynamic pricing tools or strategies based on this seasonality can significantly boost revenue. Here's a look at the typical nightly rates achieved:
- Best-in-class properties (Top 10%) command rates of $463+ per night, often due to premium features or locations.
- Strong performing properties (Top 25%) achieve nightly rates of $345 or more.
- Typical properties (Median) charge around $260 per night.
- Entry-level properties (Bottom 25%) earn around $175 per night.
Average Daily Rate (ADR) Trend by Month in Heemstede
Get Live Heemstede Market Intelligence 👇

Explore Real-time Analytics
Airbnb Seasonality Analysis & Trends in Heemstede (2025)
Peak Season (July, August, September)
- Revenue averages $5,947 per month
- Occupancy rates average 63.2%
- Daily rates average $283
Shoulder Season
- Revenue averages $4,437 per month
- Occupancy maintains around 54.5%
- Daily rates hold near $280
Low Season (January, February, March)
- Revenue drops to average $1,949 per month
- Occupancy decreases to average 31.7%
- Daily rates adjust to average $283
Seasonality Insights for Heemstede
- The Airbnb seasonality in Heemstede shows highly seasonal trends requiring careful strategy. While the sections above show seasonal averages, it's also insightful to look at the extremes:
- During the high season, the absolute peak month showcases Heemstede's highest earning potential, with monthly revenues capable of climbing to $6,900, occupancy reaching a high of 74.3%, and ADRs peaking at $285.
- Conversely, the slowest single month of the year, typically falling within the low season, marks the market's lowest point. In this month, revenue might dip to $1,297, occupancy could drop to 25.2%, and ADRs may adjust down to $275.
- Understanding both the seasonal averages and these monthly peaks and troughs in revenue, occupancy, and ADR is crucial for maximizing your Airbnb profit potential in Heemstede.
Seasonal Strategies for Maximizing Profit
- Peak Season: Maximize revenue through premium pricing and potentially longer minimum stays. Ensure high availability.
- Low Season: Offer competitive pricing, special promotions (e.g., extended stay discounts), and flexible cancellation policies. Target off-season travelers like remote workers or budget-conscious guests.
- Shoulder Seasons: Implement dynamic pricing that balances peak and low rates. Target weekend travelers or specific events. Offer slightly more flexible terms than peak season.
- Regularly analyze your own performance against these Heemstede seasonality benchmarks and adjust your pricing and availability strategy accordingly.
Best Areas for Airbnb Investment in Heemstede (2025)
Exploring the top neighborhoods for short-term rentals in Heemstede? This section highlights key areas, outlining why they are attractive for hosts and guests, along with notable local attractions. Consider these locations based on your target guest profile and investment strategy.
| Neighborhood / Area | Why Host Here? (Target Guests & Appeal) | Key Attractions & Landmarks |
|---|---|---|
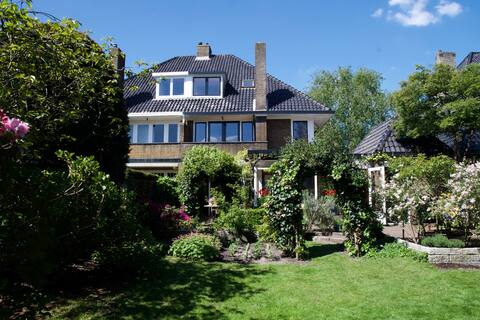
| Center Heemstede | A vibrant area with a mix of shops, restaurants, and local cafes. It’s the heart of Heemstede, making it attractive for visitors who want to be close to amenities and public transport. | Heemstede Town Center, Haarlemmermeer Forest, Historic Buildings, Local Markets, Shopping District |
| Heemstede Aerdenhout | An upscale neighborhood known for its spacious homes and green surroundings. Ideal for families and those seeking a quiet retreat while remaining close to the city. | Aerdenhout Park, Duinrell Amusement Park, Local Nature Trails, Café's, Stately Homes |
| Cultural Quarter | Home to several art galleries and cultural events, this area attracts art lovers and tourists looking for creative experiences. | Museum Haarlem, St. Bavo Cathedral, Weekly Art Fairs, Local Art Studios, Cultural Festivals |
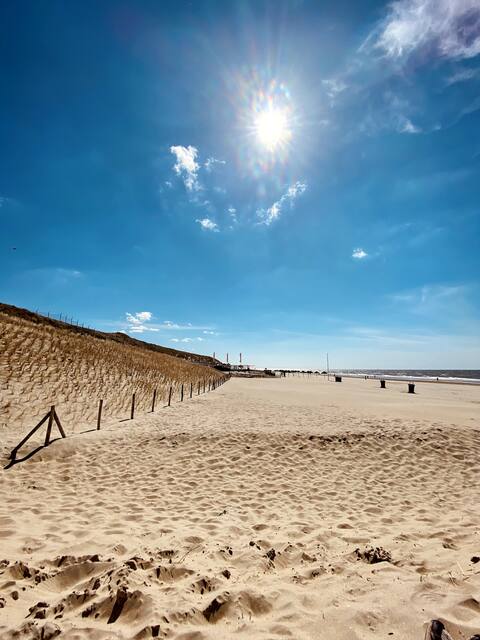
| Near Bloemendaal | Close to the Bloemendaal beach, this area is perfect for sun seekers and beach lovers. It provides a great mix of beach and nature. | Bloemendaal Beach, Kennemer Dunes National Park, Beach Clubs, Water Sports, Scenic Bike Trails |
| Heemsteedse Dunes | A beautiful natural area with dunes and walking trails, appealing to nature lovers and outdoor enthusiasts. | Heemsteedse Dunes Nature Reserve, Beautiful Trails, Wildlife Watching, Picnic Areas, Scenic Views |
| Historic Heemstede | Rich in history, this area features many historical sites and buildings, attracting history buffs and travelers interested in heritage. | Historic Town Hall, Old Churches, Historic Homes, Local Heritage Sites, Guided Tours |
| Shopping District | A bustling area filled with shops, boutiques, and restaurants. Ideal for visitors who love shopping and dining out. | Local Boutiques, Major Retail Chains, Restaurants, Cafes, Market Days |
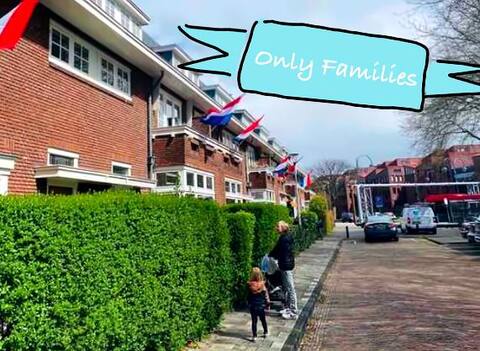
| Family Friendly Areas | Offering parks and playgrounds, this area is perfect for families traveling with children. It has recreational facilities and safe neighborhoods. | Children's Parks, Family-Friendly Cafes, Local Events, Community Centers, Sports Fields |
Understanding Airbnb License Requirements & STR Laws in Heemstede (2025)
While Heemstede, North Holland, Netherlands currently shows low STR regulations, specific Airbnb license requirements might still exist or change. Always verify the latest short term rental regulations and Airbnb license requirements directly with local government authorities for Heemstede to ensure full compliance before hosting.
(Source: AirROI data, 2025, based on 2% licensed listings)
Top Performing Airbnb Properties in Heemstede (2025)
Benchmark your potential! Explore examples of top-performing Airbnb properties in Heemstedebased on Trailing Twelve Month (TTM) revenue. Analyze their characteristics, revenue, occupancy rate, and ADR to understand what drives success in this market.
CLASSIC HOME: Oasis near Amsterdam, beach + bikes
Entire Place • 5 bedrooms
Idyllic family house close to beach/Haarlem/A'dam.
Entire Place • 3 bedrooms

Spacious family home near Amsterdam & beach
Entire Place • 5 bedrooms
Spacious family house close to Amsterdam & Beach
Entire Place • 5 bedrooms

Wonderful familyhouse (Close to A’dam&Beach)
Entire Place • 4 bedrooms

House close to Amsterdam and Zandvoort
Entire Place • 3 bedrooms
Note: Performance varies based on location, size, amenities, seasonality, and management quality. Data reflects the past 12 months.
Top Performing Airbnb Hosts in Heemstede (2025)
Learn from the best! This table showcases top-performing Airbnb hosts in Heemstede based on the number of properties managed and estimated total revenue over the past year. Analyze their scale and performance metrics.
| Host Name | Properties | Grossing Revenue | Stay Reviews | Avg Rating |
|---|---|---|---|---|
| Nanda | 2 | $144,966 | 262 | 4.92/5.0 |
| Pamela | 1 | $86,756 | 4 | 5.00/5.0 |
| Lonneke | 1 | $83,235 | 21 | 5.00/5.0 |
| Pieter-Bas | 1 | $82,100 | 39 | 4.67/5.0 |
| Jan-Kees | 1 | $81,620 | 13 | 4.92/5.0 |
| Bernice | 3 | $71,299 | 218 | 4.89/5.0 |
| Arthur | 1 | $70,276 | 20 | 4.95/5.0 |
| Anke & Jurriaan | 1 | $67,792 | 10 | 4.80/5.0 |
| Bart | 1 | $66,200 | 32 | 4.94/5.0 |
| Petra | 1 | $61,868 | 51 | 4.86/5.0 |
Analyzing the strategies of top hosts, such as their property selection, pricing, and guest communication, can offer valuable lessons for optimizing your own Airbnb operations in Heemstede.
Dive Deeper: Advanced Heemstede STR Market Data (2025)
Ready to unlock more insights? AirROI provides access to advanced metrics and comprehensive Airbnb data for Heemstede. Explore detailed analytics beyond this report to refine your investment strategy, optimize pricing, and maximize your vacation rental profits.
Explore Advanced MetricsHeemstede Short-Term Rental Market Composition (2025): Property & Room Types
Room Type Distribution
Property Type Distribution
Market Composition Insights for Heemstede
- The Heemstede Airbnb market composition is heavily skewed towards Entire Home/Apt listings, which make up 92.7% of the 82 active rentals. This indicates strong guest preference for privacy and space.
- Looking at the property type distribution in Heemstede, House properties are the most common (90.2%), reflecting the local real estate landscape.
- Houses represent a significant 90.2% portion, catering likely to families or larger groups.
- Smaller segments like hotel/boutique, apartment/condo, others (combined 9.8%) offer potential for unique stay experiences.
Heemstede Airbnb Room Capacity Analysis (2025): Bedroom Distribution
Distribution of Listings by Number of Bedrooms
Room Capacity Insights for Heemstede
- The dominant room capacity in Heemstede is 4 bedrooms listings, making up 34.1% of the market. This suggests a strong demand for properties suitable for families or small groups.
- Together, 4 bedrooms and 3 bedrooms properties represent 59.7% of the active Airbnb listings in Heemstede, indicating a high concentration in these sizes.
- A significant 71.9% of listings offer 3+ bedrooms, catering to larger groups and families seeking more space in Heemstede.
Heemstede Vacation Rental Guest Capacity Trends (2025)
Distribution of Listings by Guest Capacity
Guest Capacity Insights for Heemstede
- The most common guest capacity trend in Heemstede vacation rentals is listings accommodating 6 guests (37.8%). This suggests the primary traveler segment is likely larger groups.
- Properties designed for 6 guests and 5 guests dominate the Heemstede STR market, accounting for 56.1% of listings.
- 53.6% of properties accommodate 6+ guests, serving the market segment for larger families or group travel in Heemstede.
- On average, properties in Heemstede are equipped to host 5.1 guests.
Heemstede Airbnb Booking Patterns (2025): Available vs. Booked Days
Available Days Distribution
Booked Days Distribution
Booking Pattern Insights for Heemstede
- The most common availability pattern in Heemstede falls within the 271-366 days range, representing 48.8% of listings. This suggests many properties have significant open periods on their calendars.
- Approximately 81.7% of listings show high availability (181+ days open annually), indicating potential for increased bookings or specific owner usage patterns.
- For booked days, the 31-90 days range is most frequent in Heemstede (37.8%), reflecting common guest stay durations or potential owner blocking patterns.
- A notable 19.5% of properties secure long booking periods (181+ days booked per year), highlighting successful long-term rental strategies or significant owner usage.
Heemstede Airbnb Minimum Stay Requirements Analysis
Distribution of Listings by Minimum Night Requirement
1 Night
3 listings
3.8% of total
2 Nights
12 listings
15% of total
3 Nights
16 listings
20% of total
4-6 Nights
31 listings
38.8% of total
7-29 Nights
13 listings
16.3% of total
30+ Nights
5 listings
6.3% of total
Key Insights
- The most prevalent minimum stay requirement in Heemstede is 4-6 Nights, adopted by 38.8% of listings. This highlights the market's preference for longer commitments.
- Very short stays (1-2 nights) are less common (18.8%), suggesting hosts prefer slightly longer bookings to optimize turnover.
Recommendations
- Align with the market by considering a 4-6 Nights minimum stay, as 38.8% of Heemstede hosts use this setting.
- If feasible, allowing 1-night stays, especially midweek or during low season, could capture last-minute bookings, as only 3.8% currently do.
- Explore offering discounts for stays of 30+ nights to attract the 6.3% of the market seeking extended stays.
- Adjust minimum nights based on seasonality – potentially shorter during low season and longer during peak demand periods in Heemstede.
Heemstede Airbnb Cancellation Policy Trends Analysis (2025)
Flexible
10 listings
13.2% of total
Moderate
22 listings
28.9% of total
Firm
24 listings
31.6% of total
Strict
20 listings
26.3% of total
Cancellation Policy Insights for Heemstede
- The prevailing Airbnb cancellation policy trend in Heemstede is Firm, used by 31.6% of listings.
- A majority (57.9%) of hosts in Heemstede utilize Firm or Strict policies, indicating a market where hosts prioritize booking security.
Recommendations for Hosts
- Consider adopting a Firm policy to align with the 31.6% market standard in Heemstede.
- Regularly review your cancellation policy against competitors and market demand shifts in Heemstede.
Heemstede STR Booking Lead Time Analysis (2025)
Average Booking Lead Time by Month
Booking Lead Time Insights for Heemstede
- The overall average booking lead time for vacation rentals in Heemstede is 92 days.
- Guests book furthest in advance for stays during July (average 125 days), likely coinciding with peak travel demand or local events.
- The shortest booking windows occur for stays in March (average 59 days), indicating more last-minute travel plans during this time.
- Seasonally, Summer (113 days avg.) sees the longest lead times, while Winter (72 days avg.) has the shortest, reflecting typical travel planning cycles.
Recommendations for Hosts
- Use the overall average lead time (92 days) as a baseline for your pricing and availability strategy in Heemstede.
- For July stays, consider implementing length-of-stay discounts or slightly higher rates for bookings made less than 125 days out to capitalize on advance planning.
- Target marketing efforts for the Summer season well in advance (at least 113 days) to capture early planners.
- Monitor your own booking lead times against these Heemstede averages to identify opportunities for dynamic pricing adjustments.
Popular & Essential Airbnb Amenities in Heemstede (2025)
Amenity Prevalence
Amenity Insights for Heemstede
- Essential amenities in Heemstede that guests expect include: Wifi, Heating. Lacking these (any) could significantly impact bookings.
- Popular amenities like Smoke alarm, Essentials, TV are common but not universal. Offering these can provide a competitive edge.
Recommendations for Hosts
- Ensure your listing includes all essential amenities for Heemstede: Wifi, Heating.
- Prioritize adding missing essentials: Heating.
- Consider adding popular differentiators like Smoke alarm or Essentials to increase appeal.
- Highlight unique or less common amenities you offer (e.g., hot tub, dedicated workspace, EV charger) in your listing description and photos.
- Regularly check competitor amenities in Heemstede to stay competitive.
Heemstede Airbnb Guest Demographics & Profile Analysis (2025)
Guest Profile Summary for Heemstede
- The typical guest profile for Airbnb in Heemstede consists of predominantly international visitors (95%), with top international origins including United States, typically belonging to the Post-2000s (Gen Z/Alpha) group (50%), primarily speaking English or German.
- Domestic travelers account for 5.2% of guests.
- Key international markets include Germany (22.8%) and United States (18.5%).
- Top languages spoken are English (44.4%) followed by German (19.7%).
- A significant demographic segment is the Post-2000s (Gen Z/Alpha) group, representing 50% of guests.
Recommendations for Hosts
- Focus marketing internationally, particularly towards travelers from United States.
- Tailor amenities and listing descriptions to appeal to the dominant Post-2000s (Gen Z/Alpha) demographic (e.g., highlight fast WiFi, smart home features, local guides).
- Highlight unique local experiences or amenities relevant to the primary guest profile.
- Consider seasonal promotions aligned with peak travel times for key origin markets.
Nearby Short-Term Rental Market Comparison
How does the Heemstede Airbnb market stack up against its neighbors? Compare key performance metrics like average monthly revenue, ADR, and occupancy rates in surrounding areas to understand the broader regional STR landscape.
| Market | Active Properties | Monthly Revenue | Daily Rate | Avg. Occupancy |
|---|---|---|---|---|
| Kockengen | 12 | $7,560 | $396.31 | 61% |
| Bentveld | 13 | $4,798 | $443.61 | 54% |
| Halfweg | 17 | $4,307 | $231.13 | 55% |
| Aerdenhout | 17 | $4,288 | $694.02 | 53% |
| Merksplas | 10 | $3,885 | $256.59 | 44% |
| Oud Ade | 17 | $3,779 | $277.47 | 51% |
| Rijs | 27 | $3,772 | $356.97 | 45% |
| Zwanenburg | 24 | $3,720 | $240.77 | 66% |
| Kerkdriel | 25 | $3,607 | $323.16 | 40% |
| Brecht | 10 | $3,531 | $251.70 | 54% |