Den Hoorn Airbnb Market Analysis 2025: Short Term Rental Data & Vacation Rental Statistics in North Holland, Netherlands
Is Airbnb profitable in Den Hoorn in 2025? Explore comprehensive Airbnb analytics for Den Hoorn, North Holland, Netherlands to uncover income potential. This 2025 STR market report for Den Hoorn, based on AirROI data from April 2024 to March 2025, reveals key trends in the niche market of 39 active listings.
Whether you're considering an Airbnb investment in Den Hoorn, optimizing your existing vacation rental, or exploring rental arbitrage opportunities, understanding the Den Hoorn Airbnb data is crucial. Navigating the high regulation landscape is key to maximizing your short term rental income potential. Let's dive into the specifics.
Key Den Hoorn Airbnb Performance Metrics Overview
Monthly Airbnb Revenue Variations & Income Potential in Den Hoorn (2025)
Understanding the monthly revenue variations for Airbnb listings in Den Hoorn is key to maximizing your short term rental income potential. Seasonality significantly impacts earnings. Our analysis, based on data from the past 12 months, shows that the peak revenue month for STRs in Den Hoorn is typically May, while February often presents the lowest earnings, highlighting opportunities for strategic pricing adjustments during shoulder and low seasons. Explore the typical Airbnb income in Den Hoorn across different performance tiers:
- Best-in-class properties (Top 10%) achieve $4,034+ monthly, often utilizing dynamic pricing and superior guest experiences.
- Strong performing properties (Top 25%) earn $2,910 or more, indicating effective management and desirable locations/amenities.
- Typical properties (Median) generate around $2,025 per month, representing the average market performance.
- Entry-level properties (Bottom 25%) see earnings around $1,281, often with potential for optimization.
Average Monthly Airbnb Earnings Trend in Den Hoorn
Den Hoorn Airbnb Occupancy Rate Trends (2025)
Maximize your bookings by understanding the Den Hoorn STR occupancy trends. Seasonal demand shifts significantly influence how often properties are booked. Typically, Augustsees the highest demand (peak season occupancy), while January experiences the lowest (low season). Effective strategies, like adjusting minimum stays or offering promotions, can boost occupancy during slower periods. Here's how different property tiers perform in Den Hoorn:
- Best-in-class properties (Top 10%) achieve 78%+ occupancy, indicating high desirability and potentially optimized availability.
- Strong performing properties (Top 25%) maintain 66% or higher occupancy, suggesting good market fit and guest satisfaction.
- Typical properties (Median) have an occupancy rate around 50%.
- Entry-level properties (Bottom 25%) average 31% occupancy, potentially facing higher vacancy.
Average Monthly Occupancy Rate Trend in Den Hoorn
Average Daily Rate (ADR) Airbnb Trends in Den Hoorn (2025)
Effective short term rental pricing strategy in Den Hoorn involves understanding monthly ADR fluctuations. The Average Daily Rate (ADR) for Airbnb in Den Hoorn typically peaks in July and dips lowest during January. Leveraging Airbnb dynamic pricing tools or strategies based on this seasonality can significantly boost revenue. Here's a look at the typical nightly rates achieved:
- Best-in-class properties (Top 10%) command rates of $238+ per night, often due to premium features or locations.
- Strong performing properties (Top 25%) achieve nightly rates of $149 or more.
- Typical properties (Median) charge around $119 per night.
- Entry-level properties (Bottom 25%) earn around $101 per night.
Average Daily Rate (ADR) Trend by Month in Den Hoorn
Get Live Den Hoorn Market Intelligence 👇

Explore Real-time Analytics
Airbnb Seasonality Analysis & Trends in Den Hoorn (2025)
Peak Season (May, August, July)
- Revenue averages $3,285 per month
- Occupancy rates average 71.4%
- Daily rates average $141
Shoulder Season
- Revenue averages $2,369 per month
- Occupancy maintains around 49.9%
- Daily rates hold near $138
Low Season (January, February, March)
- Revenue drops to average $1,062 per month
- Occupancy decreases to average 26.1%
- Daily rates adjust to average $130
Seasonality Insights for Den Hoorn
- The Airbnb seasonality in Den Hoorn shows highly seasonal trends requiring careful strategy. While the sections above show seasonal averages, it's also insightful to look at the extremes:
- During the high season, the absolute peak month showcases Den Hoorn's highest earning potential, with monthly revenues capable of climbing to $3,299, occupancy reaching a high of 74.8%, and ADRs peaking at $142.
- Conversely, the slowest single month of the year, typically falling within the low season, marks the market's lowest point. In this month, revenue might dip to $957, occupancy could drop to 23.4%, and ADRs may adjust down to $128.
- Understanding both the seasonal averages and these monthly peaks and troughs in revenue, occupancy, and ADR is crucial for maximizing your Airbnb profit potential in Den Hoorn.
Seasonal Strategies for Maximizing Profit
- Peak Season: Maximize revenue through premium pricing and potentially longer minimum stays. Ensure high availability.
- Low Season: Offer competitive pricing, special promotions (e.g., extended stay discounts), and flexible cancellation policies. Target off-season travelers like remote workers or budget-conscious guests.
- Shoulder Seasons: Implement dynamic pricing that balances peak and low rates. Target weekend travelers or specific events. Offer slightly more flexible terms than peak season.
- Regularly analyze your own performance against these Den Hoorn seasonality benchmarks and adjust your pricing and availability strategy accordingly.
Best Areas for Airbnb Investment in Den Hoorn (2025)
Exploring the top neighborhoods for short-term rentals in Den Hoorn? This section highlights key areas, outlining why they are attractive for hosts and guests, along with notable local attractions. Consider these locations based on your target guest profile and investment strategy.
| Neighborhood / Area | Why Host Here? (Target Guests & Appeal) | Key Attractions & Landmarks |
|---|---|---|
| Den Hoorn Village | A quaint and picturesque village atmosphere, Den Hoorn offers a peaceful retreat close to nature while being just a short drive from the larger cities. Ideal for travelers seeking tranquility and a taste of Dutch country life. | De Hoornse Kerk, Nature reserves, Local farms, Cycling routes |
| Zandvoort | Located nearby, Zandvoort features beautiful beaches and is popular during summer months. Its vibrant beach scene attracts both families and partygoers. | Zandvoort Beach, Circuit Park Zandvoort, Beach clubs, Sand Dunes National Park |
| Amsterdam | As the capital city, Amsterdam attracts millions of visitors for its rich culture, museums, and vibrant nightlife. It's highly desirable for short-term rentals due to consistent tourist traffic. | Rijksmuseum, Van Gogh Museum, Amsterdam Canal Ring, Dam Square, Anne Frank House |
| Noordwijk | This seaside town is known for its stunning beaches and is a favored spot for both tourists and wellness retreats, providing ample opportunities for hosting vacation rentals. | Noordwijk Beach, Keukenhof Gardens, Space Expo, Bicycle paths |
| Haarlem | Haarlem is a charming city with a vibrant arts scene and historical architecture, offering a unique experience away from Amsterdam’s hustle and bustle. | Frans Hals Museum, Haarlem's historic center, Teylers Museum, St. Bavo's Cathedral |
| Bloemendaal | Known for its beautiful beaches and upscale atmosphere, Bloemendaal attracts tourists looking for a luxurious beach getaway with an array of beach clubs and activities. | Bloemendaal Beach, Beach restaurants, Dunes of Bloemendaal, Kruidige Plantenhuis |
| Leiden | Rich in history and academia, Leiden offers a unique cultural experience with its university, museums, and picturesque canals, making it an attractive location for visitors. | Leiden University, National Museum of Antiquities, Botanical Gardens, The Olde Dutch Windmill |
| Schiphol | The proximity to Amsterdam's international airport makes this area convenient for business travelers and layover tourists seeking quick accommodation options. | Amsterdam Airport Schiphol, Nearby dining options, Transportation links to Amsterdam |
Understanding Airbnb License Requirements & STR Laws in Den Hoorn (2025)
Yes, Den Hoorn, North Holland, Netherlands enforces high STR regulations. Obtaining a license and ensuring compliance is almost certainly required according to current 2025 STR laws. Always verify the latest short term rental regulations and Airbnb license requirements directly with local government authorities for Den Hoorn to ensure full compliance before hosting.
(Source: AirROI data, 2025, based on 87% licensed listings)
Top Performing Airbnb Properties in Den Hoorn (2025)
Benchmark your potential! Explore examples of top-performing Airbnb properties in Den Hoornbased on Trailing Twelve Month (TTM) revenue. Analyze their characteristics, revenue, occupancy rate, and ADR to understand what drives success in this market.
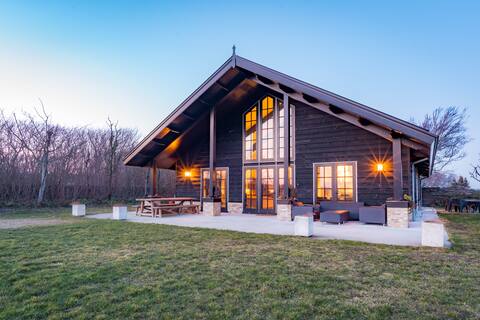
Holiday home Heidehof
Entire Place • 3 bedrooms
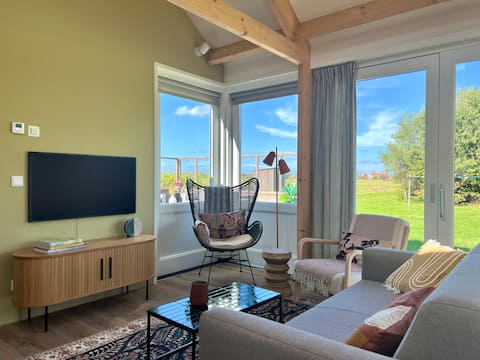
Holiday home 't Veldje
Entire Place • 3 bedrooms
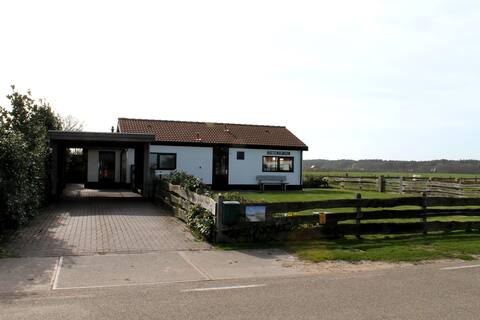
extraordinary
Entire Place • 2 bedrooms

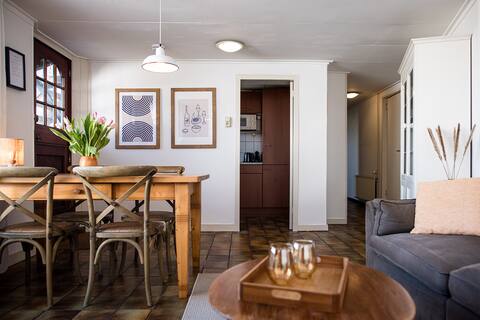
Golden Place Bed and Bike and tranquility and much more
Entire Place • 2 bedrooms

Chic by the Sea | Luxury Suite
Private Room • 1 bedroom
Diek 27 - Farmhouse Appartment 1
Entire Place • 2 bedrooms
Note: Performance varies based on location, size, amenities, seasonality, and management quality. Data reflects the past 12 months.
Top Performing Airbnb Hosts in Den Hoorn (2025)
Learn from the best! This table showcases top-performing Airbnb hosts in Den Hoorn based on the number of properties managed and estimated total revenue over the past year. Analyze their scale and performance metrics.
| Host Name | Properties | Grossing Revenue | Stay Reviews | Avg Rating |
|---|---|---|---|---|
| Marianne | 5 | $113,554 | 472 | 4.90/5.0 |
| Chrisey | 4 | $100,043 | 87 | 4.46/5.0 |
| Bart | 1 | $68,677 | 103 | 4.96/5.0 |
| Danielle | 2 | $65,191 | 128 | 4.93/5.0 |
| Bea | 2 | $51,848 | 272 | 4.93/5.0 |
| Rob | 2 | $50,188 | 8 | 4.50/5.0 |
| Isa | 1 | $39,993 | 49 | 4.80/5.0 |
| Sandra | 2 | $39,639 | 40 | 4.80/5.0 |
| Teuntje | 1 | $38,816 | 74 | 4.74/5.0 |
| Petruska | 2 | $37,937 | 219 | 4.73/5.0 |
Analyzing the strategies of top hosts, such as their property selection, pricing, and guest communication, can offer valuable lessons for optimizing your own Airbnb operations in Den Hoorn.
Dive Deeper: Advanced Den Hoorn STR Market Data (2025)
Ready to unlock more insights? AirROI provides access to advanced metrics and comprehensive Airbnb data for Den Hoorn. Explore detailed analytics beyond this report to refine your investment strategy, optimize pricing, and maximize your vacation rental profits.
Explore Advanced MetricsDen Hoorn Short-Term Rental Market Composition (2025): Property & Room Types
Room Type Distribution
Property Type Distribution
Market Composition Insights for Den Hoorn
- The Den Hoorn Airbnb market composition is heavily skewed towards Entire Home/Apt listings, which make up 66.7% of the 39 active rentals. This indicates strong guest preference for privacy and space.
- However, a notable 33.3% share for Private Rooms suggests opportunities for budget-conscious travelers or hosts renting out spare rooms.
- Looking at the property type distribution in Den Hoorn, House properties are the most common (33.3%), reflecting the local real estate landscape.
- Houses represent a significant 33.3% portion, catering likely to families or larger groups.
- The presence of 30.8% Hotel/Boutique listings indicates integration with traditional hospitality.
Den Hoorn Airbnb Room Capacity Analysis (2025): Bedroom Distribution
Distribution of Listings by Number of Bedrooms
Room Capacity Insights for Den Hoorn
- The dominant room capacity in Den Hoorn is 1 bedroom listings, making up 41% of the market. This suggests a strong demand for properties suitable for couples or solo travelers.
- Together, 1 bedroom and 2 bedrooms properties represent 79.5% of the active Airbnb listings in Den Hoorn, indicating a high concentration in these sizes.
- Listings with 3+ bedrooms (7.7%) represent a smaller niche, potentially indicating an underserved market for larger group accommodations in Den Hoorn.
Den Hoorn Vacation Rental Guest Capacity Trends (2025)
Distribution of Listings by Guest Capacity
Guest Capacity Insights for Den Hoorn
- The most common guest capacity trend in Den Hoorn vacation rentals is listings accommodating 2 guests (35.9%). This suggests the primary traveler segment is likely couples or solo travelers.
- Properties designed for 2 guests and 4 guests dominate the Den Hoorn STR market, accounting for 64.1% of listings.
- On average, properties in Den Hoorn are equipped to host 2.9 guests.
Den Hoorn Airbnb Booking Patterns (2025): Available vs. Booked Days
Available Days Distribution
Booked Days Distribution
Booking Pattern Insights for Den Hoorn
- The most common availability pattern in Den Hoorn falls within the 91-180 days range, representing 43.6% of listings. This suggests many properties have significant open periods on their calendars.
- Approximately 51.2% of listings show high availability (181+ days open annually), indicating potential for increased bookings or specific owner usage patterns.
- For booked days, the 181-270 days range is most frequent in Den Hoorn (41%), reflecting common guest stay durations or potential owner blocking patterns.
- A notable 48.7% of properties secure long booking periods (181+ days booked per year), highlighting successful long-term rental strategies or significant owner usage.
Den Hoorn Airbnb Minimum Stay Requirements Analysis
Distribution of Listings by Minimum Night Requirement
1 Night
2 listings
5.3% of total
2 Nights
16 listings
42.1% of total
3 Nights
12 listings
31.6% of total
4-6 Nights
3 listings
7.9% of total
30+ Nights
5 listings
13.2% of total
Key Insights
- The most prevalent minimum stay requirement in Den Hoorn is 2 Nights, adopted by 42.1% of listings. This highlights the market's preference for shorter, flexible bookings.
- A significant segment (13.2%) caters to monthly stays (30+ nights) in Den Hoorn, pointing to opportunities in the extended-stay market.
Recommendations
- Align with the market by considering a 2 Nights minimum stay, as 42.1% of Den Hoorn hosts use this setting.
- If feasible, allowing 1-night stays, especially midweek or during low season, could capture last-minute bookings, as only 5.3% currently do.
- A 2-night minimum appears standard (42.1%). Consider this for weekends or peak periods.
- Explore offering discounts for stays of 30+ nights to attract the 13.2% of the market seeking extended stays.
- Adjust minimum nights based on seasonality – potentially shorter during low season and longer during peak demand periods in Den Hoorn.
Den Hoorn Airbnb Cancellation Policy Trends Analysis (2025)
Flexible
2 listings
5.9% of total
Moderate
10 listings
29.4% of total
Firm
5 listings
14.7% of total
Strict
17 listings
50% of total
Cancellation Policy Insights for Den Hoorn
- The prevailing Airbnb cancellation policy trend in Den Hoorn is Strict, used by 50% of listings.
- A majority (64.7%) of hosts in Den Hoorn utilize Firm or Strict policies, indicating a market where hosts prioritize booking security.
Recommendations for Hosts
- Consider adopting a Strict policy to align with the 50% market standard in Den Hoorn.
- With 50% using Strict terms, this is a viable option in Den Hoorn, particularly for high-value properties or during peak demand periods.
- Regularly review your cancellation policy against competitors and market demand shifts in Den Hoorn.
Den Hoorn STR Booking Lead Time Analysis (2025)
Average Booking Lead Time by Month
Booking Lead Time Insights for Den Hoorn
- The overall average booking lead time for vacation rentals in Den Hoorn is 61 days.
- Guests book furthest in advance for stays during July (average 115 days), likely coinciding with peak travel demand or local events.
- The shortest booking windows occur for stays in March (average 40 days), indicating more last-minute travel plans during this time.
- Seasonally, Summer (94 days avg.) sees the longest lead times, while Winter (61 days avg.) has the shortest, reflecting typical travel planning cycles.
Recommendations for Hosts
- Use the overall average lead time (61 days) as a baseline for your pricing and availability strategy in Den Hoorn.
- For July stays, consider implementing length-of-stay discounts or slightly higher rates for bookings made less than 115 days out to capitalize on advance planning.
- Target marketing efforts for the Summer season well in advance (at least 94 days) to capture early planners.
- Monitor your own booking lead times against these Den Hoorn averages to identify opportunities for dynamic pricing adjustments.
Popular & Essential Airbnb Amenities in Den Hoorn (2025)
Amenity Prevalence
Amenity Insights for Den Hoorn
- Popular amenities like Wifi, Smoke alarm, Hot water are common but not universal. Offering these can provide a competitive edge.
- Warning: Wifi is not universally provided but is considered essential globally. Ensure reliable Wifi is offered.
Recommendations for Hosts
- Consider adding popular differentiators like Wifi or Smoke alarm to increase appeal.
- Highlight unique or less common amenities you offer (e.g., hot tub, dedicated workspace, EV charger) in your listing description and photos.
- Regularly check competitor amenities in Den Hoorn to stay competitive.
Den Hoorn Airbnb Guest Demographics & Profile Analysis (2025)
Guest Profile Summary for Den Hoorn
- The typical guest profile for Airbnb in Den Hoorn consists of a mix of domestic (58%) and international guests, often arriving from nearby Amsterdam, typically belonging to the Post-2000s (Gen Z/Alpha) group (50%), primarily speaking English or German.
- Domestic travelers account for 58.3% of guests.
- Key international markets include Netherlands (58.3%) and Germany (26.6%).
- Top languages spoken are English (38.3%) followed by German (22.6%).
- A significant demographic segment is the Post-2000s (Gen Z/Alpha) group, representing 50% of guests.
Recommendations for Hosts
- Balance marketing efforts between domestic and international channels based on the guest mix.
- Tailor amenities and listing descriptions to appeal to the dominant Post-2000s (Gen Z/Alpha) demographic (e.g., highlight fast WiFi, smart home features, local guides).
- Highlight unique local experiences or amenities relevant to the primary guest profile.
- Consider seasonal promotions aligned with peak travel times for key origin markets.
Nearby Short-Term Rental Market Comparison
How does the Den Hoorn Airbnb market stack up against its neighbors? Compare key performance metrics like average monthly revenue, ADR, and occupancy rates in surrounding areas to understand the broader regional STR landscape.
| Market | Active Properties | Monthly Revenue | Daily Rate | Avg. Occupancy |
|---|---|---|---|---|
| Kockengen | 12 | $7,560 | $396.31 | 61% |
| Bentveld | 13 | $4,798 | $443.61 | 54% |
| Halfweg | 17 | $4,307 | $231.13 | 55% |
| Aerdenhout | 17 | $4,288 | $694.02 | 53% |
| Oud Ade | 17 | $3,779 | $277.47 | 51% |
| Rijs | 27 | $3,772 | $356.97 | 45% |
| Zwanenburg | 24 | $3,720 | $240.77 | 66% |
| Kortenhoef | 15 | $3,495 | $255.48 | 53% |
| Ouderkerk aan de Amstel | 28 | $3,433 | $231.63 | 57% |
| Amsterdam | 4,967 | $3,368 | $295.90 | 52% |