Den Helder Airbnb Market Analysis 2025: Short Term Rental Data & Vacation Rental Statistics in North Holland, Netherlands
Is Airbnb profitable in Den Helder in 2025? Explore comprehensive Airbnb analytics for Den Helder, North Holland, Netherlands to uncover income potential. This 2025 STR market report for Den Helder, based on AirROI data from April 2024 to March 2025, reveals key trends in the market of 231 active listings.
Whether you're considering an Airbnb investment in Den Helder, optimizing your existing vacation rental, or exploring rental arbitrage opportunities, understanding the Den Helder Airbnb data is crucial. Leveraging the low regulation environment is key to maximizing your short term rental income potential. Let's dive into the specifics.
Key Den Helder Airbnb Performance Metrics Overview
Monthly Airbnb Revenue Variations & Income Potential in Den Helder (2025)
Understanding the monthly revenue variations for Airbnb listings in Den Helder is key to maximizing your short term rental income potential. Seasonality significantly impacts earnings. Our analysis, based on data from the past 12 months, shows that the peak revenue month for STRs in Den Helder is typically July, while February often presents the lowest earnings, highlighting opportunities for strategic pricing adjustments during shoulder and low seasons. Explore the typical Airbnb income in Den Helder across different performance tiers:
- Best-in-class properties (Top 10%) achieve $4,028+ monthly, often utilizing dynamic pricing and superior guest experiences.
- Strong performing properties (Top 25%) earn $2,802 or more, indicating effective management and desirable locations/amenities.
- Typical properties (Median) generate around $1,733 per month, representing the average market performance.
- Entry-level properties (Bottom 25%) see earnings around $728, often with potential for optimization.
Average Monthly Airbnb Earnings Trend in Den Helder
Den Helder Airbnb Occupancy Rate Trends (2025)
Maximize your bookings by understanding the Den Helder STR occupancy trends. Seasonal demand shifts significantly influence how often properties are booked. Typically, Augustsees the highest demand (peak season occupancy), while January experiences the lowest (low season). Effective strategies, like adjusting minimum stays or offering promotions, can boost occupancy during slower periods. Here's how different property tiers perform in Den Helder:
- Best-in-class properties (Top 10%) achieve 70%+ occupancy, indicating high desirability and potentially optimized availability.
- Strong performing properties (Top 25%) maintain 54% or higher occupancy, suggesting good market fit and guest satisfaction.
- Typical properties (Median) have an occupancy rate around 34%.
- Entry-level properties (Bottom 25%) average 14% occupancy, potentially facing higher vacancy.
Average Monthly Occupancy Rate Trend in Den Helder
Average Daily Rate (ADR) Airbnb Trends in Den Helder (2025)
Effective short term rental pricing strategy in Den Helder involves understanding monthly ADR fluctuations. The Average Daily Rate (ADR) for Airbnb in Den Helder typically peaks in July and dips lowest during November. Leveraging Airbnb dynamic pricing tools or strategies based on this seasonality can significantly boost revenue. Here's a look at the typical nightly rates achieved:
- Best-in-class properties (Top 10%) command rates of $249+ per night, often due to premium features or locations.
- Strong performing properties (Top 25%) achieve nightly rates of $182 or more.
- Typical properties (Median) charge around $138 per night.
- Entry-level properties (Bottom 25%) earn around $109 per night.
Average Daily Rate (ADR) Trend by Month in Den Helder
Get Live Den Helder Market Intelligence 👇

Explore Real-time Analytics
Airbnb Seasonality Analysis & Trends in Den Helder (2025)
Peak Season (July, August, May)
- Revenue averages $3,157 per month
- Occupancy rates average 51.7%
- Daily rates average $168
Shoulder Season
- Revenue averages $1,953 per month
- Occupancy maintains around 35.7%
- Daily rates hold near $157
Low Season (January, February, March)
- Revenue drops to average $1,065 per month
- Occupancy decreases to average 22.5%
- Daily rates adjust to average $150
Seasonality Insights for Den Helder
- The Airbnb seasonality in Den Helder shows highly seasonal trends requiring careful strategy. While the sections above show seasonal averages, it's also insightful to look at the extremes:
- During the high season, the absolute peak month showcases Den Helder's highest earning potential, with monthly revenues capable of climbing to $3,410, occupancy reaching a high of 57.0%, and ADRs peaking at $171.
- Conversely, the slowest single month of the year, typically falling within the low season, marks the market's lowest point. In this month, revenue might dip to $940, occupancy could drop to 20.4%, and ADRs may adjust down to $147.
- Understanding both the seasonal averages and these monthly peaks and troughs in revenue, occupancy, and ADR is crucial for maximizing your Airbnb profit potential in Den Helder.
Seasonal Strategies for Maximizing Profit
- Peak Season: Maximize revenue through premium pricing and potentially longer minimum stays. Ensure high availability.
- Low Season: Offer competitive pricing, special promotions (e.g., extended stay discounts), and flexible cancellation policies. Target off-season travelers like remote workers or budget-conscious guests.
- Shoulder Seasons: Implement dynamic pricing that balances peak and low rates. Target weekend travelers or specific events. Offer slightly more flexible terms than peak season.
- Regularly analyze your own performance against these Den Helder seasonality benchmarks and adjust your pricing and availability strategy accordingly.
Best Areas for Airbnb Investment in Den Helder (2025)
Exploring the top neighborhoods for short-term rentals in Den Helder? This section highlights key areas, outlining why they are attractive for hosts and guests, along with notable local attractions. Consider these locations based on your target guest profile and investment strategy.
| Neighborhood / Area | Why Host Here? (Target Guests & Appeal) | Key Attractions & Landmarks |
|---|---|---|
| Breskens | Peaceful seaside area known for its sandy beaches and picturesque views of the North Sea. Ideal for families and travelers seeking a quiet retreat. | Breskens Beach, Museum of the History of Science, Ferry to Vlissingen, Nature Reserve 'Het Zoute' |
| Den Helder Center | The vibrant heart of Den Helder, offering easy access to shops, restaurants, and local culture. Great for urban explorers wanting to experience local life. | Fort Kijkduin, Dutch Navy Museum, Rooftop terrace at the Lighthouse, Shopping streets, Theater De Kampanje |
| Julianadorp | Suburban area with beautiful parks, making it suitable for families and nature lovers. Close to both beach and nature reserves. | Julianadorp Beach, Westerland Beach, Groene Strand 1, Parks and recreational areas |
| De Helderse Vallei | Nature park and recreation area, perfect for eco-tourism and families. Offers hiking, biking, and educational activities. | De Helderse Vallei Nature Park, Animal farm, Play areas, Walking trails |
| Castricum | Lively coastal town known for beautiful beaches and dunes, attracting vacationers and nature enthusiasts alike. | Castricum Beach, Dune reserve, Old village center and cafes |
| NIEUWE DOELEN | A developing area in Den Helder with modern amenities and a mix of residential and commercial spaces, appealing to long-term stays. | Nearby shopping options, Local markets, Events in public spaces |
| Oude Rijksweg | Historic area with charming architecture and proximity to local history museums, attracts culture enthusiasts. | Historical buildings, Local museums, Quaint cafes |
| Maritiem Museum | Centrally located in Den Helder, this area is perfect for those interested in maritime history and nearby attractions. | Maritime Museum, Nearby parks, Boat excursions |
Understanding Airbnb License Requirements & STR Laws in Den Helder (2025)
While Den Helder, North Holland, Netherlands currently shows low STR regulations, specific Airbnb license requirements might still exist or change. Always verify the latest short term rental regulations and Airbnb license requirements directly with local government authorities for Den Helder to ensure full compliance before hosting.
(Source: AirROI data, 2025, based on 1% licensed listings)
Top Performing Airbnb Properties in Den Helder (2025)
Benchmark your potential! Explore examples of top-performing Airbnb properties in Den Helderbased on Trailing Twelve Month (TTM) revenue. Analyze their characteristics, revenue, occupancy rate, and ADR to understand what drives success in this market.
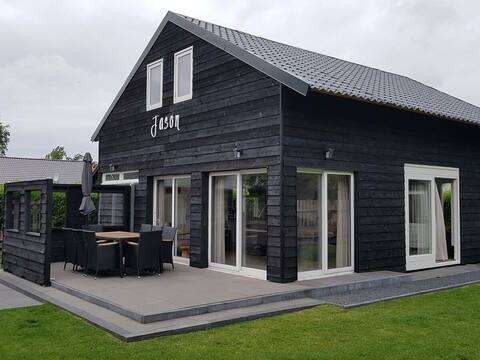
Luxury detached vacation home in Julianadorp
Entire Place • 4 bedrooms
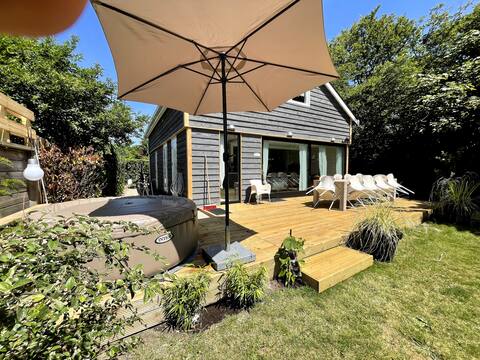
Modern Beach house with Jacuzzi for 12 people
Entire Place • 5 bedrooms

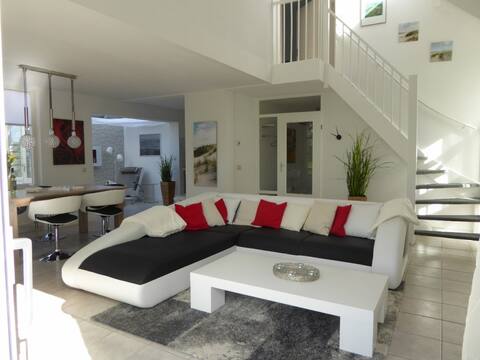
Apartment Jacky with sauna
Entire Place • 5 bedrooms
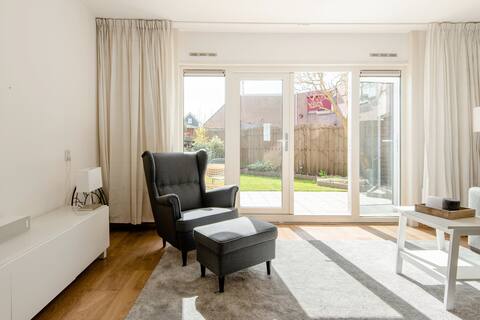
Villa Beach & Golf, Sauna, Whirl-Bathtub, Garden
Entire Place • 3 bedrooms
Julianadorp home by the sea
Entire Place • 4 bedrooms
Modern vacation home sleeps 10
Entire Place • 5 bedrooms
Note: Performance varies based on location, size, amenities, seasonality, and management quality. Data reflects the past 12 months.
Top Performing Airbnb Hosts in Den Helder (2025)
Learn from the best! This table showcases top-performing Airbnb hosts in Den Helder based on the number of properties managed and estimated total revenue over the past year. Analyze their scale and performance metrics.
| Host Name | Properties | Grossing Revenue | Stay Reviews | Avg Rating |
|---|---|---|---|---|
| Roel | 51 | $635,773 | 336 | 3.78/5.0 |
| Jessica | 29 | $257,876 | 227 | 3.02/5.0 |
| Vrijheid Aan De Kust | 22 | $214,740 | 46 | 0.98/5.0 |
| Sam | 5 | $212,512 | 470 | 4.68/5.0 |
| Callinghe | 17 | $162,531 | 22 | 0.49/5.0 |
| VBJaanzee | 4 | $155,626 | 73 | 4.45/5.0 |
| Martina | 3 | $136,805 | 157 | 4.80/5.0 |
| Melanie | 1 | $75,188 | 43 | 4.74/5.0 |
| Sandra | 6 | $71,551 | 44 | 3.45/5.0 |
| Larissa | 6 | $70,082 | 14 | 1.58/5.0 |
Analyzing the strategies of top hosts, such as their property selection, pricing, and guest communication, can offer valuable lessons for optimizing your own Airbnb operations in Den Helder.
Dive Deeper: Advanced Den Helder STR Market Data (2025)
Ready to unlock more insights? AirROI provides access to advanced metrics and comprehensive Airbnb data for Den Helder. Explore detailed analytics beyond this report to refine your investment strategy, optimize pricing, and maximize your vacation rental profits.
Explore Advanced MetricsDen Helder Short-Term Rental Market Composition (2025): Property & Room Types
Room Type Distribution
Property Type Distribution
Market Composition Insights for Den Helder
- The Den Helder Airbnb market composition is heavily skewed towards Entire Home/Apt listings, which make up 94.8% of the 231 active rentals. This indicates strong guest preference for privacy and space.
- Looking at the property type distribution in Den Helder, House properties are the most common (68%), reflecting the local real estate landscape.
- Houses represent a significant 68% portion, catering likely to families or larger groups.
- Smaller segments like hotel/boutique, outdoor/unique, others (combined 6.5%) offer potential for unique stay experiences.
Den Helder Airbnb Room Capacity Analysis (2025): Bedroom Distribution
Distribution of Listings by Number of Bedrooms
Room Capacity Insights for Den Helder
- The dominant room capacity in Den Helder is 2 bedrooms listings, making up 34.6% of the market. This suggests a strong demand for properties suitable for couples or solo travelers.
- Together, 2 bedrooms and 3 bedrooms properties represent 67.1% of the active Airbnb listings in Den Helder, indicating a high concentration in these sizes.
- A significant 46.8% of listings offer 3+ bedrooms, catering to larger groups and families seeking more space in Den Helder.
Den Helder Vacation Rental Guest Capacity Trends (2025)
Distribution of Listings by Guest Capacity
Guest Capacity Insights for Den Helder
- The most common guest capacity trend in Den Helder vacation rentals is listings accommodating 4 guests (33.8%). This suggests the primary traveler segment is likely small families or groups.
- Properties designed for 4 guests and 6 guests dominate the Den Helder STR market, accounting for 57.6% of listings.
- 37.7% of properties accommodate 6+ guests, serving the market segment for larger families or group travel in Den Helder.
- On average, properties in Den Helder are equipped to host 4.7 guests.
Den Helder Airbnb Booking Patterns (2025): Available vs. Booked Days
Available Days Distribution
Booked Days Distribution
Booking Pattern Insights for Den Helder
- The most common availability pattern in Den Helder falls within the 271-366 days range, representing 56.7% of listings. This suggests many properties have significant open periods on their calendars.
- Approximately 85.3% of listings show high availability (181+ days open annually), indicating potential for increased bookings or specific owner usage patterns.
- For booked days, the 31-90 days range is most frequent in Den Helder (32.5%), reflecting common guest stay durations or potential owner blocking patterns.
- A notable 15.6% of properties secure long booking periods (181+ days booked per year), highlighting successful long-term rental strategies or significant owner usage.
Den Helder Airbnb Minimum Stay Requirements Analysis
Distribution of Listings by Minimum Night Requirement
1 Night
42 listings
19.3% of total
2 Nights
28 listings
12.8% of total
3 Nights
84 listings
38.5% of total
4-6 Nights
17 listings
7.8% of total
7-29 Nights
11 listings
5% of total
30+ Nights
36 listings
16.5% of total
Key Insights
- The most prevalent minimum stay requirement in Den Helder is 3 Nights, adopted by 38.5% of listings. This highlights the market's preference for longer commitments.
- A significant segment (16.5%) caters to monthly stays (30+ nights) in Den Helder, pointing to opportunities in the extended-stay market.
Recommendations
- Align with the market by considering a 3 Nights minimum stay, as 38.5% of Den Helder hosts use this setting.
- If feasible, allowing 1-night stays, especially midweek or during low season, could capture last-minute bookings, as only 19.3% currently do.
- Explore offering discounts for stays of 30+ nights to attract the 16.5% of the market seeking extended stays.
- Adjust minimum nights based on seasonality – potentially shorter during low season and longer during peak demand periods in Den Helder.
Den Helder Airbnb Cancellation Policy Trends Analysis (2025)
Super Strict 60 Days
3 listings
1.8% of total
Flexible
7 listings
4.3% of total
Moderate
22 listings
13.4% of total
Firm
17 listings
10.4% of total
Strict
115 listings
70.1% of total
Cancellation Policy Insights for Den Helder
- The prevailing Airbnb cancellation policy trend in Den Helder is Strict, used by 70.1% of listings.
- A majority (80.5%) of hosts in Den Helder utilize Firm or Strict policies, indicating a market where hosts prioritize booking security.
Recommendations for Hosts
- Consider adopting a Strict policy to align with the 70.1% market standard in Den Helder.
- With 70.1% using Strict terms, this is a viable option in Den Helder, particularly for high-value properties or during peak demand periods.
- Regularly review your cancellation policy against competitors and market demand shifts in Den Helder.
Den Helder STR Booking Lead Time Analysis (2025)
Average Booking Lead Time by Month
Booking Lead Time Insights for Den Helder
- The overall average booking lead time for vacation rentals in Den Helder is 79 days.
- Guests book furthest in advance for stays during July (average 120 days), likely coinciding with peak travel demand or local events.
- The shortest booking windows occur for stays in November (average 53 days), indicating more last-minute travel plans during this time.
- Seasonally, Summer (115 days avg.) sees the longest lead times, while Winter (68 days avg.) has the shortest, reflecting typical travel planning cycles.
Recommendations for Hosts
- Use the overall average lead time (79 days) as a baseline for your pricing and availability strategy in Den Helder.
- For July stays, consider implementing length-of-stay discounts or slightly higher rates for bookings made less than 120 days out to capitalize on advance planning.
- Target marketing efforts for the Summer season well in advance (at least 115 days) to capture early planners.
- Monitor your own booking lead times against these Den Helder averages to identify opportunities for dynamic pricing adjustments.
Popular & Essential Airbnb Amenities in Den Helder (2025)
Amenity Prevalence
Amenity Insights for Den Helder
- Essential amenities in Den Helder that guests expect include: Wifi, Kitchen, TV. Lacking these (any) could significantly impact bookings.
- Popular amenities like Heating, Hot water, Free parking on premises are common but not universal. Offering these can provide a competitive edge.
Recommendations for Hosts
- Ensure your listing includes all essential amenities for Den Helder: Wifi, Kitchen, TV.
- Prioritize adding missing essentials: Wifi, Kitchen, TV.
- Consider adding popular differentiators like Heating or Hot water to increase appeal.
- Highlight unique or less common amenities you offer (e.g., hot tub, dedicated workspace, EV charger) in your listing description and photos.
- Regularly check competitor amenities in Den Helder to stay competitive.
Den Helder Airbnb Guest Demographics & Profile Analysis (2025)
Guest Profile Summary for Den Helder
- The typical guest profile for Airbnb in Den Helder consists of predominantly international visitors (84%), with top international origins including Netherlands, typically belonging to the Post-2000s (Gen Z/Alpha) group (50%), primarily speaking English or German.
- Domestic travelers account for 16.3% of guests.
- Key international markets include Germany (68.1%) and Netherlands (16.3%).
- Top languages spoken are English (40.4%) followed by German (33%).
- A significant demographic segment is the Post-2000s (Gen Z/Alpha) group, representing 50% of guests.
Recommendations for Hosts
- Focus marketing internationally, particularly towards travelers from Netherlands.
- Tailor amenities and listing descriptions to appeal to the dominant Post-2000s (Gen Z/Alpha) demographic (e.g., highlight fast WiFi, smart home features, local guides).
- Highlight unique local experiences or amenities relevant to the primary guest profile.
- Consider seasonal promotions aligned with peak travel times for key origin markets.
Nearby Short-Term Rental Market Comparison
How does the Den Helder Airbnb market stack up against its neighbors? Compare key performance metrics like average monthly revenue, ADR, and occupancy rates in surrounding areas to understand the broader regional STR landscape.
| Market | Active Properties | Monthly Revenue | Daily Rate | Avg. Occupancy |
|---|---|---|---|---|
| Kockengen | 12 | $7,560 | $396.31 | 61% |
| Bentveld | 13 | $4,798 | $443.61 | 54% |
| Halfweg | 17 | $4,307 | $231.13 | 55% |
| Aerdenhout | 17 | $4,288 | $694.02 | 53% |
| Merksplas | 10 | $3,885 | $256.59 | 44% |
| Oud Ade | 17 | $3,779 | $277.47 | 51% |
| Rijs | 27 | $3,772 | $356.97 | 45% |
| Zwanenburg | 24 | $3,720 | $240.77 | 66% |
| Kerkdriel | 25 | $3,607 | $323.16 | 40% |
| Brecht | 10 | $3,531 | $251.70 | 54% |