Den Burg Airbnb Market Analysis 2025: Short Term Rental Data & Vacation Rental Statistics in North Holland, Netherlands
Is Airbnb profitable in Den Burg in 2025? Explore comprehensive Airbnb analytics for Den Burg, North Holland, Netherlands to uncover income potential. This 2025 STR market report for Den Burg, based on AirROI data from April 2024 to March 2025, reveals key trends in the niche market of 63 active listings.
Whether you're considering an Airbnb investment in Den Burg, optimizing your existing vacation rental, or exploring rental arbitrage opportunities, understanding the Den Burg Airbnb data is crucial. Navigating the high regulation landscape is key to maximizing your short term rental income potential. Let's dive into the specifics.
Key Den Burg Airbnb Performance Metrics Overview
Monthly Airbnb Revenue Variations & Income Potential in Den Burg (2025)
Understanding the monthly revenue variations for Airbnb listings in Den Burg is key to maximizing your short term rental income potential. Seasonality significantly impacts earnings. Our analysis, based on data from the past 12 months, shows that the peak revenue month for STRs in Den Burg is typically August, while January often presents the lowest earnings, highlighting opportunities for strategic pricing adjustments during shoulder and low seasons. Explore the typical Airbnb income in Den Burg across different performance tiers:
- Best-in-class properties (Top 10%) achieve $4,200+ monthly, often utilizing dynamic pricing and superior guest experiences.
- Strong performing properties (Top 25%) earn $2,816 or more, indicating effective management and desirable locations/amenities.
- Typical properties (Median) generate around $1,875 per month, representing the average market performance.
- Entry-level properties (Bottom 25%) see earnings around $1,267, often with potential for optimization.
Average Monthly Airbnb Earnings Trend in Den Burg
Den Burg Airbnb Occupancy Rate Trends (2025)
Maximize your bookings by understanding the Den Burg STR occupancy trends. Seasonal demand shifts significantly influence how often properties are booked. Typically, Augustsees the highest demand (peak season occupancy), while January experiences the lowest (low season). Effective strategies, like adjusting minimum stays or offering promotions, can boost occupancy during slower periods. Here's how different property tiers perform in Den Burg:
- Best-in-class properties (Top 10%) achieve 85%+ occupancy, indicating high desirability and potentially optimized availability.
- Strong performing properties (Top 25%) maintain 70% or higher occupancy, suggesting good market fit and guest satisfaction.
- Typical properties (Median) have an occupancy rate around 50%.
- Entry-level properties (Bottom 25%) average 31% occupancy, potentially facing higher vacancy.
Average Monthly Occupancy Rate Trend in Den Burg
Average Daily Rate (ADR) Airbnb Trends in Den Burg (2025)
Effective short term rental pricing strategy in Den Burg involves understanding monthly ADR fluctuations. The Average Daily Rate (ADR) for Airbnb in Den Burg typically peaks in July and dips lowest during January. Leveraging Airbnb dynamic pricing tools or strategies based on this seasonality can significantly boost revenue. Here's a look at the typical nightly rates achieved:
- Best-in-class properties (Top 10%) command rates of $281+ per night, often due to premium features or locations.
- Strong performing properties (Top 25%) achieve nightly rates of $162 or more.
- Typical properties (Median) charge around $115 per night.
- Entry-level properties (Bottom 25%) earn around $97 per night.
Average Daily Rate (ADR) Trend by Month in Den Burg
Get Live Den Burg Market Intelligence 👇

Explore Real-time Analytics
Airbnb Seasonality Analysis & Trends in Den Burg (2025)
Peak Season (August, July, May)
- Revenue averages $3,268 per month
- Occupancy rates average 68.2%
- Daily rates average $162
Shoulder Season
- Revenue averages $2,296 per month
- Occupancy maintains around 49.6%
- Daily rates hold near $152
Low Season (January, March, December)
- Revenue drops to average $1,266 per month
- Occupancy decreases to average 32.7%
- Daily rates adjust to average $143
Seasonality Insights for Den Burg
- The Airbnb seasonality in Den Burg shows highly seasonal trends requiring careful strategy. While the sections above show seasonal averages, it's also insightful to look at the extremes:
- During the high season, the absolute peak month showcases Den Burg's highest earning potential, with monthly revenues capable of climbing to $3,459, occupancy reaching a high of 73.7%, and ADRs peaking at $164.
- Conversely, the slowest single month of the year, typically falling within the low season, marks the market's lowest point. In this month, revenue might dip to $1,142, occupancy could drop to 30.6%, and ADRs may adjust down to $137.
- Understanding both the seasonal averages and these monthly peaks and troughs in revenue, occupancy, and ADR is crucial for maximizing your Airbnb profit potential in Den Burg.
Seasonal Strategies for Maximizing Profit
- Peak Season: Maximize revenue through premium pricing and potentially longer minimum stays. Ensure high availability.
- Low Season: Offer competitive pricing, special promotions (e.g., extended stay discounts), and flexible cancellation policies. Target off-season travelers like remote workers or budget-conscious guests.
- Shoulder Seasons: Implement dynamic pricing that balances peak and low rates. Target weekend travelers or specific events. Offer slightly more flexible terms than peak season.
- Regularly analyze your own performance against these Den Burg seasonality benchmarks and adjust your pricing and availability strategy accordingly.
Best Areas for Airbnb Investment in Den Burg (2025)
Exploring the top neighborhoods for short-term rentals in Den Burg? This section highlights key areas, outlining why they are attractive for hosts and guests, along with notable local attractions. Consider these locations based on your target guest profile and investment strategy.
| Neighborhood / Area | Why Host Here? (Target Guests & Appeal) | Key Attractions & Landmarks |
|---|---|---|
| De Koog | A popular seaside resort known for its beautiful beaches and dunes. Ideal for guests looking for beach activities and nature exploration. | Ecomare, National Park Dunes of Texel, De Koog Beach, Texel Brewery, village shops and restaurants |
| Den Burg Center | The central village of Texel with a charming atmosphere and local culture. Great for guests wanting to explore the island's history and local cuisine. | Texelse Bierbrouwerij, Museum of Texel, St. Lawrence Church, local markets, cafes and shops |
| Oudeschild | A quaint fishing village known for its maritime heritage. Attracts visitors interested in history and seafood dining experiences. | Texel Slufter, Oudeschild Fishing Port, local restaurants, Sea Life Texel |
| De Slufter | A unique nature reserve known for its beautiful landscapes and birdwatching opportunities. Attracts nature lovers and hikers. | Texel Island Nature Reserve, birdwatching trails, hiking paths, scenic views |
| Westermient | A peaceful area close to the beach with a rural charm. Perfect for a relaxing getaway in nature. | beach access, cycling routes, quaint farms, natural landscapes |
| Zeeland | An area known for its stunning beaches and water sports activities. Great for active tourists and families. | sailing and windsurfing, Beach Club Zeeland, scenic coastline, water activities |
| Oosterend | A picturesque village showcasing Texel's traditional architecture and serene countryside. Ideal for those wanting a quiet retreat. | village charm, local farms, scenic walking paths, traditional windmill |
| Langereis | A hidden gem offering a mix of recreation and tranquility, perfect for guests looking for a unique spot to relax. | natural surroundings, walking trails, local fauna and flora, nearby beaches |
Understanding Airbnb License Requirements & STR Laws in Den Burg (2025)
Yes, Den Burg, North Holland, Netherlands enforces high STR regulations. Obtaining a license and ensuring compliance is almost certainly required according to current 2025 STR laws. Always verify the latest short term rental regulations and Airbnb license requirements directly with local government authorities for Den Burg to ensure full compliance before hosting.
(Source: AirROI data, 2025, based on 83% licensed listings)
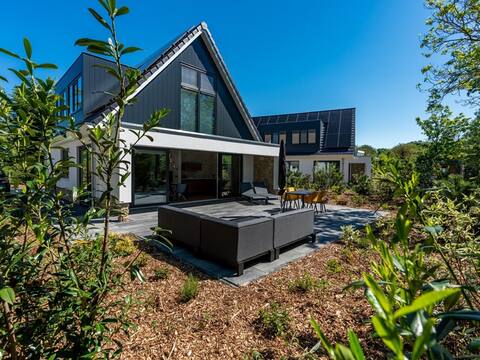
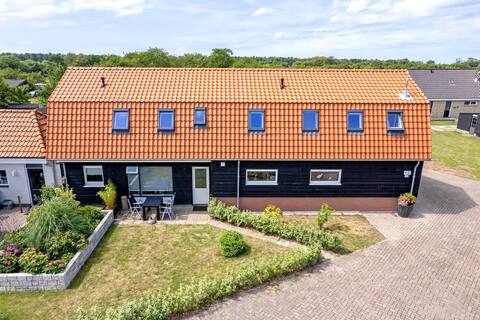
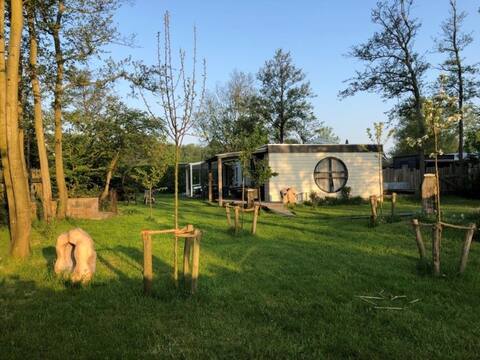
Top Performing Airbnb Properties in Den Burg (2025)
Benchmark your potential! Explore examples of top-performing Airbnb properties in Den Burgbased on Trailing Twelve Month (TTM) revenue. Analyze their characteristics, revenue, occupancy rate, and ADR to understand what drives success in this market.
Gray Kiekendief
Entire Place • 2 bedrooms

Bungalow on the edge of the forest
Entire Place • 2 bedrooms
Wulpenweid Bed and Parking
Private Room • 2 bedrooms
Beautiful holiday home on Texel close to the beach
Entire Place • 3 bedrooms
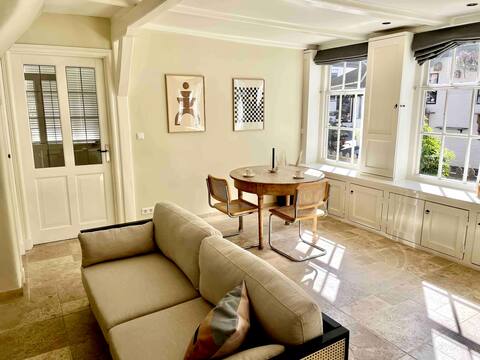
De Nachtegaal in centrum Den Burg
Entire Place • 2 bedrooms

Just Like Heaven luxury apartment with beach cottage
Entire Place • 2 bedrooms
Note: Performance varies based on location, size, amenities, seasonality, and management quality. Data reflects the past 12 months.
Top Performing Airbnb Hosts in Den Burg (2025)
Learn from the best! This table showcases top-performing Airbnb hosts in Den Burg based on the number of properties managed and estimated total revenue over the past year. Analyze their scale and performance metrics.
| Host Name | Properties | Grossing Revenue | Stay Reviews | Avg Rating |
|---|---|---|---|---|
| Denise | 6 | $188,936 | 78 | 4.66/5.0 |
| Rob | 4 | $153,539 | 18 | 3.46/5.0 |
| Petra | 4 | $60,280 | 134 | 4.81/5.0 |
| Tamara - BELVILLA | 5 | $58,744 | 6 | 1.00/5.0 |
| Kim | 1 | $52,952 | 71 | 4.94/5.0 |
| Anousjka | 1 | $49,284 | 65 | 4.89/5.0 |
| Patrick | 1 | $45,652 | 76 | 4.66/5.0 |
| Corina | 1 | $39,969 | 3 | 5.00/5.0 |
| Christine | 1 | $38,131 | 163 | 4.61/5.0 |
| Polly | 1 | $32,459 | 541 | 4.91/5.0 |
Analyzing the strategies of top hosts, such as their property selection, pricing, and guest communication, can offer valuable lessons for optimizing your own Airbnb operations in Den Burg.
Dive Deeper: Advanced Den Burg STR Market Data (2025)
Ready to unlock more insights? AirROI provides access to advanced metrics and comprehensive Airbnb data for Den Burg. Explore detailed analytics beyond this report to refine your investment strategy, optimize pricing, and maximize your vacation rental profits.
Explore Advanced MetricsDen Burg Short-Term Rental Market Composition (2025): Property & Room Types
Room Type Distribution
Property Type Distribution
Market Composition Insights for Den Burg
- The Den Burg Airbnb market composition is heavily skewed towards Entire Home/Apt listings, which make up 76.2% of the 63 active rentals. This indicates strong guest preference for privacy and space.
- Looking at the property type distribution in Den Burg, House properties are the most common (49.2%), reflecting the local real estate landscape.
- Houses represent a significant 49.2% portion, catering likely to families or larger groups.
- The presence of 9.5% Hotel/Boutique listings indicates integration with traditional hospitality.
- Smaller segments like outdoor/unique (combined 1.6%) offer potential for unique stay experiences.
Den Burg Airbnb Room Capacity Analysis (2025): Bedroom Distribution
Distribution of Listings by Number of Bedrooms
Room Capacity Insights for Den Burg
- The dominant room capacity in Den Burg is 2 bedrooms listings, making up 33.3% of the market. This suggests a strong demand for properties suitable for couples or solo travelers.
- Together, 2 bedrooms and 1 bedroom properties represent 63.5% of the active Airbnb listings in Den Burg, indicating a high concentration in these sizes.
Den Burg Vacation Rental Guest Capacity Trends (2025)
Distribution of Listings by Guest Capacity
Guest Capacity Insights for Den Burg
- The most common guest capacity trend in Den Burg vacation rentals is listings accommodating 2 guests (39.7%). This suggests the primary traveler segment is likely couples or solo travelers.
- Properties designed for 2 guests and 4 guests dominate the Den Burg STR market, accounting for 69.9% of listings.
- 12.7% of properties accommodate 6+ guests, serving the market segment for larger families or group travel in Den Burg.
- On average, properties in Den Burg are equipped to host 3.3 guests.
Den Burg Airbnb Booking Patterns (2025): Available vs. Booked Days
Available Days Distribution
Booked Days Distribution
Booking Pattern Insights for Den Burg
- The most common availability pattern in Den Burg falls within the 181-270 days range, representing 41.3% of listings. This suggests many properties have significant open periods on their calendars.
- Approximately 66.7% of listings show high availability (181+ days open annually), indicating potential for increased bookings or specific owner usage patterns.
- For booked days, the 91-180 days range is most frequent in Den Burg (41.3%), reflecting common guest stay durations or potential owner blocking patterns.
- A notable 34.9% of properties secure long booking periods (181+ days booked per year), highlighting successful long-term rental strategies or significant owner usage.
Den Burg Airbnb Minimum Stay Requirements Analysis
Distribution of Listings by Minimum Night Requirement
1 Night
7 listings
11.5% of total
2 Nights
16 listings
26.2% of total
3 Nights
13 listings
21.3% of total
4-6 Nights
1 listings
1.6% of total
7-29 Nights
7 listings
11.5% of total
30+ Nights
17 listings
27.9% of total
Key Insights
- The most prevalent minimum stay requirement in Den Burg is 30+ Nights, adopted by 27.9% of listings. This highlights the market's preference for longer commitments.
- A significant segment (27.9%) caters to monthly stays (30+ nights) in Den Burg, pointing to opportunities in the extended-stay market.
Recommendations
- Align with the market by considering a 30+ Nights minimum stay, as 27.9% of Den Burg hosts use this setting.
- If feasible, allowing 1-night stays, especially midweek or during low season, could capture last-minute bookings, as only 11.5% currently do.
- Explore offering discounts for stays of 30+ nights to attract the 27.9% of the market seeking extended stays.
- Adjust minimum nights based on seasonality – potentially shorter during low season and longer during peak demand periods in Den Burg.
Den Burg Airbnb Cancellation Policy Trends Analysis (2025)
Super Strict 60 Days
2 listings
3.4% of total
Super Strict 30 Days
1 listings
1.7% of total
Flexible
6 listings
10.3% of total
Moderate
19 listings
32.8% of total
Firm
18 listings
31% of total
Strict
12 listings
20.7% of total
Cancellation Policy Insights for Den Burg
- The prevailing Airbnb cancellation policy trend in Den Burg is Moderate, used by 32.8% of listings.
- A majority (51.7%) of hosts in Den Burg utilize Firm or Strict policies, indicating a market where hosts prioritize booking security.
Recommendations for Hosts
- Consider adopting a Moderate policy to align with the 32.8% market standard in Den Burg.
- Regularly review your cancellation policy against competitors and market demand shifts in Den Burg.
Den Burg STR Booking Lead Time Analysis (2025)
Average Booking Lead Time by Month
Booking Lead Time Insights for Den Burg
- The overall average booking lead time for vacation rentals in Den Burg is 75 days.
- Guests book furthest in advance for stays during July (average 127 days), likely coinciding with peak travel demand or local events.
- The shortest booking windows occur for stays in January (average 46 days), indicating more last-minute travel plans during this time.
- Seasonally, Summer (117 days avg.) sees the longest lead times, while Winter (57 days avg.) has the shortest, reflecting typical travel planning cycles.
Recommendations for Hosts
- Use the overall average lead time (75 days) as a baseline for your pricing and availability strategy in Den Burg.
- For July stays, consider implementing length-of-stay discounts or slightly higher rates for bookings made less than 127 days out to capitalize on advance planning.
- Target marketing efforts for the Summer season well in advance (at least 117 days) to capture early planners.
- Monitor your own booking lead times against these Den Burg averages to identify opportunities for dynamic pricing adjustments.
Popular & Essential Airbnb Amenities in Den Burg (2025)
Amenity Prevalence
Amenity Insights for Den Burg
- Essential amenities in Den Burg that guests expect include: Heating, Hot water, Wifi. Lacking these (any) could significantly impact bookings.
- Popular amenities like Smoke alarm, Coffee maker, TV are common but not universal. Offering these can provide a competitive edge.
Recommendations for Hosts
- Ensure your listing includes all essential amenities for Den Burg: Heating, Hot water, Wifi.
- Prioritize adding missing essentials: Heating, Hot water, Wifi.
- Consider adding popular differentiators like Smoke alarm or Coffee maker to increase appeal.
- Highlight unique or less common amenities you offer (e.g., hot tub, dedicated workspace, EV charger) in your listing description and photos.
- Regularly check competitor amenities in Den Burg to stay competitive.
Den Burg Airbnb Guest Demographics & Profile Analysis (2025)
Guest Profile Summary for Den Burg
- The typical guest profile for Airbnb in Den Burg consists of primarily domestic travelers (66%), often arriving from nearby Amsterdam, typically belonging to the Post-2000s (Gen Z/Alpha) group (50%), primarily speaking English or Dutch.
- Domestic travelers account for 65.6% of guests.
- Key international markets include Netherlands (65.6%) and Germany (15.7%).
- Top languages spoken are English (37.9%) followed by Dutch (26.3%).
- A significant demographic segment is the Post-2000s (Gen Z/Alpha) group, representing 50% of guests.
Recommendations for Hosts
- Target domestic marketing efforts towards travelers from Amsterdam and Utrecht.
- Tailor amenities and listing descriptions to appeal to the dominant Post-2000s (Gen Z/Alpha) demographic (e.g., highlight fast WiFi, smart home features, local guides).
- Highlight unique local experiences or amenities relevant to the primary guest profile.
- Consider seasonal promotions aligned with peak travel times for key origin markets.
Nearby Short-Term Rental Market Comparison
How does the Den Burg Airbnb market stack up against its neighbors? Compare key performance metrics like average monthly revenue, ADR, and occupancy rates in surrounding areas to understand the broader regional STR landscape.
| Market | Active Properties | Monthly Revenue | Daily Rate | Avg. Occupancy |
|---|---|---|---|---|
| Kockengen | 12 | $7,560 | $396.31 | 61% |
| Bentveld | 13 | $4,798 | $443.61 | 54% |
| Halfweg | 17 | $4,307 | $231.13 | 55% |
| Aerdenhout | 17 | $4,288 | $694.02 | 53% |
| Oud Ade | 17 | $3,779 | $277.47 | 51% |
| Rijs | 27 | $3,772 | $356.97 | 45% |
| Zwanenburg | 24 | $3,720 | $240.77 | 66% |
| Kortenhoef | 15 | $3,495 | $255.48 | 53% |
| Ouderkerk aan de Amstel | 28 | $3,433 | $231.63 | 57% |
| Amsterdam | 4,967 | $3,368 | $295.90 | 52% |