De Cocksdorp Airbnb Market Analysis 2025: Short Term Rental Data & Vacation Rental Statistics in North Holland, Netherlands
Is Airbnb profitable in De Cocksdorp in 2025? Explore comprehensive Airbnb analytics for De Cocksdorp, North Holland, Netherlands to uncover income potential. This 2025 STR market report for De Cocksdorp, based on AirROI data from April 2024 to March 2025, reveals key trends in the niche market of 96 active listings.
Whether you're considering an Airbnb investment in De Cocksdorp, optimizing your existing vacation rental, or exploring rental arbitrage opportunities, understanding the De Cocksdorp Airbnb data is crucial. Navigating the high regulation landscape is key to maximizing your short term rental income potential. Let's dive into the specifics.
Key De Cocksdorp Airbnb Performance Metrics Overview
Monthly Airbnb Revenue Variations & Income Potential in De Cocksdorp (2025)
Understanding the monthly revenue variations for Airbnb listings in De Cocksdorp is key to maximizing your short term rental income potential. Seasonality significantly impacts earnings. Our analysis, based on data from the past 12 months, shows that the peak revenue month for STRs in De Cocksdorp is typically July, while February often presents the lowest earnings, highlighting opportunities for strategic pricing adjustments during shoulder and low seasons. Explore the typical Airbnb income in De Cocksdorp across different performance tiers:
- Best-in-class properties (Top 10%) achieve $6,676+ monthly, often utilizing dynamic pricing and superior guest experiences.
- Strong performing properties (Top 25%) earn $4,364 or more, indicating effective management and desirable locations/amenities.
- Typical properties (Median) generate around $2,353 per month, representing the average market performance.
- Entry-level properties (Bottom 25%) see earnings around $1,408, often with potential for optimization.
Average Monthly Airbnb Earnings Trend in De Cocksdorp
De Cocksdorp Airbnb Occupancy Rate Trends (2025)
Maximize your bookings by understanding the De Cocksdorp STR occupancy trends. Seasonal demand shifts significantly influence how often properties are booked. Typically, Augustsees the highest demand (peak season occupancy), while January experiences the lowest (low season). Effective strategies, like adjusting minimum stays or offering promotions, can boost occupancy during slower periods. Here's how different property tiers perform in De Cocksdorp:
- Best-in-class properties (Top 10%) achieve 72%+ occupancy, indicating high desirability and potentially optimized availability.
- Strong performing properties (Top 25%) maintain 58% or higher occupancy, suggesting good market fit and guest satisfaction.
- Typical properties (Median) have an occupancy rate around 36%.
- Entry-level properties (Bottom 25%) average 17% occupancy, potentially facing higher vacancy.
Average Monthly Occupancy Rate Trend in De Cocksdorp
Average Daily Rate (ADR) Airbnb Trends in De Cocksdorp (2025)
Effective short term rental pricing strategy in De Cocksdorp involves understanding monthly ADR fluctuations. The Average Daily Rate (ADR) for Airbnb in De Cocksdorp typically peaks in July and dips lowest during January. Leveraging Airbnb dynamic pricing tools or strategies based on this seasonality can significantly boost revenue. Here's a look at the typical nightly rates achieved:
- Best-in-class properties (Top 10%) command rates of $548+ per night, often due to premium features or locations.
- Strong performing properties (Top 25%) achieve nightly rates of $344 or more.
- Typical properties (Median) charge around $239 per night.
- Entry-level properties (Bottom 25%) earn around $140 per night.
Average Daily Rate (ADR) Trend by Month in De Cocksdorp
Get Live De Cocksdorp Market Intelligence 👇

Explore Real-time Analytics
Airbnb Seasonality Analysis & Trends in De Cocksdorp (2025)
Peak Season (July, August, May)
- Revenue averages $4,916 per month
- Occupancy rates average 52.3%
- Daily rates average $291
Shoulder Season
- Revenue averages $3,291 per month
- Occupancy maintains around 39.0%
- Daily rates hold near $283
Low Season (January, February, March)
- Revenue drops to average $1,591 per month
- Occupancy decreases to average 22.6%
- Daily rates adjust to average $278
Seasonality Insights for De Cocksdorp
- The Airbnb seasonality in De Cocksdorp shows highly seasonal trends requiring careful strategy. While the sections above show seasonal averages, it's also insightful to look at the extremes:
- During the high season, the absolute peak month showcases De Cocksdorp's highest earning potential, with monthly revenues capable of climbing to $5,135, occupancy reaching a high of 55.0%, and ADRs peaking at $294.
- Conversely, the slowest single month of the year, typically falling within the low season, marks the market's lowest point. In this month, revenue might dip to $1,234, occupancy could drop to 21.7%, and ADRs may adjust down to $271.
- Understanding both the seasonal averages and these monthly peaks and troughs in revenue, occupancy, and ADR is crucial for maximizing your Airbnb profit potential in De Cocksdorp.
Seasonal Strategies for Maximizing Profit
- Peak Season: Maximize revenue through premium pricing and potentially longer minimum stays. Ensure high availability.
- Low Season: Offer competitive pricing, special promotions (e.g., extended stay discounts), and flexible cancellation policies. Target off-season travelers like remote workers or budget-conscious guests.
- Shoulder Seasons: Implement dynamic pricing that balances peak and low rates. Target weekend travelers or specific events. Offer slightly more flexible terms than peak season.
- Regularly analyze your own performance against these De Cocksdorp seasonality benchmarks and adjust your pricing and availability strategy accordingly.
Best Areas for Airbnb Investment in De Cocksdorp (2025)
Exploring the top neighborhoods for short-term rentals in De Cocksdorp? This section highlights key areas, outlining why they are attractive for hosts and guests, along with notable local attractions. Consider these locations based on your target guest profile and investment strategy.
| Neighborhood / Area | Why Host Here? (Target Guests & Appeal) | Key Attractions & Landmarks |
|---|---|---|
| De Cocksdorp Village | The charming village is known for its friendly atmosphere and proximity to various tourist attractions. It is popular among families and those looking to escape to nature, making it an ideal spot for Airbnb hosting. | Ecomare, Texel National Park, Juttersmuseum Texel, Lighthouse Texel, De Cocksdorp Windmill |
| Texel Island Beaches | These stunning beaches offer miles of sandy shores and are perfect for beachgoers and nature lovers. The beaches frequently attract tourists, especially during the summer months. | Paal 17 Beach, De Slufter Nature Reserve, Oudeschild Beach, Vuurtorenweg Beach, Lighthouse Views |
| Bird Watching Areas | Texel is a haven for bird watchers, with many unique species to see. This draws in tourists interested in wildlife and nature photography, making it a niche market for Airbnb. | Knollengebied, De Mok, Zandkes Beach, Dunes of Texel National Park, Dune & Coast Nature Trail |
| De Schorren | This unique nature reserve is a tidal flat area perfect for hiking and exploring the rich flora and fauna, attracting ecotourism and nature enthusiasts. | Bird Watching Spots, Hiking Trails, Nature Walks, Unique Ecosystem, Local Wildlife |
| Kite Surfing at Paal 17 | Paal 17 is renowned for its excellent kite surfing conditions, attracting sport enthusiasts and adventure seekers looking for a vibrant beach scene. | Kite Surfing Schools, Beach Bars, Surf Rentals, Family Beach Activities, Water Sports Events |
| Historical Sites Tour | De Cocksdorp has historical charm with various sites reflecting its past. History buffs and cultural tourists find this area interesting, leading to demand for themed stays. | War Museum Texel, St. Lamberts Church, Old Dutch Windmills, Heritage Centre, Local History Exhibits |
| Cycling Routes | The flat terrain and designated cycling paths attract cycling enthusiasts. Airbnb properties catering to this market can capitalize on tourists looking for cycling vacations. | Cycling Trails, Bike Rentals, Scenic Routes, Countryside Views, Cycling Festivals |
| Local Markets and Festivals | De Cocksdorp hosts several local markets and festivals throughout the year, drawing in visitors eager to experience local culture, food, and crafts. | Texel Market, Vincent van Gogh Festival, Local Food Fairs, Craft Markets, Seasonal Events |
Understanding Airbnb License Requirements & STR Laws in De Cocksdorp (2025)
Yes, De Cocksdorp, North Holland, Netherlands enforces high STR regulations. Obtaining a license and ensuring compliance is almost certainly required according to current 2025 STR laws. Always verify the latest short term rental regulations and Airbnb license requirements directly with local government authorities for De Cocksdorp to ensure full compliance before hosting.
(Source: AirROI data, 2025, based on 51% licensed listings)
Top Performing Airbnb Properties in De Cocksdorp (2025)
Benchmark your potential! Explore examples of top-performing Airbnb properties in De Cocksdorpbased on Trailing Twelve Month (TTM) revenue. Analyze their characteristics, revenue, occupancy rate, and ADR to understand what drives success in this market.
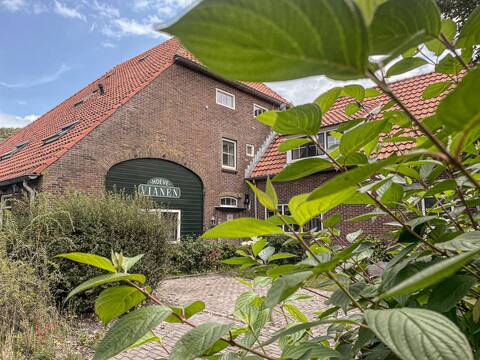
Unique 10 person Farm Lodge at 'Hoeve Vianen'
Entire Place • 4 bedrooms

Unique 12 person Farm Lodge at 'Hoeve Vianen'
Entire Place • 5 bedrooms
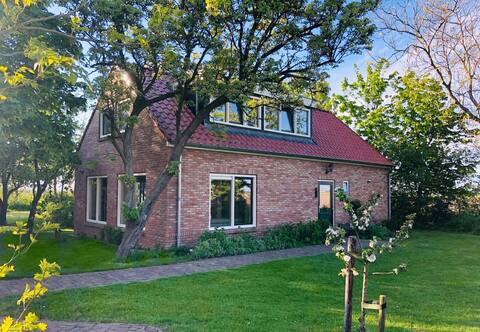
Princenhof 2 - 8 persoons
Entire Place • 4 bedrooms

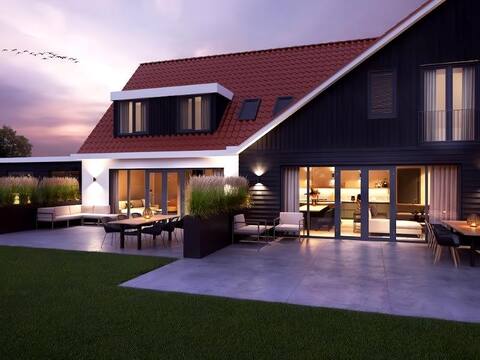
Luxury 8-person ‘Golfvillatexel‘ near the sea
Entire Place • 4 bedrooms
Unique 10 person Farm Lodge at 'Hoeve Vianen'
Entire Place • 5 bedrooms

Princenhof 1 - 6 persoons
Entire Place • 3 bedrooms
Note: Performance varies based on location, size, amenities, seasonality, and management quality. Data reflects the past 12 months.
Top Performing Airbnb Hosts in De Cocksdorp (2025)
Learn from the best! This table showcases top-performing Airbnb hosts in De Cocksdorp based on the number of properties managed and estimated total revenue over the past year. Analyze their scale and performance metrics.
| Host Name | Properties | Grossing Revenue | Stay Reviews | Avg Rating |
|---|---|---|---|---|
| Hoeve Vianen | 5 | $441,589 | 111 | 4.63/5.0 |
| Rob | 5 | $253,131 | 84 | 4.85/5.0 |
| Diana - BELVILLA | 12 | $189,082 | 10 | 0.77/5.0 |
| Eilandaccommodaties | 5 | $188,751 | 148 | 4.18/5.0 |
| Ineke | 1 | $90,680 | 109 | 4.98/5.0 |
| Tess - BELVILLA | 16 | $79,976 | 175 | 4.76/5.0 |
| Tamara - BELVILLA | 11 | $75,933 | 67 | 4.18/5.0 |
| Casa | 1 | $62,962 | 67 | 4.58/5.0 |
| Jacob | 1 | $57,419 | 9 | 4.67/5.0 |
| Jacqueline | 3 | $57,354 | 251 | 4.51/5.0 |
Analyzing the strategies of top hosts, such as their property selection, pricing, and guest communication, can offer valuable lessons for optimizing your own Airbnb operations in De Cocksdorp.
Dive Deeper: Advanced De Cocksdorp STR Market Data (2025)
Ready to unlock more insights? AirROI provides access to advanced metrics and comprehensive Airbnb data for De Cocksdorp. Explore detailed analytics beyond this report to refine your investment strategy, optimize pricing, and maximize your vacation rental profits.
Explore Advanced MetricsDe Cocksdorp Short-Term Rental Market Composition (2025): Property & Room Types
Room Type Distribution
Property Type Distribution
Market Composition Insights for De Cocksdorp
- The De Cocksdorp Airbnb market composition is heavily skewed towards Entire Home/Apt listings, which make up 95.8% of the 96 active rentals. This indicates strong guest preference for privacy and space.
- Looking at the property type distribution in De Cocksdorp, House properties are the most common (89.6%), reflecting the local real estate landscape.
- Houses represent a significant 89.6% portion, catering likely to families or larger groups.
- Smaller segments like hotel/boutique, outdoor/unique, apartment/condo, others (combined 10.4%) offer potential for unique stay experiences.
De Cocksdorp Airbnb Room Capacity Analysis (2025): Bedroom Distribution
Distribution of Listings by Number of Bedrooms
Room Capacity Insights for De Cocksdorp
- The dominant room capacity in De Cocksdorp is 3 bedrooms listings, making up 35.4% of the market. This suggests a strong demand for properties suitable for families or small groups.
- Together, 3 bedrooms and 2 bedrooms properties represent 60.4% of the active Airbnb listings in De Cocksdorp, indicating a high concentration in these sizes.
- A significant 56.2% of listings offer 3+ bedrooms, catering to larger groups and families seeking more space in De Cocksdorp.
De Cocksdorp Vacation Rental Guest Capacity Trends (2025)
Distribution of Listings by Guest Capacity
Guest Capacity Insights for De Cocksdorp
- The most common guest capacity trend in De Cocksdorp vacation rentals is listings accommodating 6 guests (30.2%). This suggests the primary traveler segment is likely larger groups.
- Properties designed for 6 guests and 4 guests dominate the De Cocksdorp STR market, accounting for 54.2% of listings.
- 52.0% of properties accommodate 6+ guests, serving the market segment for larger families or group travel in De Cocksdorp.
- On average, properties in De Cocksdorp are equipped to host 5.1 guests.
De Cocksdorp Airbnb Booking Patterns (2025): Available vs. Booked Days
Available Days Distribution
Booked Days Distribution
Booking Pattern Insights for De Cocksdorp
- The most common availability pattern in De Cocksdorp falls within the 271-366 days range, representing 55.2% of listings. This suggests many properties have significant open periods on their calendars.
- Approximately 80.2% of listings show high availability (181+ days open annually), indicating potential for increased bookings or specific owner usage patterns.
- For booked days, the 1-30 days range is most frequent in De Cocksdorp (38.5%), reflecting common guest stay durations or potential owner blocking patterns.
- A notable 19.8% of properties secure long booking periods (181+ days booked per year), highlighting successful long-term rental strategies or significant owner usage.
De Cocksdorp Airbnb Minimum Stay Requirements Analysis
Distribution of Listings by Minimum Night Requirement
1 Night
13 listings
15.5% of total
2 Nights
16 listings
19% of total
3 Nights
13 listings
15.5% of total
4-6 Nights
5 listings
6% of total
7-29 Nights
3 listings
3.6% of total
30+ Nights
34 listings
40.5% of total
Key Insights
- The most prevalent minimum stay requirement in De Cocksdorp is 30+ Nights, adopted by 40.5% of listings. This highlights the market's preference for longer commitments.
- A significant segment (40.5%) caters to monthly stays (30+ nights) in De Cocksdorp, pointing to opportunities in the extended-stay market.
Recommendations
- Align with the market by considering a 30+ Nights minimum stay, as 40.5% of De Cocksdorp hosts use this setting.
- If feasible, allowing 1-night stays, especially midweek or during low season, could capture last-minute bookings, as only 15.5% currently do.
- Explore offering discounts for stays of 30+ nights to attract the 40.5% of the market seeking extended stays.
- Adjust minimum nights based on seasonality – potentially shorter during low season and longer during peak demand periods in De Cocksdorp.
De Cocksdorp Airbnb Cancellation Policy Trends Analysis (2025)
Super Strict 30 Days
2 listings
2.6% of total
Super Strict 60 Days
1 listings
1.3% of total
Flexible
3 listings
3.9% of total
Moderate
7 listings
9.1% of total
Firm
17 listings
22.1% of total
Strict
47 listings
61% of total
Cancellation Policy Insights for De Cocksdorp
- The prevailing Airbnb cancellation policy trend in De Cocksdorp is Strict, used by 61% of listings.
- A majority (83.1%) of hosts in De Cocksdorp utilize Firm or Strict policies, indicating a market where hosts prioritize booking security.
Recommendations for Hosts
- Consider adopting a Strict policy to align with the 61% market standard in De Cocksdorp.
- With 61% using Strict terms, this is a viable option in De Cocksdorp, particularly for high-value properties or during peak demand periods.
- Regularly review your cancellation policy against competitors and market demand shifts in De Cocksdorp.
De Cocksdorp STR Booking Lead Time Analysis (2025)
Average Booking Lead Time by Month
Booking Lead Time Insights for De Cocksdorp
- The overall average booking lead time for vacation rentals in De Cocksdorp is 96 days.
- Guests book furthest in advance for stays during July (average 152 days), likely coinciding with peak travel demand or local events.
- The shortest booking windows occur for stays in February (average 59 days), indicating more last-minute travel plans during this time.
- Seasonally, Summer (131 days avg.) sees the longest lead times, while Winter (85 days avg.) has the shortest, reflecting typical travel planning cycles.
Recommendations for Hosts
- Use the overall average lead time (96 days) as a baseline for your pricing and availability strategy in De Cocksdorp.
- For July stays, consider implementing length-of-stay discounts or slightly higher rates for bookings made less than 152 days out to capitalize on advance planning.
- Target marketing efforts for the Summer season well in advance (at least 131 days) to capture early planners.
- Monitor your own booking lead times against these De Cocksdorp averages to identify opportunities for dynamic pricing adjustments.
Popular & Essential Airbnb Amenities in De Cocksdorp (2025)
Amenity Prevalence
Amenity Insights for De Cocksdorp
- Essential amenities in De Cocksdorp that guests expect include: Wifi, Heating. Lacking these (any) could significantly impact bookings.
- Popular amenities like TV, Kitchen, Coffee maker are common but not universal. Offering these can provide a competitive edge.
Recommendations for Hosts
- Ensure your listing includes all essential amenities for De Cocksdorp: Wifi, Heating.
- Prioritize adding missing essentials: Wifi, Heating.
- Consider adding popular differentiators like TV or Kitchen to increase appeal.
- Highlight unique or less common amenities you offer (e.g., hot tub, dedicated workspace, EV charger) in your listing description and photos.
- Regularly check competitor amenities in De Cocksdorp to stay competitive.
De Cocksdorp Airbnb Guest Demographics & Profile Analysis (2025)
Guest Profile Summary for De Cocksdorp
- The typical guest profile for Airbnb in De Cocksdorp consists of a mix of domestic (59%) and international guests, often arriving from nearby Utrecht, typically belonging to the Post-2000s (Gen Z/Alpha) group (50%), primarily speaking English or Dutch.
- Domestic travelers account for 59.3% of guests.
- Key international markets include Netherlands (59.3%) and Germany (26.8%).
- Top languages spoken are English (37.6%) followed by Dutch (23%).
- A significant demographic segment is the Post-2000s (Gen Z/Alpha) group, representing 50% of guests.
Recommendations for Hosts
- Balance marketing efforts between domestic and international channels based on the guest mix.
- Tailor amenities and listing descriptions to appeal to the dominant Post-2000s (Gen Z/Alpha) demographic (e.g., highlight fast WiFi, smart home features, local guides).
- Highlight unique local experiences or amenities relevant to the primary guest profile.
- Consider seasonal promotions aligned with peak travel times for key origin markets.
Nearby Short-Term Rental Market Comparison
How does the De Cocksdorp Airbnb market stack up against its neighbors? Compare key performance metrics like average monthly revenue, ADR, and occupancy rates in surrounding areas to understand the broader regional STR landscape.
| Market | Active Properties | Monthly Revenue | Daily Rate | Avg. Occupancy |
|---|---|---|---|---|
| Kockengen | 12 | $7,560 | $396.31 | 61% |
| Bentveld | 13 | $4,798 | $443.61 | 54% |
| Halfweg | 17 | $4,307 | $231.13 | 55% |
| Aerdenhout | 17 | $4,288 | $694.02 | 53% |
| Oud Ade | 17 | $3,779 | $277.47 | 51% |
| Rijs | 27 | $3,772 | $356.97 | 45% |
| Zwanenburg | 24 | $3,720 | $240.77 | 66% |
| Kortenhoef | 15 | $3,495 | $255.48 | 53% |
| Ouderkerk aan de Amstel | 28 | $3,433 | $231.63 | 57% |
| Amsterdam | 4,967 | $3,368 | $295.90 | 52% |