Bloemendaal Airbnb Market Analysis 2025: Short Term Rental Data & Vacation Rental Statistics in North Holland, Netherlands
Is Airbnb profitable in Bloemendaal in 2025? Explore comprehensive Airbnb analytics for Bloemendaal, North Holland, Netherlands to uncover income potential. This 2025 STR market report for Bloemendaal, based on AirROI data from April 2024 to March 2025, reveals key trends in the niche market of 37 active listings.
Whether you're considering an Airbnb investment in Bloemendaal, optimizing your existing vacation rental, or exploring rental arbitrage opportunities, understanding the Bloemendaal Airbnb data is crucial. Leveraging the low regulation environment is key to maximizing your short term rental income potential. Let's dive into the specifics.
Key Bloemendaal Airbnb Performance Metrics Overview
Monthly Airbnb Revenue Variations & Income Potential in Bloemendaal (2025)
Understanding the monthly revenue variations for Airbnb listings in Bloemendaal is key to maximizing your short term rental income potential. Seasonality significantly impacts earnings. Our analysis, based on data from the past 12 months, shows that the peak revenue month for STRs in Bloemendaal is typically December, while February often presents the lowest earnings, highlighting opportunities for strategic pricing adjustments during shoulder and low seasons. Explore the typical Airbnb income in Bloemendaal across different performance tiers:
- Best-in-class properties (Top 10%) achieve $9,674+ monthly, often utilizing dynamic pricing and superior guest experiences.
- Strong performing properties (Top 25%) earn $6,961 or more, indicating effective management and desirable locations/amenities.
- Typical properties (Median) generate around $3,130 per month, representing the average market performance.
- Entry-level properties (Bottom 25%) see earnings around $1,811, often with potential for optimization.
Average Monthly Airbnb Earnings Trend in Bloemendaal
Bloemendaal Airbnb Occupancy Rate Trends (2025)
Maximize your bookings by understanding the Bloemendaal STR occupancy trends. Seasonal demand shifts significantly influence how often properties are booked. Typically, Julysees the highest demand (peak season occupancy), while February experiences the lowest (low season). Effective strategies, like adjusting minimum stays or offering promotions, can boost occupancy during slower periods. Here's how different property tiers perform in Bloemendaal:
- Best-in-class properties (Top 10%) achieve 84%+ occupancy, indicating high desirability and potentially optimized availability.
- Strong performing properties (Top 25%) maintain 72% or higher occupancy, suggesting good market fit and guest satisfaction.
- Typical properties (Median) have an occupancy rate around 51%.
- Entry-level properties (Bottom 25%) average 24% occupancy, potentially facing higher vacancy.
Average Monthly Occupancy Rate Trend in Bloemendaal
Average Daily Rate (ADR) Airbnb Trends in Bloemendaal (2025)
Effective short term rental pricing strategy in Bloemendaal involves understanding monthly ADR fluctuations. The Average Daily Rate (ADR) for Airbnb in Bloemendaal typically peaks in August and dips lowest during March. Leveraging Airbnb dynamic pricing tools or strategies based on this seasonality can significantly boost revenue. Here's a look at the typical nightly rates achieved:
- Best-in-class properties (Top 10%) command rates of $571+ per night, often due to premium features or locations.
- Strong performing properties (Top 25%) achieve nightly rates of $370 or more.
- Typical properties (Median) charge around $273 per night.
- Entry-level properties (Bottom 25%) earn around $187 per night.
Average Daily Rate (ADR) Trend by Month in Bloemendaal
Get Live Bloemendaal Market Intelligence 👇

Explore Real-time Analytics
Airbnb Seasonality Analysis & Trends in Bloemendaal (2025)
Peak Season (December, July, April)
- Revenue averages $6,344 per month
- Occupancy rates average 56.2%
- Daily rates average $359
Shoulder Season
- Revenue averages $5,581 per month
- Occupancy maintains around 53.0%
- Daily rates hold near $359
Low Season (February, March, October)
- Revenue drops to average $3,631 per month
- Occupancy decreases to average 34.4%
- Daily rates adjust to average $322
Seasonality Insights for Bloemendaal
- The Airbnb seasonality in Bloemendaal shows highly seasonal trends requiring careful strategy. While the sections above show seasonal averages, it's also insightful to look at the extremes:
- During the high season, the absolute peak month showcases Bloemendaal's highest earning potential, with monthly revenues capable of climbing to $6,501, occupancy reaching a high of 69.7%, and ADRs peaking at $397.
- Conversely, the slowest single month of the year, typically falling within the low season, marks the market's lowest point. In this month, revenue might dip to $2,671, occupancy could drop to 18.3%, and ADRs may adjust down to $287.
- Understanding both the seasonal averages and these monthly peaks and troughs in revenue, occupancy, and ADR is crucial for maximizing your Airbnb profit potential in Bloemendaal.
Seasonal Strategies for Maximizing Profit
- Peak Season: Maximize revenue through premium pricing and potentially longer minimum stays. Ensure high availability.
- Low Season: Offer competitive pricing, special promotions (e.g., extended stay discounts), and flexible cancellation policies. Target off-season travelers like remote workers or budget-conscious guests.
- Shoulder Seasons: Implement dynamic pricing that balances peak and low rates. Target weekend travelers or specific events. Offer slightly more flexible terms than peak season.
- Regularly analyze your own performance against these Bloemendaal seasonality benchmarks and adjust your pricing and availability strategy accordingly.
Best Areas for Airbnb Investment in Bloemendaal (2025)
Exploring the top neighborhoods for short-term rentals in Bloemendaal? This section highlights key areas, outlining why they are attractive for hosts and guests, along with notable local attractions. Consider these locations based on your target guest profile and investment strategy.
| Neighborhood / Area | Why Host Here? (Target Guests & Appeal) | Key Attractions & Landmarks |
|---|---|---|
| Bloemendaal Beach | A popular summer destination known for its beautiful beach and lively atmosphere. Ideal for hosting tourists seeking relaxation and beach activities. | Bloemendaal aan Zee, Zandvoort, Haarlem city center, Kennemerduinen National Park, Beach clubs and restaurants |
| Bloemendaal Village | A charming village with picturesque architecture and a close community feel. Attracts visitors looking for a peaceful getaway while being close to the city. | St. Bernardus Church, Museum Haarlem, Hiking trails, Local cafes and shops |
| Kennemerduinen | A stunning national park with dunes and wildlife. Perfect for nature lovers and those looking for outdoor activities such as hiking and cycling. | Bicycle routes, Nature walks, Wildlife spotting, Dune landscapes |
| Haarlem | Nearby city known for its rich history and vibrant cultural scene. Ideal for guests wanting to explore the heritage and attractions of Haarlem and Bloemendaal. | Frans Hals Museum, Haarlem's historic center, Teylers Museum, Grote Markt, The Molen |
| Spaarnwoude | A beautiful area with extensive parks and river views. Great for those seeking tranquility away from urban noise, yet close to amenities. | Spaarnwoude Park, Sports and recreational activities, Picnic areas, Walking paths |
| Amsterdam North | Just a short drive away, this up-and-coming area offers modern attractions and unique cultural experiences, attracting younger crowds. | Eye Filmmuseum, NDSM Wharf, Local art scene, Trendy cafes and restaurants |
| Zandvoort | A vibrant beach town with a famous sandy beach and lively promenade. Very popular with tourists, especially in the summer season. | Zandvoort aan Zee Beach, Circuit Zandvoort, Beach clubs, Local dining options |
| Beverwijk | A historical town close to Bloemendaal with opportunities for local shopping and enjoying the local culture. Fits those looking for a blend of urban and rural. | Beverwijk Market, Castle Assumburg, Local parks, Historical architecture |
Understanding Airbnb License Requirements & STR Laws in Bloemendaal (2025)
While Bloemendaal, North Holland, Netherlands currently shows low STR regulations, specific Airbnb license requirements might still exist or change. Always verify the latest short term rental regulations and Airbnb license requirements directly with local government authorities for Bloemendaal to ensure full compliance before hosting.
(Source: AirROI data, 2025, finding no licensed listings among those analyzed)
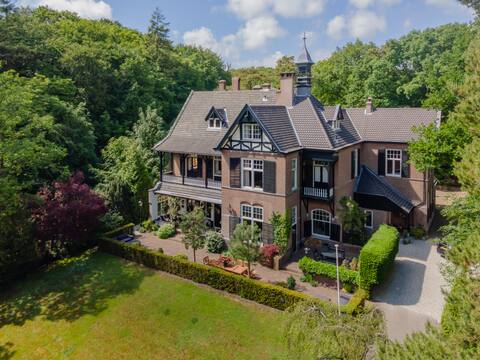
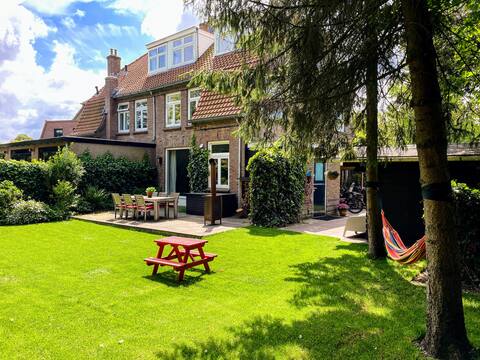
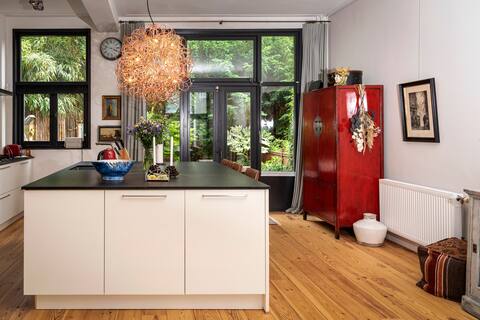
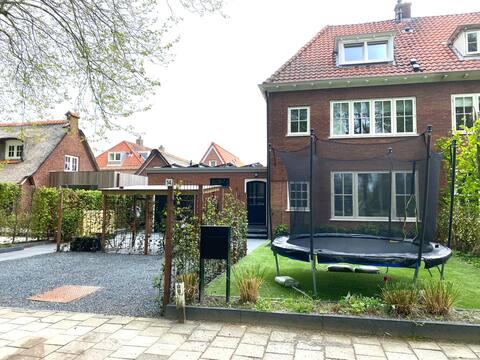
Top Performing Airbnb Properties in Bloemendaal (2025)
Benchmark your potential! Explore examples of top-performing Airbnb properties in Bloemendaalbased on Trailing Twelve Month (TTM) revenue. Analyze their characteristics, revenue, occupancy rate, and ADR to understand what drives success in this market.
Villa Dennenhoek
Entire Place • 5 bedrooms

Spacious&Charming family home near the beach
Entire Place • 5 bedrooms

Near Zandvoort aan Zee: Amsterdam Beach house
Entire Place • 2 bedrooms
Family home in green area Beach&Amsterdam
Entire Place • 4 bedrooms
Cozy family house close to Amsterdam and beach
Entire Place • 3 bedrooms
Modern house between Amsterdam and the beach :)
Entire Place • 5 bedrooms
Note: Performance varies based on location, size, amenities, seasonality, and management quality. Data reflects the past 12 months.
Top Performing Airbnb Hosts in Bloemendaal (2025)
Learn from the best! This table showcases top-performing Airbnb hosts in Bloemendaal based on the number of properties managed and estimated total revenue over the past year. Analyze their scale and performance metrics.
| Host Name | Properties | Grossing Revenue | Stay Reviews | Avg Rating |
|---|---|---|---|---|
| Bart | 1 | $228,522 | 3 | 5.00/5.0 |
| Bruno | 1 | $132,413 | 22 | 4.86/5.0 |
| Johanna Josetta | 1 | $76,076 | 117 | 4.77/5.0 |
| Petra | 2 | $64,413 | 49 | 4.91/5.0 |
| Annetje | 1 | $59,902 | 7 | 5.00/5.0 |
| Lotte | 2 | $59,658 | 17 | 4.28/5.0 |
| Huib | 1 | $56,832 | 11 | 5.00/5.0 |
| Host #63675493 | 1 | $54,966 | 11 | 5.00/5.0 |
| Francisca | 1 | $50,748 | 9 | 5.00/5.0 |
| Charlotte | 1 | $49,884 | 4 | 5.00/5.0 |
Analyzing the strategies of top hosts, such as their property selection, pricing, and guest communication, can offer valuable lessons for optimizing your own Airbnb operations in Bloemendaal.
Dive Deeper: Advanced Bloemendaal STR Market Data (2025)
Ready to unlock more insights? AirROI provides access to advanced metrics and comprehensive Airbnb data for Bloemendaal. Explore detailed analytics beyond this report to refine your investment strategy, optimize pricing, and maximize your vacation rental profits.
Explore Advanced MetricsBloemendaal Short-Term Rental Market Composition (2025): Property & Room Types
Room Type Distribution
Property Type Distribution
Market Composition Insights for Bloemendaal
- The Bloemendaal Airbnb market composition is heavily skewed towards Entire Home/Apt listings, which make up 91.9% of the 37 active rentals. This indicates strong guest preference for privacy and space.
- Looking at the property type distribution in Bloemendaal, House properties are the most common (67.6%), reflecting the local real estate landscape.
- Houses represent a significant 67.6% portion, catering likely to families or larger groups.
- The presence of 5.4% Hotel/Boutique listings indicates integration with traditional hospitality.
- Smaller segments like others (combined 2.7%) offer potential for unique stay experiences.
Bloemendaal Airbnb Room Capacity Analysis (2025): Bedroom Distribution
Distribution of Listings by Number of Bedrooms
Room Capacity Insights for Bloemendaal
- The dominant room capacity in Bloemendaal is 1 bedroom listings, making up 27% of the market. This suggests a strong demand for properties suitable for couples or solo travelers.
- Together, 1 bedroom and 3 bedrooms properties represent 51.3% of the active Airbnb listings in Bloemendaal, indicating a high concentration in these sizes.
- A significant 54.0% of listings offer 3+ bedrooms, catering to larger groups and families seeking more space in Bloemendaal.
Bloemendaal Vacation Rental Guest Capacity Trends (2025)
Distribution of Listings by Guest Capacity
Guest Capacity Insights for Bloemendaal
- The most common guest capacity trend in Bloemendaal vacation rentals is listings accommodating 2 guests (29.7%). This suggests the primary traveler segment is likely couples or solo travelers.
- Properties designed for 2 guests and 4 guests dominate the Bloemendaal STR market, accounting for 48.6% of listings.
- 29.7% of properties accommodate 6+ guests, serving the market segment for larger families or group travel in Bloemendaal.
- On average, properties in Bloemendaal are equipped to host 4.0 guests.
Bloemendaal Airbnb Booking Patterns (2025): Available vs. Booked Days
Available Days Distribution
Booked Days Distribution
Booking Pattern Insights for Bloemendaal
- The most common availability pattern in Bloemendaal falls within the 181-270 days range, representing 43.2% of listings. This suggests many properties have significant open periods on their calendars.
- Approximately 78.3% of listings show high availability (181+ days open annually), indicating potential for increased bookings or specific owner usage patterns.
- For booked days, the 91-180 days range is most frequent in Bloemendaal (40.5%), reflecting common guest stay durations or potential owner blocking patterns.
- A notable 27.0% of properties secure long booking periods (181+ days booked per year), highlighting successful long-term rental strategies or significant owner usage.
Bloemendaal Airbnb Minimum Stay Requirements Analysis
Distribution of Listings by Minimum Night Requirement
1 Night
5 listings
15.2% of total
2 Nights
9 listings
27.3% of total
3 Nights
3 listings
9.1% of total
4-6 Nights
11 listings
33.3% of total
7-29 Nights
3 listings
9.1% of total
30+ Nights
2 listings
6.1% of total
Key Insights
- The most prevalent minimum stay requirement in Bloemendaal is 4-6 Nights, adopted by 33.3% of listings. This highlights the market's preference for longer commitments.
Recommendations
- Align with the market by considering a 4-6 Nights minimum stay, as 33.3% of Bloemendaal hosts use this setting.
- If feasible, allowing 1-night stays, especially midweek or during low season, could capture last-minute bookings, as only 15.2% currently do.
- Explore offering discounts for stays of 30+ nights to attract the 6.1% of the market seeking extended stays.
- Adjust minimum nights based on seasonality – potentially shorter during low season and longer during peak demand periods in Bloemendaal.
Bloemendaal Airbnb Cancellation Policy Trends Analysis (2025)
Flexible
9 listings
27.3% of total
Moderate
7 listings
21.2% of total
Firm
11 listings
33.3% of total
Strict
6 listings
18.2% of total
Cancellation Policy Insights for Bloemendaal
- The prevailing Airbnb cancellation policy trend in Bloemendaal is Firm, used by 33.3% of listings.
- A majority (51.5%) of hosts in Bloemendaal utilize Firm or Strict policies, indicating a market where hosts prioritize booking security.
Recommendations for Hosts
- Consider adopting a Firm policy to align with the 33.3% market standard in Bloemendaal.
- Regularly review your cancellation policy against competitors and market demand shifts in Bloemendaal.
Bloemendaal STR Booking Lead Time Analysis (2025)
Average Booking Lead Time by Month
Booking Lead Time Insights for Bloemendaal
- The overall average booking lead time for vacation rentals in Bloemendaal is 76 days.
- Guests book furthest in advance for stays during May (average 117 days), likely coinciding with peak travel demand or local events.
- The shortest booking windows occur for stays in March (average 23 days), indicating more last-minute travel plans during this time.
- Seasonally, Summer (95 days avg.) sees the longest lead times, while Winter (72 days avg.) has the shortest, reflecting typical travel planning cycles.
Recommendations for Hosts
- Use the overall average lead time (76 days) as a baseline for your pricing and availability strategy in Bloemendaal.
- For May stays, consider implementing length-of-stay discounts or slightly higher rates for bookings made less than 117 days out to capitalize on advance planning.
- Target marketing efforts for the Summer season well in advance (at least 95 days) to capture early planners.
- Monitor your own booking lead times against these Bloemendaal averages to identify opportunities for dynamic pricing adjustments.
Popular & Essential Airbnb Amenities in Bloemendaal (2025)
Amenity Prevalence
Amenity Insights for Bloemendaal
- Essential amenities in Bloemendaal that guests expect include: Wifi. Lacking these (this) could significantly impact bookings.
- Popular amenities like Heating, Hot water, Smoke alarm are common but not universal. Offering these can provide a competitive edge.
Recommendations for Hosts
- Ensure your listing includes all essential amenities for Bloemendaal: Wifi.
- Consider adding popular differentiators like Heating or Hot water to increase appeal.
- Highlight unique or less common amenities you offer (e.g., hot tub, dedicated workspace, EV charger) in your listing description and photos.
- Regularly check competitor amenities in Bloemendaal to stay competitive.
Bloemendaal Airbnb Guest Demographics & Profile Analysis (2025)
Guest Profile Summary for Bloemendaal
- The typical guest profile for Airbnb in Bloemendaal consists of predominantly international visitors (85%), with top international origins including Netherlands, typically belonging to the Post-2000s (Gen Z/Alpha) group (50%), primarily speaking English or German.
- Domestic travelers account for 15.3% of guests.
- Key international markets include Germany (40.6%) and Netherlands (15.3%).
- Top languages spoken are English (43.8%) followed by German (25%).
- A significant demographic segment is the Post-2000s (Gen Z/Alpha) group, representing 50% of guests.
Recommendations for Hosts
- Focus marketing internationally, particularly towards travelers from Netherlands.
- Tailor amenities and listing descriptions to appeal to the dominant Post-2000s (Gen Z/Alpha) demographic (e.g., highlight fast WiFi, smart home features, local guides).
- Highlight unique local experiences or amenities relevant to the primary guest profile.
- Consider seasonal promotions aligned with peak travel times for key origin markets.
Nearby Short-Term Rental Market Comparison
How does the Bloemendaal Airbnb market stack up against its neighbors? Compare key performance metrics like average monthly revenue, ADR, and occupancy rates in surrounding areas to understand the broader regional STR landscape.
| Market | Active Properties | Monthly Revenue | Daily Rate | Avg. Occupancy |
|---|---|---|---|---|
| Kockengen | 12 | $7,560 | $396.31 | 61% |
| Bentveld | 13 | $4,798 | $443.61 | 54% |
| Halfweg | 17 | $4,307 | $231.13 | 55% |
| Aerdenhout | 17 | $4,288 | $694.02 | 53% |
| Merksplas | 10 | $3,885 | $256.59 | 44% |
| Oud Ade | 17 | $3,779 | $277.47 | 51% |
| Rijs | 27 | $3,772 | $356.97 | 45% |
| Zwanenburg | 24 | $3,720 | $240.77 | 66% |
| Kerkdriel | 25 | $3,607 | $323.16 | 40% |
| Brecht | 10 | $3,531 | $251.70 | 54% |