Bergen aan Zee Airbnb Market Analysis 2025: Short Term Rental Data & Vacation Rental Statistics in North Holland, Netherlands
Is Airbnb profitable in Bergen aan Zee in 2025? Explore comprehensive Airbnb analytics for Bergen aan Zee, North Holland, Netherlands to uncover income potential. This 2025 STR market report for Bergen aan Zee, based on AirROI data from April 2024 to March 2025, reveals key trends in the niche market of 33 active listings.
Whether you're considering an Airbnb investment in Bergen aan Zee, optimizing your existing vacation rental, or exploring rental arbitrage opportunities, understanding the Bergen aan Zee Airbnb data is crucial. Navigating the high regulation landscape is key to maximizing your short term rental income potential. Let's dive into the specifics.
Key Bergen aan Zee Airbnb Performance Metrics Overview
Monthly Airbnb Revenue Variations & Income Potential in Bergen aan Zee (2025)
Understanding the monthly revenue variations for Airbnb listings in Bergen aan Zee is key to maximizing your short term rental income potential. Seasonality significantly impacts earnings. Our analysis, based on data from the past 12 months, shows that the peak revenue month for STRs in Bergen aan Zee is typically August, while February often presents the lowest earnings, highlighting opportunities for strategic pricing adjustments during shoulder and low seasons. Explore the typical Airbnb income in Bergen aan Zee across different performance tiers:
- Best-in-class properties (Top 10%) achieve $6,936+ monthly, often utilizing dynamic pricing and superior guest experiences.
- Strong performing properties (Top 25%) earn $3,831 or more, indicating effective management and desirable locations/amenities.
- Typical properties (Median) generate around $2,151 per month, representing the average market performance.
- Entry-level properties (Bottom 25%) see earnings around $1,049, often with potential for optimization.
Average Monthly Airbnb Earnings Trend in Bergen aan Zee
Bergen aan Zee Airbnb Occupancy Rate Trends (2025)
Maximize your bookings by understanding the Bergen aan Zee STR occupancy trends. Seasonal demand shifts significantly influence how often properties are booked. Typically, Augustsees the highest demand (peak season occupancy), while February experiences the lowest (low season). Effective strategies, like adjusting minimum stays or offering promotions, can boost occupancy during slower periods. Here's how different property tiers perform in Bergen aan Zee:
- Best-in-class properties (Top 10%) achieve 68%+ occupancy, indicating high desirability and potentially optimized availability.
- Strong performing properties (Top 25%) maintain 49% or higher occupancy, suggesting good market fit and guest satisfaction.
- Typical properties (Median) have an occupancy rate around 25%.
- Entry-level properties (Bottom 25%) average 13% occupancy, potentially facing higher vacancy.
Average Monthly Occupancy Rate Trend in Bergen aan Zee
Average Daily Rate (ADR) Airbnb Trends in Bergen aan Zee (2025)
Effective short term rental pricing strategy in Bergen aan Zee involves understanding monthly ADR fluctuations. The Average Daily Rate (ADR) for Airbnb in Bergen aan Zee typically peaks in December and dips lowest during August. Leveraging Airbnb dynamic pricing tools or strategies based on this seasonality can significantly boost revenue. Here's a look at the typical nightly rates achieved:
- Best-in-class properties (Top 10%) command rates of $492+ per night, often due to premium features or locations.
- Strong performing properties (Top 25%) achieve nightly rates of $285 or more.
- Typical properties (Median) charge around $201 per night.
- Entry-level properties (Bottom 25%) earn around $160 per night.
Average Daily Rate (ADR) Trend by Month in Bergen aan Zee
Get Live Bergen aan Zee Market Intelligence 👇

Explore Real-time Analytics
Airbnb Seasonality Analysis & Trends in Bergen aan Zee (2025)
Peak Season (August, July, June)
- Revenue averages $5,401 per month
- Occupancy rates average 44.4%
- Daily rates average $254
Shoulder Season
- Revenue averages $2,775 per month
- Occupancy maintains around 33.9%
- Daily rates hold near $265
Low Season (January, February, March)
- Revenue drops to average $1,379 per month
- Occupancy decreases to average 20.9%
- Daily rates adjust to average $276
Seasonality Insights for Bergen aan Zee
- The Airbnb seasonality in Bergen aan Zee shows highly seasonal trends requiring careful strategy. While the sections above show seasonal averages, it's also insightful to look at the extremes:
- During the high season, the absolute peak month showcases Bergen aan Zee's highest earning potential, with monthly revenues capable of climbing to $6,622, occupancy reaching a high of 55.1%, and ADRs peaking at $284.
- Conversely, the slowest single month of the year, typically falling within the low season, marks the market's lowest point. In this month, revenue might dip to $822, occupancy could drop to 15.9%, and ADRs may adjust down to $251.
- Understanding both the seasonal averages and these monthly peaks and troughs in revenue, occupancy, and ADR is crucial for maximizing your Airbnb profit potential in Bergen aan Zee.
Seasonal Strategies for Maximizing Profit
- Peak Season: Maximize revenue through premium pricing and potentially longer minimum stays. Ensure high availability.
- Low Season: Offer competitive pricing, special promotions (e.g., extended stay discounts), and flexible cancellation policies. Target off-season travelers like remote workers or budget-conscious guests.
- Shoulder Seasons: Implement dynamic pricing that balances peak and low rates. Target weekend travelers or specific events. Offer slightly more flexible terms than peak season.
- Regularly analyze your own performance against these Bergen aan Zee seasonality benchmarks and adjust your pricing and availability strategy accordingly.
Best Areas for Airbnb Investment in Bergen aan Zee (2025)
Exploring the top neighborhoods for short-term rentals in Bergen aan Zee? This section highlights key areas, outlining why they are attractive for hosts and guests, along with notable local attractions. Consider these locations based on your target guest profile and investment strategy.
| Neighborhood / Area | Why Host Here? (Target Guests & Appeal) | Key Attractions & Landmarks |
|---|---|---|
| South Beach | Iconic area known for its sandy beaches and stunning sunsets, popular among beachgoers and vacationers looking for a relaxing getaway. | Bergen aan Zee Beach, Juttersmuseum (Beachcombers Museum), Plein 1945, Westerlicht Lighthouse, Sand Sculpture Festival, Nature Reserve Schoorlse Duinen |
| Bergen Village | Charming village with a rich history and artistic vibe. Ideal for tourists who enjoy local culture, art galleries, and quaint cafes. | Kunstmuseum Kranenkamp, Bergense Bos, Local art studios, Historic village center, Weekly markets |
| North Sea Coast | Beautiful coastline known for its natural beauty and outdoor activities, attracting nature lovers and families. | North Holland Dune Reserve, Birdwatching opportunities, Cycling routes, Water sports, Seaside restaurants |
| Bergen aan Zee Boulevard | Scenic promenade along the beach, perfect for strolls, dining, and enjoying the ocean views. | Beachfront cafes, Shopping areas, Bicycle rentals, Fishing opportunities, Event arenas |
| Schoorl | Famous for its dunes and natural landscapes, it attracts visitors looking for hiking and biking adventures. | Schoorlse Duinen National Park, Biking trails, Children's climbing park, Café-in-the-woods, Art during the summer months |
| Egmond aan Zee | A neighboring beach town that's popular with families for its family-friendly atmosphere and beach activities. | Egmond Abbey, Swimming at the beach, Seagull watching, Sandcastle competitions, Local ice cream parlors |
| Alkmaar | Nearby city famous for its cheese market and historic architecture, ideal for day trips from Bergen aan Zee. | Alkmaar Cheese Market, St. Lawrence Church, Historic warehouses, Cafes along canals, Shopping streets |
| Langedijk | Region located near Bergen aan Zee famous for its picturesque waterways, great for boating and scenic picnics. | Borndoen (Flower Decorations), Local vineyards, Canal tours, Fishing spots, Outdoor events |
Understanding Airbnb License Requirements & STR Laws in Bergen aan Zee (2025)
Yes, Bergen aan Zee, North Holland, Netherlands enforces high STR regulations. Obtaining a license and ensuring compliance is almost certainly required according to current 2025 STR laws. Always verify the latest short term rental regulations and Airbnb license requirements directly with local government authorities for Bergen aan Zee to ensure full compliance before hosting.
(Source: AirROI data, 2025, based on 76% licensed listings)
Top Performing Airbnb Properties in Bergen aan Zee (2025)
Benchmark your potential! Explore examples of top-performing Airbnb properties in Bergen aan Zeebased on Trailing Twelve Month (TTM) revenue. Analyze their characteristics, revenue, occupancy rate, and ADR to understand what drives success in this market.
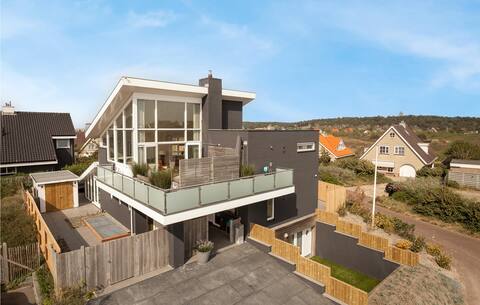
Villa by the sea
Entire Place • 5 bedrooms
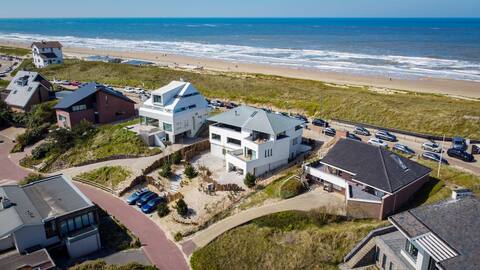
Beach villa Ulysses: 100 meters from the beach entrance
Entire Place • 5 bedrooms
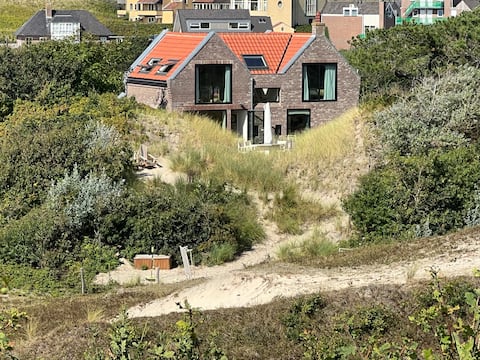
Beach House - Bergen aan Zee
Entire Place • 4 bedrooms

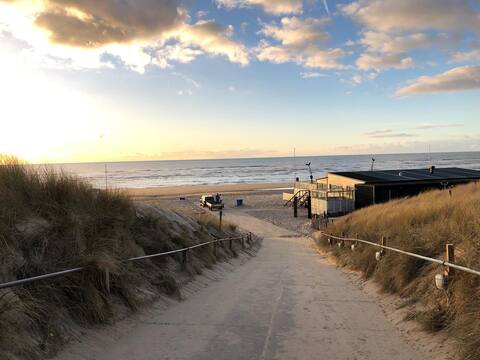
The Station
Entire Place • 5 bedrooms
Ruime woning in Bergen aan Zee
Entire Place • 6 bedrooms
Villa Parnassia: standard studio
Entire Place • 1 bedroom
Note: Performance varies based on location, size, amenities, seasonality, and management quality. Data reflects the past 12 months.
Top Performing Airbnb Hosts in Bergen aan Zee (2025)
Learn from the best! This table showcases top-performing Airbnb hosts in Bergen aan Zee based on the number of properties managed and estimated total revenue over the past year. Analyze their scale and performance metrics.
| Host Name | Properties | Grossing Revenue | Stay Reviews | Avg Rating |
|---|---|---|---|---|
| Novasol | 2 | $100,068 | 11 | 4.26/5.0 |
| Villa Parnassia | 3 | $86,180 | 17 | 4.86/5.0 |
| Marloes | 3 | $66,110 | 72 | 4.83/5.0 |
| Novasol | 3 | $65,304 | 11 | 2.53/5.0 |
| Remco | 1 | $65,052 | 6 | 5.00/5.0 |
| Poornima | 2 | $63,579 | 78 | 4.46/5.0 |
| Elsje And Duco | 1 | $58,070 | 6 | 5.00/5.0 |
| Novasol | 2 | $45,883 | 6 | 2.17/5.0 |
| Host #11302236 | 1 | $39,618 | 1 | 0.00/5.0 |
| Ulrike | 1 | $28,752 | 5 | 5.00/5.0 |
Analyzing the strategies of top hosts, such as their property selection, pricing, and guest communication, can offer valuable lessons for optimizing your own Airbnb operations in Bergen aan Zee.
Dive Deeper: Advanced Bergen aan Zee STR Market Data (2025)
Ready to unlock more insights? AirROI provides access to advanced metrics and comprehensive Airbnb data for Bergen aan Zee. Explore detailed analytics beyond this report to refine your investment strategy, optimize pricing, and maximize your vacation rental profits.
Explore Advanced MetricsBergen aan Zee Short-Term Rental Market Composition (2025): Property & Room Types
Room Type Distribution
Property Type Distribution
Market Composition Insights for Bergen aan Zee
- The Bergen aan Zee Airbnb market composition is heavily skewed towards Entire Home/Apt listings, which make up 97% of the 33 active rentals. This indicates strong guest preference for privacy and space.
- Looking at the property type distribution in Bergen aan Zee, Apartment/Condo properties are the most common (54.5%), reflecting the local real estate landscape.
- Houses represent a significant 45.5% portion, catering likely to families or larger groups.
Bergen aan Zee Airbnb Room Capacity Analysis (2025): Bedroom Distribution
Distribution of Listings by Number of Bedrooms
Room Capacity Insights for Bergen aan Zee
- The dominant room capacity in Bergen aan Zee is 2 bedrooms listings, making up 30.3% of the market. This suggests a strong demand for properties suitable for couples or solo travelers.
- Together, 2 bedrooms and 1 bedroom properties represent 51.5% of the active Airbnb listings in Bergen aan Zee, indicating a high concentration in these sizes.
- A significant 42.5% of listings offer 3+ bedrooms, catering to larger groups and families seeking more space in Bergen aan Zee.
Bergen aan Zee Vacation Rental Guest Capacity Trends (2025)
Distribution of Listings by Guest Capacity
Guest Capacity Insights for Bergen aan Zee
- The most common guest capacity trend in Bergen aan Zee vacation rentals is listings accommodating 4 guests (30.3%). This suggests the primary traveler segment is likely small families or groups.
- Properties designed for 4 guests and 2 guests dominate the Bergen aan Zee STR market, accounting for 57.6% of listings.
- 36.3% of properties accommodate 6+ guests, serving the market segment for larger families or group travel in Bergen aan Zee.
- On average, properties in Bergen aan Zee are equipped to host 4.7 guests.
Bergen aan Zee Airbnb Booking Patterns (2025): Available vs. Booked Days
Available Days Distribution
Booked Days Distribution
Booking Pattern Insights for Bergen aan Zee
- The most common availability pattern in Bergen aan Zee falls within the 271-366 days range, representing 54.5% of listings. This suggests many properties have significant open periods on their calendars.
- Approximately 93.9% of listings show high availability (181+ days open annually), indicating potential for increased bookings or specific owner usage patterns.
- For booked days, the 91-180 days range is most frequent in Bergen aan Zee (39.4%), reflecting common guest stay durations or potential owner blocking patterns.
- A notable 6.1% of properties secure long booking periods (181+ days booked per year), highlighting successful long-term rental strategies or significant owner usage.
Bergen aan Zee Airbnb Minimum Stay Requirements Analysis
Distribution of Listings by Minimum Night Requirement
1 Night
12 listings
41.4% of total
2 Nights
4 listings
13.8% of total
3 Nights
4 listings
13.8% of total
7-29 Nights
5 listings
17.2% of total
30+ Nights
4 listings
13.8% of total
Key Insights
- The most prevalent minimum stay requirement in Bergen aan Zee is 1 Night, adopted by 41.4% of listings. This highlights the market's preference for shorter, flexible bookings.
- A significant segment (13.8%) caters to monthly stays (30+ nights) in Bergen aan Zee, pointing to opportunities in the extended-stay market.
Recommendations
- Align with the market by considering a 1 Night minimum stay, as 41.4% of Bergen aan Zee hosts use this setting.
- Explore offering discounts for stays of 30+ nights to attract the 13.8% of the market seeking extended stays.
- Adjust minimum nights based on seasonality – potentially shorter during low season and longer during peak demand periods in Bergen aan Zee.
Bergen aan Zee Airbnb Cancellation Policy Trends Analysis (2025)
Super Strict 30 Days
2 listings
7.4% of total
Super Strict 60 Days
8 listings
29.6% of total
Moderate
2 listings
7.4% of total
Firm
6 listings
22.2% of total
Strict
9 listings
33.3% of total
Cancellation Policy Insights for Bergen aan Zee
- The prevailing Airbnb cancellation policy trend in Bergen aan Zee is Strict, used by 33.3% of listings.
- A majority (55.5%) of hosts in Bergen aan Zee utilize Firm or Strict policies, indicating a market where hosts prioritize booking security.
Recommendations for Hosts
- Consider adopting a Strict policy to align with the 33.3% market standard in Bergen aan Zee.
- With 33.3% using Strict terms, this is a viable option in Bergen aan Zee, particularly for high-value properties or during peak demand periods.
- Regularly review your cancellation policy against competitors and market demand shifts in Bergen aan Zee.
Bergen aan Zee STR Booking Lead Time Analysis (2025)
Average Booking Lead Time by Month
Booking Lead Time Insights for Bergen aan Zee
- The overall average booking lead time for vacation rentals in Bergen aan Zee is 77 days.
- Guests book furthest in advance for stays during May (average 138 days), likely coinciding with peak travel demand or local events.
- The shortest booking windows occur for stays in March (average 32 days), indicating more last-minute travel plans during this time.
- Seasonally, Summer (119 days avg.) sees the longest lead times, while Winter (64 days avg.) has the shortest, reflecting typical travel planning cycles.
Recommendations for Hosts
- Use the overall average lead time (77 days) as a baseline for your pricing and availability strategy in Bergen aan Zee.
- For May stays, consider implementing length-of-stay discounts or slightly higher rates for bookings made less than 138 days out to capitalize on advance planning.
- Target marketing efforts for the Summer season well in advance (at least 119 days) to capture early planners.
- Monitor your own booking lead times against these Bergen aan Zee averages to identify opportunities for dynamic pricing adjustments.
Popular & Essential Airbnb Amenities in Bergen aan Zee (2025)
Amenity Prevalence
Amenity Insights for Bergen aan Zee
- Essential amenities in Bergen aan Zee that guests expect include: Kitchen, Heating, TV. Lacking these (any) could significantly impact bookings.
- Popular amenities like Wifi, Private entrance, Refrigerator are common but not universal. Offering these can provide a competitive edge.
- Warning: Wifi is not universally provided but is considered essential globally. Ensure reliable Wifi is offered.
Recommendations for Hosts
- Ensure your listing includes all essential amenities for Bergen aan Zee: Kitchen, Heating, TV.
- Prioritize adding missing essentials: TV.
- Consider adding popular differentiators like Wifi or Private entrance to increase appeal.
- Highlight unique or less common amenities you offer (e.g., hot tub, dedicated workspace, EV charger) in your listing description and photos.
- Regularly check competitor amenities in Bergen aan Zee to stay competitive.
Bergen aan Zee Airbnb Guest Demographics & Profile Analysis (2025)
Guest Profile Summary for Bergen aan Zee
- The typical guest profile for Airbnb in Bergen aan Zee consists of predominantly international visitors (78%), with top international origins including Netherlands, typically belonging to the Post-2000s (Gen Z/Alpha) group (50%), primarily speaking English or German.
- Domestic travelers account for 21.8% of guests.
- Key international markets include Germany (71.8%) and Netherlands (21.8%).
- Top languages spoken are English (36.3%) followed by German (34.5%).
- A significant demographic segment is the Post-2000s (Gen Z/Alpha) group, representing 50% of guests.
Recommendations for Hosts
- Focus marketing internationally, particularly towards travelers from Netherlands.
- Tailor amenities and listing descriptions to appeal to the dominant Post-2000s (Gen Z/Alpha) demographic (e.g., highlight fast WiFi, smart home features, local guides).
- Highlight unique local experiences or amenities relevant to the primary guest profile.
- Consider seasonal promotions aligned with peak travel times for key origin markets.
Nearby Short-Term Rental Market Comparison
How does the Bergen aan Zee Airbnb market stack up against its neighbors? Compare key performance metrics like average monthly revenue, ADR, and occupancy rates in surrounding areas to understand the broader regional STR landscape.
| Market | Active Properties | Monthly Revenue | Daily Rate | Avg. Occupancy |
|---|---|---|---|---|
| Kockengen | 12 | $7,560 | $396.31 | 61% |
| Bentveld | 13 | $4,798 | $443.61 | 54% |
| Halfweg | 17 | $4,307 | $231.13 | 55% |
| Aerdenhout | 17 | $4,288 | $694.02 | 53% |
| Merksplas | 10 | $3,885 | $256.59 | 44% |
| Oud Ade | 17 | $3,779 | $277.47 | 51% |
| Rijs | 27 | $3,772 | $356.97 | 45% |
| Zwanenburg | 24 | $3,720 | $240.77 | 66% |
| Kerkdriel | 25 | $3,607 | $323.16 | 40% |
| Brecht | 10 | $3,531 | $251.70 | 54% |