Aerdenhout Airbnb Market Analysis 2025: Short Term Rental Data & Vacation Rental Statistics in North Holland, Netherlands
Is Airbnb profitable in Aerdenhout in 2025? Explore comprehensive Airbnb analytics for Aerdenhout, North Holland, Netherlands to uncover income potential. This 2025 STR market report for Aerdenhout, based on AirROI data from April 2024 to March 2025, reveals key trends in the niche market of 17 active listings.
Whether you're considering an Airbnb investment in Aerdenhout, optimizing your existing vacation rental, or exploring rental arbitrage opportunities, understanding the Aerdenhout Airbnb data is crucial. Leveraging the low regulation environment is key to maximizing your short term rental income potential. Let's dive into the specifics.
Key Aerdenhout Airbnb Performance Metrics Overview
Monthly Airbnb Revenue Variations & Income Potential in Aerdenhout (2025)
Understanding the monthly revenue variations for Airbnb listings in Aerdenhout is key to maximizing your short term rental income potential. Seasonality significantly impacts earnings. Our analysis, based on data from the past 12 months, shows that the peak revenue month for STRs in Aerdenhout is typically November, while March often presents the lowest earnings, highlighting opportunities for strategic pricing adjustments during shoulder and low seasons. Explore the typical Airbnb income in Aerdenhout across different performance tiers:
- Best-in-class properties (Top 10%) achieve $14,566+ monthly, often utilizing dynamic pricing and superior guest experiences.
- Strong performing properties (Top 25%) earn $9,797 or more, indicating effective management and desirable locations/amenities.
- Typical properties (Median) generate around $6,028 per month, representing the average market performance.
- Entry-level properties (Bottom 25%) see earnings around $3,805, often with potential for optimization.
Average Monthly Airbnb Earnings Trend in Aerdenhout
Aerdenhout Airbnb Occupancy Rate Trends (2025)
Maximize your bookings by understanding the Aerdenhout STR occupancy trends. Seasonal demand shifts significantly influence how often properties are booked. Typically, Septembersees the highest demand (peak season occupancy), while January experiences the lowest (low season). Effective strategies, like adjusting minimum stays or offering promotions, can boost occupancy during slower periods. Here's how different property tiers perform in Aerdenhout:
- Best-in-class properties (Top 10%) achieve 74%+ occupancy, indicating high desirability and potentially optimized availability.
- Strong performing properties (Top 25%) maintain 63% or higher occupancy, suggesting good market fit and guest satisfaction.
- Typical properties (Median) have an occupancy rate around 48%.
- Entry-level properties (Bottom 25%) average 25% occupancy, potentially facing higher vacancy.
Average Monthly Occupancy Rate Trend in Aerdenhout
Average Daily Rate (ADR) Airbnb Trends in Aerdenhout (2025)
Effective short term rental pricing strategy in Aerdenhout involves understanding monthly ADR fluctuations. The Average Daily Rate (ADR) for Airbnb in Aerdenhout typically peaks in April and dips lowest during March. Leveraging Airbnb dynamic pricing tools or strategies based on this seasonality can significantly boost revenue. Here's a look at the typical nightly rates achieved:
- Best-in-class properties (Top 10%) command rates of $1,802+ per night, often due to premium features or locations.
- Strong performing properties (Top 25%) achieve nightly rates of $874 or more.
- Typical properties (Median) charge around $409 per night.
- Entry-level properties (Bottom 25%) earn around $303 per night.
Average Daily Rate (ADR) Trend by Month in Aerdenhout
Get Live Aerdenhout Market Intelligence 👇

Explore Real-time Analytics
Airbnb Seasonality Analysis & Trends in Aerdenhout (2025)
Peak Season (November, July, September)
- Revenue averages $11,573 per month
- Occupancy rates average 40.9%
- Daily rates average $773
Shoulder Season
- Revenue averages $7,988 per month
- Occupancy maintains around 51.0%
- Daily rates hold near $791
Low Season (January, March, December)
- Revenue drops to average $3,248 per month
- Occupancy decreases to average 22.4%
- Daily rates adjust to average $609
Seasonality Insights for Aerdenhout
- The Airbnb seasonality in Aerdenhout shows highly seasonal trends requiring careful strategy. While the sections above show seasonal averages, it's also insightful to look at the extremes:
- During the high season, the absolute peak month showcases Aerdenhout's highest earning potential, with monthly revenues capable of climbing to $12,792, occupancy reaching a high of 66.9%, and ADRs peaking at $839.
- Conversely, the slowest single month of the year, typically falling within the low season, marks the market's lowest point. In this month, revenue might dip to $1,802, occupancy could drop to 0.0%, and ADRs may adjust down to $595.
- Understanding both the seasonal averages and these monthly peaks and troughs in revenue, occupancy, and ADR is crucial for maximizing your Airbnb profit potential in Aerdenhout.
Seasonal Strategies for Maximizing Profit
- Peak Season: Maximize revenue through premium pricing and potentially longer minimum stays. Ensure high availability.
- Low Season: Offer competitive pricing, special promotions (e.g., extended stay discounts), and flexible cancellation policies. Target off-season travelers like remote workers or budget-conscious guests.
- Shoulder Seasons: Implement dynamic pricing that balances peak and low rates. Target weekend travelers or specific events. Offer slightly more flexible terms than peak season.
- Regularly analyze your own performance against these Aerdenhout seasonality benchmarks and adjust your pricing and availability strategy accordingly.
Best Areas for Airbnb Investment in Aerdenhout (2025)
Exploring the top neighborhoods for short-term rentals in Aerdenhout? This section highlights key areas, outlining why they are attractive for hosts and guests, along with notable local attractions. Consider these locations based on your target guest profile and investment strategy.
| Neighborhood / Area | Why Host Here? (Target Guests & Appeal) | Key Attractions & Landmarks |
|---|---|---|
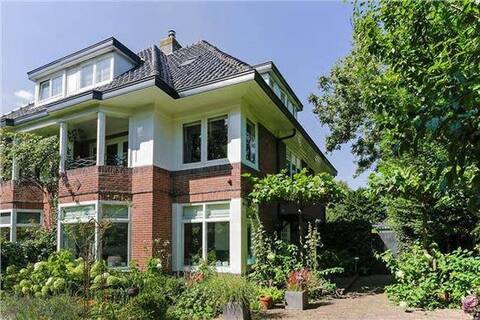
| Aerdenhout Village | Charming village atmosphere with historic houses and beautiful parks. Attracts families and tourists looking for a peaceful retreat while being close to urban amenities. | Dutch Reformed Church, Aerdenhoutse Windmill, Leidsevaart, Huis ter Kleef |
| Zandvoort Beach | Popular beach destination known for its sandy shores and vibrant seaside activities. Ideal for tourists seeking a beach vacation with water sports and nightlife. | Zandvoort Strand, Circuit Park Zandvoort, Zandvoort aan Zee, Beach clubs and restaurants |
| Haarlem City | Cultural hub with a rich history, museums, and shopping opportunities. Attracts those interested in art, culture, and urban experiences. | Frans Hals Museum, Grote Markt, Teylers Museum, Haarlem's hofjes |
| Bloemendaal | Affluent coastal town known for its upscale beach clubs and natural surroundings. Attracts visitors looking for a more exclusive beach experience. | Bloemendaal aan Zee, Beech House, National Park Zuid Kennemerland |
| North Sea Canal | Scenic area with picturesque waterways and cycling paths, ideal for nature lovers and outdoor enthusiasts. | North Sea Canal cycling routes, Scenic views, Various nature reserves |
| Lisse | Famous for the Keukenhof gardens and floral displays, attracting tourists especially during springtime for flower viewing. | Keukenhof Gardens, Flower fields, Lisse museum |
| Santpoort-Zuid | Peaceful suburb known for its historical architecture and green spaces, perfect for family stays. | Santpoort Castle, Amsterdamse Waterleidingduinen, Old village charm |
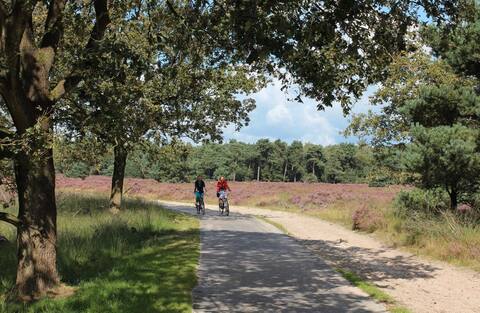
| Dutch Dunes | Beautiful natural area providing opportunities for hiking and nature activities, suitable for travelers looking for outdoor adventures. | Dunes of Kennemerland, Wildlife viewing, Hiking trails |
Understanding Airbnb License Requirements & STR Laws in Aerdenhout (2025)
While Aerdenhout, North Holland, Netherlands currently shows low STR regulations, specific Airbnb license requirements might still exist or change. Always verify the latest short term rental regulations and Airbnb license requirements directly with local government authorities for Aerdenhout to ensure full compliance before hosting.
(Source: AirROI data, 2025, finding no licensed listings among those analyzed)
Top Performing Airbnb Properties in Aerdenhout (2025)
Benchmark your potential! Explore examples of top-performing Airbnb properties in Aerdenhoutbased on Trailing Twelve Month (TTM) revenue. Analyze their characteristics, revenue, occupancy rate, and ADR to understand what drives success in this market.

Villa met zwembad en jacuzzi
Entire Place ��• 7 bedrooms

Very luxury holiday villa with large indoor pool
Entire Place • 6 bedrooms
House near Zandvoort Beach/Circuit & Amsterdam
Entire Place • 4 bedrooms

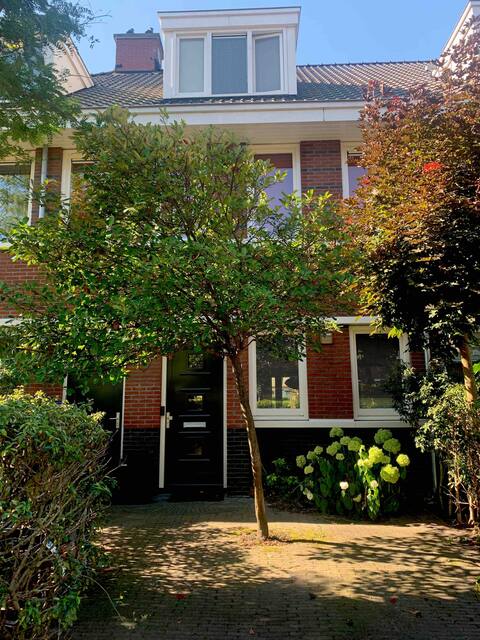
Spacious family townhouse near beach, dunes, Haarlem
Entire Place • 3 bedrooms
Beautiful Villa Close to Beach/Amsterdam/Nature
Entire Place • 5 bedrooms
Spacious family house, close to the sea, dunes and Amsterdam
Entire Place • 3 bedrooms
Note: Performance varies based on location, size, amenities, seasonality, and management quality. Data reflects the past 12 months.
Top Performing Airbnb Hosts in Aerdenhout (2025)
Learn from the best! This table showcases top-performing Airbnb hosts in Aerdenhout based on the number of properties managed and estimated total revenue over the past year. Analyze their scale and performance metrics.
| Host Name | Properties | Grossing Revenue | Stay Reviews | Avg Rating |
|---|---|---|---|---|
| Host #142433954 | 1 | $138,899 | 28 | 4.79/5.0 |
| X. | 1 | $122,943 | 10 | 5.00/5.0 |
| Arienne | 1 | $118,711 | 25 | 4.88/5.0 |
| Sander | 1 | $106,617 | 15 | 4.93/5.0 |
| Simon | 1 | $86,479 | 33 | 4.94/5.0 |
| Isabella | 1 | $52,603 | 10 | 5.00/5.0 |
| Femke | 1 | $47,338 | 13 | 5.00/5.0 |
| Host #345000873 | 1 | $37,642 | 2 | 0.00/5.0 |
| Host #134203015 | 1 | $31,884 | 1 | 0.00/5.0 |
| Sophie | 1 | $28,813 | 11 | 5.00/5.0 |
Analyzing the strategies of top hosts, such as their property selection, pricing, and guest communication, can offer valuable lessons for optimizing your own Airbnb operations in Aerdenhout.
Dive Deeper: Advanced Aerdenhout STR Market Data (2025)
Ready to unlock more insights? AirROI provides access to advanced metrics and comprehensive Airbnb data for Aerdenhout. Explore detailed analytics beyond this report to refine your investment strategy, optimize pricing, and maximize your vacation rental profits.
Explore Advanced MetricsAerdenhout Short-Term Rental Market Composition (2025): Property & Room Types
Room Type Distribution
Property Type Distribution
Market Composition Insights for Aerdenhout
- The Aerdenhout Airbnb market composition is heavily skewed towards Entire Home/Apt listings, which make up 100% of the 17 active rentals. This indicates strong guest preference for privacy and space.
- Looking at the property type distribution in Aerdenhout, House properties are the most common (94.1%), reflecting the local real estate landscape.
- Houses represent a significant 94.1% portion, catering likely to families or larger groups.
Aerdenhout Airbnb Room Capacity Analysis (2025): Bedroom Distribution
Distribution of Listings by Number of Bedrooms
Room Capacity Insights for Aerdenhout
- The dominant room capacity in Aerdenhout is 4 bedrooms listings, making up 41.2% of the market. This suggests a strong demand for properties suitable for families or small groups.
- Together, 4 bedrooms and 5+ bedrooms properties represent 64.7% of the active Airbnb listings in Aerdenhout, indicating a high concentration in these sizes.
- A significant 82.3% of listings offer 3+ bedrooms, catering to larger groups and families seeking more space in Aerdenhout.
Aerdenhout Vacation Rental Guest Capacity Trends (2025)
Distribution of Listings by Guest Capacity
Guest Capacity Insights for Aerdenhout
- The most common guest capacity trend in Aerdenhout vacation rentals is listings accommodating 6 guests (29.4%). This suggests the primary traveler segment is likely larger groups.
- Properties designed for 6 guests and 4 guests dominate the Aerdenhout STR market, accounting for 52.9% of listings.
- 58.8% of properties accommodate 6+ guests, serving the market segment for larger families or group travel in Aerdenhout.
- On average, properties in Aerdenhout are equipped to host 5.7 guests.
Aerdenhout Airbnb Booking Patterns (2025): Available vs. Booked Days
Available Days Distribution
Booked Days Distribution
Booking Pattern Insights for Aerdenhout
- The most common availability pattern in Aerdenhout falls within the 271-366 days range, representing 58.8% of listings. This suggests many properties have significant open periods on their calendars.
- Approximately 88.2% of listings show high availability (181+ days open annually), indicating potential for increased bookings or specific owner usage patterns.
- For booked days, the 31-90 days range is most frequent in Aerdenhout (41.2%), reflecting common guest stay durations or potential owner blocking patterns.
- A notable 11.8% of properties secure long booking periods (181+ days booked per year), highlighting successful long-term rental strategies or significant owner usage.
Aerdenhout Airbnb Minimum Stay Requirements Analysis
Distribution of Listings by Minimum Night Requirement
2 Nights
1 listings
6.7% of total
3 Nights
3 listings
20% of total
4-6 Nights
8 listings
53.3% of total
7-29 Nights
2 listings
13.3% of total
30+ Nights
1 listings
6.7% of total
Key Insights
- The most prevalent minimum stay requirement in Aerdenhout is 4-6 Nights, adopted by 53.3% of listings. This highlights the market's preference for longer commitments.
- Very short stays (1-2 nights) are less common (6.7%), suggesting hosts prefer slightly longer bookings to optimize turnover.
Recommendations
- Align with the market by considering a 4-6 Nights minimum stay, as 53.3% of Aerdenhout hosts use this setting.
- Explore offering discounts for stays of 30+ nights to attract the 6.7% of the market seeking extended stays.
- Adjust minimum nights based on seasonality – potentially shorter during low season and longer during peak demand periods in Aerdenhout.
Aerdenhout Airbnb Cancellation Policy Trends Analysis (2025)
Flexible
4 listings
33.3% of total
Moderate
5 listings
41.7% of total
Firm
2 listings
16.7% of total
Strict
1 listings
8.3% of total
Cancellation Policy Insights for Aerdenhout
- The prevailing Airbnb cancellation policy trend in Aerdenhout is Moderate, used by 41.7% of listings.
- The market strongly favors guest-friendly terms, with 75.0% of listings offering Flexible or Moderate policies. This suggests guests in Aerdenhout may expect booking flexibility.
- Strict cancellation policies are quite rare (8.3%), potentially making listings with this policy less competitive unless justified by high demand or property type.
Recommendations for Hosts
- Consider adopting a Moderate policy to align with the 41.7% market standard in Aerdenhout.
- Using a Strict policy might deter some guests, as only 8.3% of listings use it. Evaluate if potential revenue protection outweighs possible lower booking rates.
- Regularly review your cancellation policy against competitors and market demand shifts in Aerdenhout.
Aerdenhout STR Booking Lead Time Analysis (2025)
Average Booking Lead Time by Month
Booking Lead Time Insights for Aerdenhout
- The overall average booking lead time for vacation rentals in Aerdenhout is 100 days.
- Guests book furthest in advance for stays during October (average 136 days), likely coinciding with peak travel demand or local events.
- The shortest booking windows occur for stays in February (average 0 days), indicating more last-minute travel plans during this time.
- Seasonally, Summer (113 days avg.) sees the longest lead times, while Spring (44 days avg.) has the shortest, reflecting typical travel planning cycles.
Recommendations for Hosts
- Use the overall average lead time (100 days) as a baseline for your pricing and availability strategy in Aerdenhout.
- For October stays, consider implementing length-of-stay discounts or slightly higher rates for bookings made less than 136 days out to capitalize on advance planning.
- During February, focus on last-minute booking availability and promotions, as guests book with very short notice (0 days avg.).
- Target marketing efforts for the Summer season well in advance (at least 113 days) to capture early planners.
- Monitor your own booking lead times against these Aerdenhout averages to identify opportunities for dynamic pricing adjustments.
Popular & Essential Airbnb Amenities in Aerdenhout (2025)
Amenity Prevalence
Amenity Insights for Aerdenhout
- Essential amenities in Aerdenhout that guests expect include: Hot water, Heating, Wifi. Lacking these (any) could significantly impact bookings.
- Popular amenities like Essentials, Dedicated workspace, Dishes and silverware are common but not universal. Offering these can provide a competitive edge.
Recommendations for Hosts
- Ensure your listing includes all essential amenities for Aerdenhout: Hot water, Heating, Wifi.
- Consider adding popular differentiators like Essentials or Dedicated workspace to increase appeal.
- Highlight unique or less common amenities you offer (e.g., hot tub, dedicated workspace, EV charger) in your listing description and photos.
- Regularly check competitor amenities in Aerdenhout to stay competitive.
Aerdenhout Airbnb Guest Demographics & Profile Analysis (2025)
Guest Profile Summary for Aerdenhout
- The typical guest profile for Airbnb in Aerdenhout consists of predominantly international visitors (97%), with top international origins including United States, typically belonging to the Post-2000s (Gen Z/Alpha) group (50%), primarily speaking English or German.
- Domestic travelers account for 3.5% of guests.
- Key international markets include Germany (19.3%) and United States (19.3%).
- Top languages spoken are English (43.1%) followed by German (19%).
- A significant demographic segment is the Post-2000s (Gen Z/Alpha) group, representing 50% of guests.
Recommendations for Hosts
- Focus marketing internationally, particularly towards travelers from United States.
- Tailor amenities and listing descriptions to appeal to the dominant Post-2000s (Gen Z/Alpha) demographic (e.g., highlight fast WiFi, smart home features, local guides).
- Highlight unique local experiences or amenities relevant to the primary guest profile.
- Consider seasonal promotions aligned with peak travel times for key origin markets.
Nearby Short-Term Rental Market Comparison
How does the Aerdenhout Airbnb market stack up against its neighbors? Compare key performance metrics like average monthly revenue, ADR, and occupancy rates in surrounding areas to understand the broader regional STR landscape.
| Market | Active Properties | Monthly Revenue | Daily Rate | Avg. Occupancy |
|---|---|---|---|---|
| Kockengen | 12 | $7,560 | $396.31 | 61% |
| Bentveld | 13 | $4,798 | $443.61 | 54% |
| Halfweg | 17 | $4,307 | $231.13 | 55% |
| Merksplas | 10 | $3,885 | $256.59 | 44% |
| Oud Ade | 17 | $3,779 | $277.47 | 51% |
| Rijs | 27 | $3,772 | $356.97 | 45% |
| Zwanenburg | 24 | $3,720 | $240.77 | 66% |
| Kerkdriel | 25 | $3,607 | $323.16 | 40% |
| Brecht | 10 | $3,531 | $251.70 | 54% |
| Kortenhoef | 15 | $3,495 | $255.48 | 53% |