Nistelrode Airbnb Market Analysis 2025: Short Term Rental Data & Vacation Rental Statistics in North Brabant, Netherlands
Is Airbnb profitable in Nistelrode in 2025? Explore comprehensive Airbnb analytics for Nistelrode, North Brabant, Netherlands to uncover income potential. This 2025 STR market report for Nistelrode, based on AirROI data from April 2024 to March 2025, reveals key trends in the niche market of 21 active listings.
Whether you're considering an Airbnb investment in Nistelrode, optimizing your existing vacation rental, or exploring rental arbitrage opportunities, understanding the Nistelrode Airbnb data is crucial. Leveraging the low regulation environment is key to maximizing your short term rental income potential. Let's dive into the specifics.
Key Nistelrode Airbnb Performance Metrics Overview
Monthly Airbnb Revenue Variations & Income Potential in Nistelrode (2025)
Understanding the monthly revenue variations for Airbnb listings in Nistelrode is key to maximizing your short term rental income potential. Seasonality significantly impacts earnings. Our analysis, based on data from the past 12 months, shows that the peak revenue month for STRs in Nistelrode is typically December, while March often presents the lowest earnings, highlighting opportunities for strategic pricing adjustments during shoulder and low seasons. Explore the typical Airbnb income in Nistelrode across different performance tiers:
- Best-in-class properties (Top 10%) achieve $5,870+ monthly, often utilizing dynamic pricing and superior guest experiences.
- Strong performing properties (Top 25%) earn $3,209 or more, indicating effective management and desirable locations/amenities.
- Typical properties (Median) generate around $1,422 per month, representing the average market performance.
- Entry-level properties (Bottom 25%) see earnings around $562, often with potential for optimization.
Average Monthly Airbnb Earnings Trend in Nistelrode
Nistelrode Airbnb Occupancy Rate Trends (2025)
Maximize your bookings by understanding the Nistelrode STR occupancy trends. Seasonal demand shifts significantly influence how often properties are booked. Typically, Decembersees the highest demand (peak season occupancy), while March experiences the lowest (low season). Effective strategies, like adjusting minimum stays or offering promotions, can boost occupancy during slower periods. Here's how different property tiers perform in Nistelrode:
- Best-in-class properties (Top 10%) achieve 86%+ occupancy, indicating high desirability and potentially optimized availability.
- Strong performing properties (Top 25%) maintain 67% or higher occupancy, suggesting good market fit and guest satisfaction.
- Typical properties (Median) have an occupancy rate around 40%.
- Entry-level properties (Bottom 25%) average 17% occupancy, potentially facing higher vacancy.
Average Monthly Occupancy Rate Trend in Nistelrode
Average Daily Rate (ADR) Airbnb Trends in Nistelrode (2025)
Effective short term rental pricing strategy in Nistelrode involves understanding monthly ADR fluctuations. The Average Daily Rate (ADR) for Airbnb in Nistelrode typically peaks in May and dips lowest during November. Leveraging Airbnb dynamic pricing tools or strategies based on this seasonality can significantly boost revenue. Here's a look at the typical nightly rates achieved:
- Best-in-class properties (Top 10%) command rates of $280+ per night, often due to premium features or locations.
- Strong performing properties (Top 25%) achieve nightly rates of $228 or more.
- Typical properties (Median) charge around $135 per night.
- Entry-level properties (Bottom 25%) earn around $82 per night.
Average Daily Rate (ADR) Trend by Month in Nistelrode
Get Live Nistelrode Market Intelligence 👇

Explore Real-time Analytics
Airbnb Seasonality Analysis & Trends in Nistelrode (2025)
Peak Season (December, November, October)
- Revenue averages $2,970 per month
- Occupancy rates average 44.1%
- Daily rates average $169
Shoulder Season
- Revenue averages $2,360 per month
- Occupancy maintains around 48.3%
- Daily rates hold near $178
Low Season (February, March, September)
- Revenue drops to average $1,730 per month
- Occupancy decreases to average 35.0%
- Daily rates adjust to average $169
Seasonality Insights for Nistelrode
- The Airbnb seasonality in Nistelrode shows highly seasonal trends requiring careful strategy. While the sections above show seasonal averages, it's also insightful to look at the extremes:
- During the high season, the absolute peak month showcases Nistelrode's highest earning potential, with monthly revenues capable of climbing to $3,097, occupancy reaching a high of 52.4%, and ADRs peaking at $182.
- Conversely, the slowest single month of the year, typically falling within the low season, marks the market's lowest point. In this month, revenue might dip to $1,402, occupancy could drop to 28.0%, and ADRs may adjust down to $158.
- Understanding both the seasonal averages and these monthly peaks and troughs in revenue, occupancy, and ADR is crucial for maximizing your Airbnb profit potential in Nistelrode.
Seasonal Strategies for Maximizing Profit
- Peak Season: Maximize revenue through premium pricing and potentially longer minimum stays. Ensure high availability.
- Low Season: Offer competitive pricing, special promotions (e.g., extended stay discounts), and flexible cancellation policies. Target off-season travelers like remote workers or budget-conscious guests.
- Shoulder Seasons: Implement dynamic pricing that balances peak and low rates. Target weekend travelers or specific events. Offer slightly more flexible terms than peak season.
- Regularly analyze your own performance against these Nistelrode seasonality benchmarks and adjust your pricing and availability strategy accordingly.
Best Areas for Airbnb Investment in Nistelrode (2025)
Exploring the top neighborhoods for short-term rentals in Nistelrode? This section highlights key areas, outlining why they are attractive for hosts and guests, along with notable local attractions. Consider these locations based on your target guest profile and investment strategy.
| Neighborhood / Area | Why Host Here? (Target Guests & Appeal) | Key Attractions & Landmarks |
|---|---|---|
| Nistelrode Center | Central area with easy access to local amenities and attractions. Ideal for travelers looking for convenience and a local experience. | Local Restaurants, Nistelrode Church, Shopping District |
| Breda | A nearby vibrant city offering a mix of culture, shopping, and nightlife. Attractive for visitors wanting a more urban experience close to Nistelrode. | Breda Castle, Grote Kerk, Kasteel van Breda, Shopping Streets, Museums |
| Oss | Nearby town with historical significance and local charm. Good for guests seeking a quieter stay with easy access to larger cities. | Oss History Museum, St. Pieter Church, Local Parks |
| Den Bosch | Historic city known for its medieval architecture and culinary scene, it draws visitors interested in culture and history. | St. John's Cathedral, Bosch Art Center, Historic Market Squares |
| Uden | A larger town with shopping and dining options. A great spot for travelers who want to explore the countryside and nearby attractions. | Museum of Uden, Shopping Center, Nature Reserves |
| Heesch | A quaint village with a relaxed atmosphere. Attractive for families and travelers looking for a peaceful retreat. | Local Parks, Village Events, Historic Sites |
| Sint-Oedenrode | Charming town known for its beautiful landscapes and rustic charm. Great for nature lovers and those looking for tranquility. | Nature Reserves, Historic Center |
| Kaatsheuvel | Home to Efteling, one of Europe’s most famous theme parks. Ideal for families and tourists looking for exciting attractions. | Efteling Theme Park, Local Family Activities |
Understanding Airbnb License Requirements & STR Laws in Nistelrode (2025)
While Nistelrode, North Brabant, Netherlands currently shows low STR regulations, specific Airbnb license requirements might still exist or change. Always verify the latest short term rental regulations and Airbnb license requirements directly with local government authorities for Nistelrode to ensure full compliance before hosting.
(Source: AirROI data, 2025, based on 5% licensed listings)
Top Performing Airbnb Properties in Nistelrode (2025)
Benchmark your potential! Explore examples of top-performing Airbnb properties in Nistelrodebased on Trailing Twelve Month (TTM) revenue. Analyze their characteristics, revenue, occupancy rate, and ADR to understand what drives success in this market.
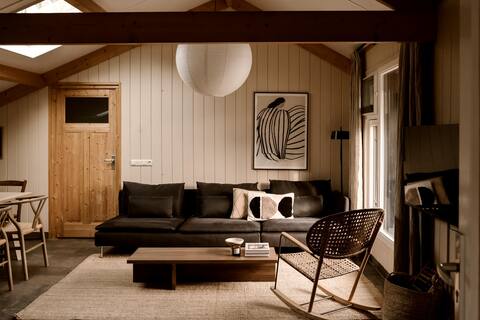
Getaway- Farm House + hottub
Entire Place • 3 bedrooms
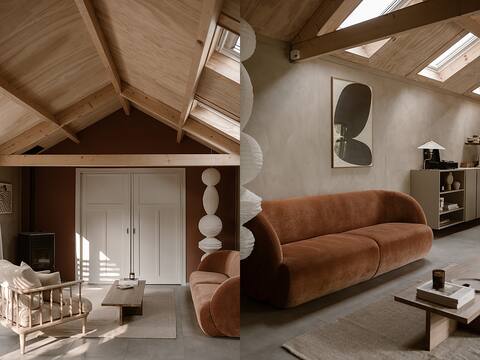
Getaway - Sheep House + Detached Bath & Hottub
Entire Place • 1 bedroom
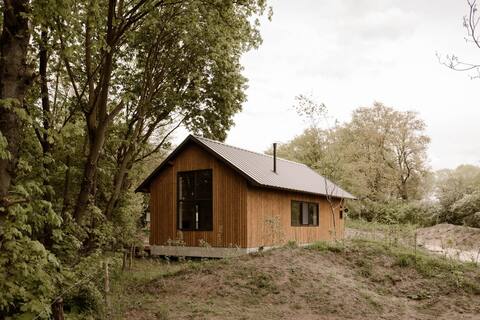
Oak House detached bath & hottub (biofuel)
Entire Place • 2 bedrooms

Generous 136m² Two-Bedroom Apartment (PS-18)
Entire Place • 2 bedrooms
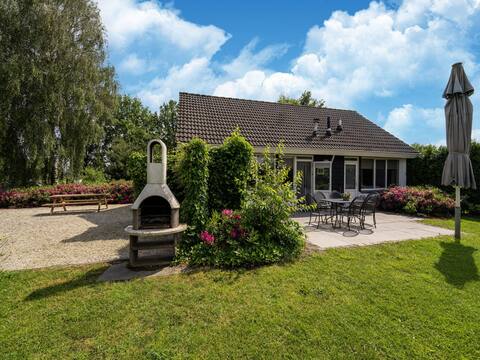
Holiday home near the centre with view
Entire Place • 5 bedrooms
BnB Benji - Cozy cottage in the Maashorst
Entire Place • 1 bedroom
Note: Performance varies based on location, size, amenities, seasonality, and management quality. Data reflects the past 12 months.
Top Performing Airbnb Hosts in Nistelrode (2025)
Learn from the best! This table showcases top-performing Airbnb hosts in Nistelrode based on the number of properties managed and estimated total revenue over the past year. Analyze their scale and performance metrics.
| Host Name | Properties | Grossing Revenue | Stay Reviews | Avg Rating |
|---|---|---|---|---|
| Leonne & Sander | 5 | $195,291 | 488 | 1.97/5.0 |
| Rene | 4 | $34,764 | 103 | 4.68/5.0 |
| Eric | 1 | $29,609 | 4 | 5.00/5.0 |
| Tamara - BELVILLA | 2 | $29,202 | 7 | 4.21/5.0 |
| Niek | 1 | $20,545 | 69 | 4.97/5.0 |
| Rick | 2 | $16,528 | 15 | 2.50/5.0 |
| Martin | 1 | $15,482 | 6 | 4.83/5.0 |
| Kampeerbeleving | 3 | $11,058 | 12 | 1.63/5.0 |
| Host #433767824 | 1 | $2,291 | 0 | 0.00/5.0 |
| Host #97757115 | 1 | $1,455 | 18 | 4.50/5.0 |
Analyzing the strategies of top hosts, such as their property selection, pricing, and guest communication, can offer valuable lessons for optimizing your own Airbnb operations in Nistelrode.
Dive Deeper: Advanced Nistelrode STR Market Data (2025)
Ready to unlock more insights? AirROI provides access to advanced metrics and comprehensive Airbnb data for Nistelrode. Explore detailed analytics beyond this report to refine your investment strategy, optimize pricing, and maximize your vacation rental profits.
Explore Advanced MetricsNistelrode Short-Term Rental Market Composition (2025): Property & Room Types
Room Type Distribution
Property Type Distribution
Market Composition Insights for Nistelrode
- The Nistelrode Airbnb market composition is heavily skewed towards Entire Home/Apt listings, which make up 61.9% of the 21 active rentals. This indicates strong guest preference for privacy and space.
- However, a notable 38.1% share for Private Rooms suggests opportunities for budget-conscious travelers or hosts renting out spare rooms.
- Looking at the property type distribution in Nistelrode, House properties are the most common (33.3%), reflecting the local real estate landscape.
- Houses represent a significant 33.3% portion, catering likely to families or larger groups.
- The presence of 19% Hotel/Boutique listings indicates integration with traditional hospitality.
- Smaller segments like unique stays (combined 4.8%) offer potential for unique stay experiences.
Nistelrode Airbnb Room Capacity Analysis (2025): Bedroom Distribution
Distribution of Listings by Number of Bedrooms
Room Capacity Insights for Nistelrode
- The dominant room capacity in Nistelrode is 1 bedroom listings, making up 61.9% of the market. This suggests a strong demand for properties suitable for couples or solo travelers.
- Together, 1 bedroom and 2 bedrooms properties represent 80.9% of the active Airbnb listings in Nistelrode, indicating a high concentration in these sizes.
- With over half the market (61.9%) consisting of studios or 1-bedroom units, Nistelrode is particularly well-suited for individuals or couples.
Nistelrode Vacation Rental Guest Capacity Trends (2025)
Distribution of Listings by Guest Capacity
Guest Capacity Insights for Nistelrode
- The most common guest capacity trend in Nistelrode vacation rentals is listings accommodating 2 guests (57.1%). This suggests the primary traveler segment is likely couples or solo travelers.
- Properties designed for 2 guests and 4 guests dominate the Nistelrode STR market, accounting for 71.4% of listings.
- A significant 57.1% of listings cater specifically to 1-2 guests, highlighting strong demand from couples and solo travelers in Nistelrode.
- 19.0% of properties accommodate 6+ guests, serving the market segment for larger families or group travel in Nistelrode.
- On average, properties in Nistelrode are equipped to host 3.3 guests.
Nistelrode Airbnb Booking Patterns (2025): Available vs. Booked Days
Available Days Distribution
Booked Days Distribution
Booking Pattern Insights for Nistelrode
- The most common availability pattern in Nistelrode falls within the 271-366 days range, representing 57.1% of listings. This suggests many properties have significant open periods on their calendars.
- Approximately 76.1% of listings show high availability (181+ days open annually), indicating potential for increased bookings or specific owner usage patterns.
- For booked days, the 31-90 days range is most frequent in Nistelrode (38.1%), reflecting common guest stay durations or potential owner blocking patterns.
- A notable 23.8% of properties secure long booking periods (181+ days booked per year), highlighting successful long-term rental strategies or significant owner usage.
Nistelrode Airbnb Minimum Stay Requirements Analysis
Distribution of Listings by Minimum Night Requirement
1 Night
11 listings
57.9% of total
2 Nights
4 listings
21.1% of total
3 Nights
3 listings
15.8% of total
7-29 Nights
1 listings
5.3% of total
Key Insights
- The most prevalent minimum stay requirement in Nistelrode is 1 Night, adopted by 57.9% of listings. This highlights the market's preference for shorter, flexible bookings.
- A strong majority (79.0%) of the Nistelrode Airbnb data shows acceptance of very short stays (1-2 nights), indicating a dynamic, high-turnover market.
Recommendations
- Align with the market by considering a 1 Night minimum stay, as 57.9% of Nistelrode hosts use this setting.
- Adjust minimum nights based on seasonality – potentially shorter during low season and longer during peak demand periods in Nistelrode.
Nistelrode Airbnb Cancellation Policy Trends Analysis (2025)
Flexible
3 listings
21.4% of total
Moderate
5 listings
35.7% of total
Firm
1 listings
7.1% of total
Strict
5 listings
35.7% of total
Cancellation Policy Insights for Nistelrode
- The prevailing Airbnb cancellation policy trend in Nistelrode is Moderate, used by 35.7% of listings.
- There's a relatively balanced mix between guest-friendly (57.1%) and stricter (42.8%) policies, offering choices for different guest needs.
Recommendations for Hosts
- Consider adopting a Moderate policy to align with the 35.7% market standard in Nistelrode.
- With 35.7% using Strict terms, this is a viable option in Nistelrode, particularly for high-value properties or during peak demand periods.
- Regularly review your cancellation policy against competitors and market demand shifts in Nistelrode.
Nistelrode STR Booking Lead Time Analysis (2025)
Average Booking Lead Time by Month
Booking Lead Time Insights for Nistelrode
- The overall average booking lead time for vacation rentals in Nistelrode is 69 days.
- Guests book furthest in advance for stays during June (average 127 days), likely coinciding with peak travel demand or local events.
- The shortest booking windows occur for stays in December (average 48 days), indicating more last-minute travel plans during this time.
- Seasonally, Summer (83 days avg.) sees the longest lead times, while Winter (51 days avg.) has the shortest, reflecting typical travel planning cycles.
Recommendations for Hosts
- Use the overall average lead time (69 days) as a baseline for your pricing and availability strategy in Nistelrode.
- For June stays, consider implementing length-of-stay discounts or slightly higher rates for bookings made less than 127 days out to capitalize on advance planning.
- Target marketing efforts for the Summer season well in advance (at least 83 days) to capture early planners.
- Monitor your own booking lead times against these Nistelrode averages to identify opportunities for dynamic pricing adjustments.
Popular & Essential Airbnb Amenities in Nistelrode (2025)
Amenity Prevalence
Amenity Insights for Nistelrode
- Essential amenities in Nistelrode that guests expect include: Refrigerator, Coffee maker, Heating, TV, Wifi. Lacking these (any) could significantly impact bookings.
- Popular amenities like Smoke alarm, Dishes and silverware, Hot water are common but not universal. Offering these can provide a competitive edge.
Recommendations for Hosts
- Ensure your listing includes all essential amenities for Nistelrode: Refrigerator, Coffee maker, Heating, TV, Wifi.
- Prioritize adding missing essentials: Heating, TV, Wifi.
- Consider adding popular differentiators like Smoke alarm or Dishes and silverware to increase appeal.
- Highlight unique or less common amenities you offer (e.g., hot tub, dedicated workspace, EV charger) in your listing description and photos.
- Regularly check competitor amenities in Nistelrode to stay competitive.
Nistelrode Airbnb Guest Demographics & Profile Analysis (2025)
Guest Profile Summary for Nistelrode
- The typical guest profile for Airbnb in Nistelrode consists of primarily domestic travelers (66%), often arriving from nearby Amsterdam, typically belonging to the Post-2000s (Gen Z/Alpha) group (50%), primarily speaking English or Dutch.
- Domestic travelers account for 65.8% of guests.
- Key international markets include Netherlands (65.8%) and Germany (19.7%).
- Top languages spoken are English (36.3%) followed by Dutch (23.5%).
- A significant demographic segment is the Post-2000s (Gen Z/Alpha) group, representing 50% of guests.
Recommendations for Hosts
- Target domestic marketing efforts towards travelers from Amsterdam and The Hague.
- Tailor amenities and listing descriptions to appeal to the dominant Post-2000s (Gen Z/Alpha) demographic (e.g., highlight fast WiFi, smart home features, local guides).
- Highlight unique local experiences or amenities relevant to the primary guest profile.
- Consider seasonal promotions aligned with peak travel times for key origin markets.
Nearby Short-Term Rental Market Comparison
How does the Nistelrode Airbnb market stack up against its neighbors? Compare key performance metrics like average monthly revenue, ADR, and occupancy rates in surrounding areas to understand the broader regional STR landscape.
| Market | Active Properties | Monthly Revenue | Daily Rate | Avg. Occupancy |
|---|---|---|---|---|
| Kockengen | 12 | $7,560 | $396.31 | 61% |
| Baarlo | 18 | $5,602 | $313.73 | 60% |
| Bentveld | 13 | $4,798 | $443.61 | 54% |
| Dion | 13 | $4,589 | $265.41 | 58% |
| Halfweg | 17 | $4,307 | $231.13 | 55% |
| Aerdenhout | 17 | $4,288 | $694.02 | 53% |
| Incourt | 11 | $4,281 | $293.31 | 43% |
| Merksplas | 10 | $3,885 | $256.59 | 44% |
| Oud Ade | 17 | $3,779 | $277.47 | 51% |
| Rijs | 27 | $3,772 | $356.97 | 45% |