Kaatsheuvel Airbnb Market Analysis 2025: Short Term Rental Data & Vacation Rental Statistics in North Brabant, Netherlands
Is Airbnb profitable in Kaatsheuvel in 2025? Explore comprehensive Airbnb analytics for Kaatsheuvel, North Brabant, Netherlands to uncover income potential. This 2025 STR market report for Kaatsheuvel, based on AirROI data from April 2024 to March 2025, reveals key trends in the niche market of 27 active listings.
Whether you're considering an Airbnb investment in Kaatsheuvel, optimizing your existing vacation rental, or exploring rental arbitrage opportunities, understanding the Kaatsheuvel Airbnb data is crucial. Leveraging the low regulation environment is key to maximizing your short term rental income potential. Let's dive into the specifics.
Key Kaatsheuvel Airbnb Performance Metrics Overview
Monthly Airbnb Revenue Variations & Income Potential in Kaatsheuvel (2025)
Understanding the monthly revenue variations for Airbnb listings in Kaatsheuvel is key to maximizing your short term rental income potential. Seasonality significantly impacts earnings. Our analysis, based on data from the past 12 months, shows that the peak revenue month for STRs in Kaatsheuvel is typically June, while March often presents the lowest earnings, highlighting opportunities for strategic pricing adjustments during shoulder and low seasons. Explore the typical Airbnb income in Kaatsheuvel across different performance tiers:
- Best-in-class properties (Top 10%) achieve $6,321+ monthly, often utilizing dynamic pricing and superior guest experiences.
- Strong performing properties (Top 25%) earn $4,258 or more, indicating effective management and desirable locations/amenities.
- Typical properties (Median) generate around $1,827 per month, representing the average market performance.
- Entry-level properties (Bottom 25%) see earnings around $944, often with potential for optimization.
Average Monthly Airbnb Earnings Trend in Kaatsheuvel
Kaatsheuvel Airbnb Occupancy Rate Trends (2025)
Maximize your bookings by understanding the Kaatsheuvel STR occupancy trends. Seasonal demand shifts significantly influence how often properties are booked. Typically, Augustsees the highest demand (peak season occupancy), while March experiences the lowest (low season). Effective strategies, like adjusting minimum stays or offering promotions, can boost occupancy during slower periods. Here's how different property tiers perform in Kaatsheuvel:
- Best-in-class properties (Top 10%) achieve 81%+ occupancy, indicating high desirability and potentially optimized availability.
- Strong performing properties (Top 25%) maintain 61% or higher occupancy, suggesting good market fit and guest satisfaction.
- Typical properties (Median) have an occupancy rate around 31%.
- Entry-level properties (Bottom 25%) average 13% occupancy, potentially facing higher vacancy.
Average Monthly Occupancy Rate Trend in Kaatsheuvel
Average Daily Rate (ADR) Airbnb Trends in Kaatsheuvel (2025)
Effective short term rental pricing strategy in Kaatsheuvel involves understanding monthly ADR fluctuations. The Average Daily Rate (ADR) for Airbnb in Kaatsheuvel typically peaks in August and dips lowest during January. Leveraging Airbnb dynamic pricing tools or strategies based on this seasonality can significantly boost revenue. Here's a look at the typical nightly rates achieved:
- Best-in-class properties (Top 10%) command rates of $369+ per night, often due to premium features or locations.
- Strong performing properties (Top 25%) achieve nightly rates of $308 or more.
- Typical properties (Median) charge around $212 per night.
- Entry-level properties (Bottom 25%) earn around $133 per night.
Average Daily Rate (ADR) Trend by Month in Kaatsheuvel
Get Live Kaatsheuvel Market Intelligence 👇

Explore Real-time Analytics
Airbnb Seasonality Analysis & Trends in Kaatsheuvel (2025)
Peak Season (June, May, April)
- Revenue averages $4,861 per month
- Occupancy rates average 45.3%
- Daily rates average $251
Shoulder Season
- Revenue averages $2,389 per month
- Occupancy maintains around 40.0%
- Daily rates hold near $232
Low Season (January, February, March)
- Revenue drops to average $1,215 per month
- Occupancy decreases to average 30.8%
- Daily rates adjust to average $195
Seasonality Insights for Kaatsheuvel
- The Airbnb seasonality in Kaatsheuvel shows highly seasonal trends requiring careful strategy. While the sections above show seasonal averages, it's also insightful to look at the extremes:
- During the high season, the absolute peak month showcases Kaatsheuvel's highest earning potential, with monthly revenues capable of climbing to $5,630, occupancy reaching a high of 49.8%, and ADRs peaking at $271.
- Conversely, the slowest single month of the year, typically falling within the low season, marks the market's lowest point. In this month, revenue might dip to $980, occupancy could drop to 26.9%, and ADRs may adjust down to $192.
- Understanding both the seasonal averages and these monthly peaks and troughs in revenue, occupancy, and ADR is crucial for maximizing your Airbnb profit potential in Kaatsheuvel.
Seasonal Strategies for Maximizing Profit
- Peak Season: Maximize revenue through premium pricing and potentially longer minimum stays. Ensure high availability.
- Low Season: Offer competitive pricing, special promotions (e.g., extended stay discounts), and flexible cancellation policies. Target off-season travelers like remote workers or budget-conscious guests.
- Shoulder Seasons: Implement dynamic pricing that balances peak and low rates. Target weekend travelers or specific events. Offer slightly more flexible terms than peak season.
- Regularly analyze your own performance against these Kaatsheuvel seasonality benchmarks and adjust your pricing and availability strategy accordingly.
Best Areas for Airbnb Investment in Kaatsheuvel (2025)
Exploring the top neighborhoods for short-term rentals in Kaatsheuvel? This section highlights key areas, outlining why they are attractive for hosts and guests, along with notable local attractions. Consider these locations based on your target guest profile and investment strategy.
| Neighborhood / Area | Why Host Here? (Target Guests & Appeal) | Key Attractions & Landmarks |
|---|---|---|
| Efteling Theme Park Area | Efteling is one of the largest and most popular theme parks in Europe, attracting millions of visitors each year. Hosting an Airbnb nearby allows guests to easily access the park's enchanting attractions, making it a prime location for families and thrill-seekers. | Efteling Theme Park, Efteling Golf Park, Efteling Hotel, De Efteling Museum, Aquanura Water Show |
| Efteling Bosrijk | This is a nearby resort and hotel complex that offers a unique and immersive experience. Guests staying in this area can enjoy luxury accommodations while being close to nature and the Efteling theme park. | Efteling Bosrijk Resort, Efteling Hotel, Nature trails, Play areas for kids, Restaurant De Rozenboom |
| Kaatsheuvel Village Center | The village center provides a charming Dutch experience with local shops and eateries. It offers a traditional atmosphere for guests wanting to experience local culture while still being close to major attractions. | Local shops, Cafes and restaurants, Historic buildings, Kaatsheuvel Church, Nearby parks |
| De Loonse en Drunense Duinen | This national park features stunning sand dunes and vast forests, perfect for outdoor enthusiasts. Hosting an Airbnb here targets tourists looking for both natural beauty and access to Efteling. | Hiking trails, Cycling routes, Sand dunes, Natural scenery, Wildlife observation |
| Ranch De Hondsrug | A family-friendly ranch offering horse riding and farm activities. This area can attract families looking for a countryside experience combined with fun activities for kids. | Horse riding, Petting zoo, Farm activities, Nature walks, Local produce shop |
| Kaatsheuvel Nature Trails | Surrounded by beautiful greenery and trails, offering a peaceful retreat for guests looking to relax in nature. This attracts those seeking a tranquil environment near Kaatsheuvel. | Walking trails, Birdwatching, Picnic areas, Quiet spots, Nature walks |
| Molenbeek River Area | A scenic area near the river, providing picturesque views and a lovely setting for outdoor activities. It's ideal for Airbnb guests who enjoy nature and outdoor experiences. | River walks, Fishing spots, Cycling paths, Scenic views, Picnic spots |
| Nearby Cities (Tilburg and Waalwijk) | Investing in a location that is close to larger cities like Tilburg and Waalwijk can attract business travelers and urban tourists looking for accommodation with easy access to city amenities. | Tilburg University, De Pont Museum of Contemporary Art, Waalwijk's historical sites, Shopping areas in Tilburg, Local events and festivals |
Understanding Airbnb License Requirements & STR Laws in Kaatsheuvel (2025)
While Kaatsheuvel, North Brabant, Netherlands currently shows low STR regulations, specific Airbnb license requirements might still exist or change. Always verify the latest short term rental regulations and Airbnb license requirements directly with local government authorities for Kaatsheuvel to ensure full compliance before hosting.
(Source: AirROI data, 2025, finding no licensed listings among those analyzed)
Top Performing Airbnb Properties in Kaatsheuvel (2025)
Benchmark your potential! Explore examples of top-performing Airbnb properties in Kaatsheuvelbased on Trailing Twelve Month (TTM) revenue. Analyze their characteristics, revenue, occupancy rate, and ADR to understand what drives success in this market.
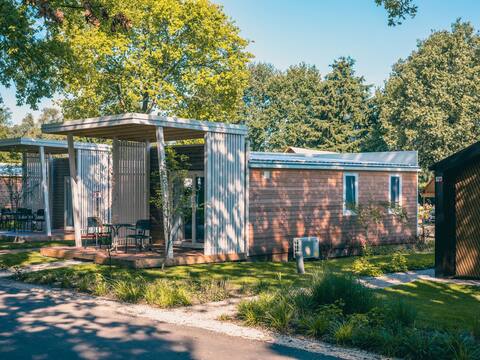
Compact chalet with airco, near the Efteling
Entire Place • 2 bedrooms

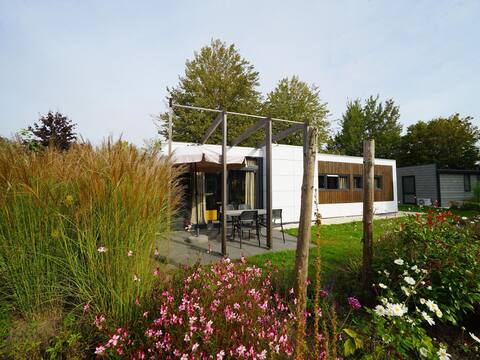
Contemporary chalet, near De Efteling
Entire Place • 3 bedrooms
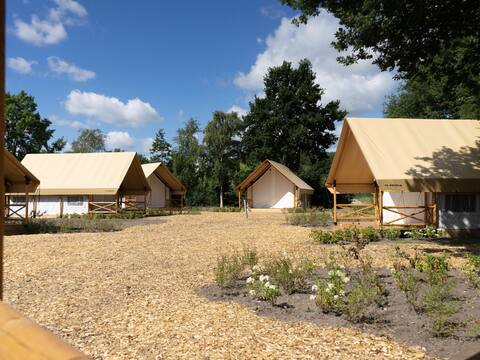
Nice tentlodge with veranda, the Efteling at 2 km.
Entire Place • 2 bedrooms
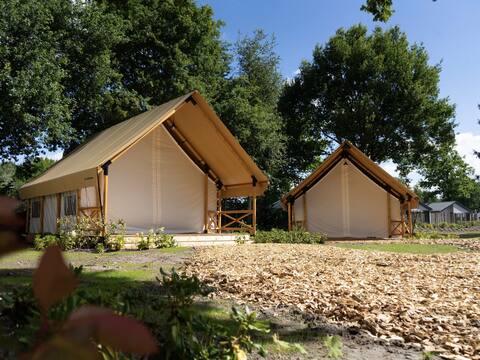
Nice tentlodge with veranda, 2km from the Efteling
Entire Place • 1 bedroom
Modern chalet with dishwasher, near the Efteling
Entire Place • 2 bedrooms

Family Inn: spacious, modern holiday stay
Entire Place • 2 bedrooms
Note: Performance varies based on location, size, amenities, seasonality, and management quality. Data reflects the past 12 months.
Top Performing Airbnb Hosts in Kaatsheuvel (2025)
Learn from the best! This table showcases top-performing Airbnb hosts in Kaatsheuvel based on the number of properties managed and estimated total revenue over the past year. Analyze their scale and performance metrics.
| Host Name | Properties | Grossing Revenue | Stay Reviews | Avg Rating |
|---|---|---|---|---|
| Diana - BELVILLA | 13 | $434,287 | 80 | 2.58/5.0 |
| Family Inn | 1 | $45,787 | 40 | 4.95/5.0 |
| Annemieke | 1 | $40,754 | 61 | 4.95/5.0 |
| Ad | 1 | $31,851 | 24 | 4.83/5.0 |
| Marc | 1 | $31,229 | 18 | 4.94/5.0 |
| Cor & Jeanneke | 1 | $26,715 | 331 | 4.95/5.0 |
| Thomas | 2 | $21,631 | 11 | 4.17/5.0 |
| Tim | 1 | $17,576 | 6 | 4.50/5.0 |
| Ankie | 1 | $16,827 | 542 | 4.88/5.0 |
| Ruud | 1 | $15,970 | 12 | 5.00/5.0 |
Analyzing the strategies of top hosts, such as their property selection, pricing, and guest communication, can offer valuable lessons for optimizing your own Airbnb operations in Kaatsheuvel.
Dive Deeper: Advanced Kaatsheuvel STR Market Data (2025)
Ready to unlock more insights? AirROI provides access to advanced metrics and comprehensive Airbnb data for Kaatsheuvel. Explore detailed analytics beyond this report to refine your investment strategy, optimize pricing, and maximize your vacation rental profits.
Explore Advanced MetricsKaatsheuvel Short-Term Rental Market Composition (2025): Property & Room Types
Room Type Distribution
Property Type Distribution
Market Composition Insights for Kaatsheuvel
- The Kaatsheuvel Airbnb market composition is heavily skewed towards Entire Home/Apt listings, which make up 85.2% of the 27 active rentals. This indicates strong guest preference for privacy and space.
- Looking at the property type distribution in Kaatsheuvel, House properties are the most common (63%), reflecting the local real estate landscape.
- Houses represent a significant 63% portion, catering likely to families or larger groups.
- The presence of 11.1% Hotel/Boutique listings indicates integration with traditional hospitality.
Kaatsheuvel Airbnb Room Capacity Analysis (2025): Bedroom Distribution
Distribution of Listings by Number of Bedrooms
Room Capacity Insights for Kaatsheuvel
- The dominant room capacity in Kaatsheuvel is 2 bedrooms listings, making up 55.6% of the market. This suggests a strong demand for properties suitable for couples or solo travelers.
- Together, 2 bedrooms and 3 bedrooms properties represent 77.8% of the active Airbnb listings in Kaatsheuvel, indicating a high concentration in these sizes.
- A significant 22.2% of listings offer 3+ bedrooms, catering to larger groups and families seeking more space in Kaatsheuvel.
Kaatsheuvel Vacation Rental Guest Capacity Trends (2025)
Distribution of Listings by Guest Capacity
Guest Capacity Insights for Kaatsheuvel
- The most common guest capacity trend in Kaatsheuvel vacation rentals is listings accommodating 4 guests (37%). This suggests the primary traveler segment is likely small families or groups.
- Properties designed for 4 guests and 6 guests dominate the Kaatsheuvel STR market, accounting for 70.3% of listings.
- 33.3% of properties accommodate 6+ guests, serving the market segment for larger families or group travel in Kaatsheuvel.
- On average, properties in Kaatsheuvel are equipped to host 4.0 guests.
Kaatsheuvel Airbnb Booking Patterns (2025): Available vs. Booked Days
Available Days Distribution
Booked Days Distribution
Booking Pattern Insights for Kaatsheuvel
- The most common availability pattern in Kaatsheuvel falls within the 181-270 days range, representing 44.4% of listings. This suggests many properties have significant open periods on their calendars.
- Approximately 77.7% of listings show high availability (181+ days open annually), indicating potential for increased bookings or specific owner usage patterns.
- For booked days, the 91-180 days range is most frequent in Kaatsheuvel (40.7%), reflecting common guest stay durations or potential owner blocking patterns.
- A notable 25.9% of properties secure long booking periods (181+ days booked per year), highlighting successful long-term rental strategies or significant owner usage.
Kaatsheuvel Airbnb Minimum Stay Requirements Analysis
Distribution of Listings by Minimum Night Requirement
1 Night
9 listings
47.4% of total
2 Nights
5 listings
26.3% of total
3 Nights
2 listings
10.5% of total
4-6 Nights
1 listings
5.3% of total
7-29 Nights
1 listings
5.3% of total
30+ Nights
1 listings
5.3% of total
Key Insights
- The most prevalent minimum stay requirement in Kaatsheuvel is 1 Night, adopted by 47.4% of listings. This highlights the market's preference for shorter, flexible bookings.
- A strong majority (73.7%) of the Kaatsheuvel Airbnb data shows acceptance of very short stays (1-2 nights), indicating a dynamic, high-turnover market.
Recommendations
- Align with the market by considering a 1 Night minimum stay, as 47.4% of Kaatsheuvel hosts use this setting.
- Explore offering discounts for stays of 30+ nights to attract the 5.3% of the market seeking extended stays.
- Adjust minimum nights based on seasonality – potentially shorter during low season and longer during peak demand periods in Kaatsheuvel.
Kaatsheuvel Airbnb Cancellation Policy Trends Analysis (2025)
Flexible
6 listings
37.5% of total
Moderate
2 listings
12.5% of total
Firm
3 listings
18.8% of total
Strict
5 listings
31.3% of total
Cancellation Policy Insights for Kaatsheuvel
- The prevailing Airbnb cancellation policy trend in Kaatsheuvel is Flexible, used by 37.5% of listings.
- A majority (50.1%) of hosts in Kaatsheuvel utilize Firm or Strict policies, indicating a market where hosts prioritize booking security.
Recommendations for Hosts
- Consider adopting a Flexible policy to align with the 37.5% market standard in Kaatsheuvel.
- With 31.3% using Strict terms, this is a viable option in Kaatsheuvel, particularly for high-value properties or during peak demand periods.
- Regularly review your cancellation policy against competitors and market demand shifts in Kaatsheuvel.
Kaatsheuvel STR Booking Lead Time Analysis (2025)
Average Booking Lead Time by Month
Booking Lead Time Insights for Kaatsheuvel
- The overall average booking lead time for vacation rentals in Kaatsheuvel is 61 days.
- Guests book furthest in advance for stays during May (average 101 days), likely coinciding with peak travel demand or local events.
- The shortest booking windows occur for stays in February (average 29 days), indicating more last-minute travel plans during this time.
- Seasonally, Summer (88 days avg.) sees the longest lead times, while Winter (43 days avg.) has the shortest, reflecting typical travel planning cycles.
Recommendations for Hosts
- Use the overall average lead time (61 days) as a baseline for your pricing and availability strategy in Kaatsheuvel.
- For May stays, consider implementing length-of-stay discounts or slightly higher rates for bookings made less than 101 days out to capitalize on advance planning.
- Target marketing efforts for the Summer season well in advance (at least 88 days) to capture early planners.
- Monitor your own booking lead times against these Kaatsheuvel averages to identify opportunities for dynamic pricing adjustments.
Popular & Essential Airbnb Amenities in Kaatsheuvel (2025)
Amenity Prevalence
Amenity Insights for Kaatsheuvel
- Popular amenities like Wifi, TV, Heating are common but not universal. Offering these can provide a competitive edge.
- Warning: Wifi is not universally provided but is considered essential globally. Ensure reliable Wifi is offered.
Recommendations for Hosts
- Consider adding popular differentiators like Wifi or TV to increase appeal.
- Highlight unique or less common amenities you offer (e.g., hot tub, dedicated workspace, EV charger) in your listing description and photos.
- Regularly check competitor amenities in Kaatsheuvel to stay competitive.
Kaatsheuvel Airbnb Guest Demographics & Profile Analysis (2025)
Guest Profile Summary for Kaatsheuvel
- The typical guest profile for Airbnb in Kaatsheuvel consists of predominantly international visitors (80%), with top international origins including Netherlands, typically belonging to the Post-2000s (Gen Z/Alpha) group (50%), primarily speaking English or German.
- Domestic travelers account for 19.9% of guests.
- Key international markets include United Kingdom (24%) and Netherlands (19.9%).
- Top languages spoken are English (40.7%) followed by German (15.4%).
- A significant demographic segment is the Post-2000s (Gen Z/Alpha) group, representing 50% of guests.
Recommendations for Hosts
- Focus marketing internationally, particularly towards travelers from Netherlands.
- Tailor amenities and listing descriptions to appeal to the dominant Post-2000s (Gen Z/Alpha) demographic (e.g., highlight fast WiFi, smart home features, local guides).
- Highlight unique local experiences or amenities relevant to the primary guest profile.
- Consider seasonal promotions aligned with peak travel times for key origin markets.
Nearby Short-Term Rental Market Comparison
How does the Kaatsheuvel Airbnb market stack up against its neighbors? Compare key performance metrics like average monthly revenue, ADR, and occupancy rates in surrounding areas to understand the broader regional STR landscape.
| Market | Active Properties | Monthly Revenue | Daily Rate | Avg. Occupancy |
|---|---|---|---|---|
| Kockengen | 12 | $7,560 | $396.31 | 61% |
| Baarlo | 18 | $5,602 | $313.73 | 60% |
| Bentveld | 13 | $4,798 | $443.61 | 54% |
| Dion | 13 | $4,589 | $265.41 | 58% |
| Halfweg | 17 | $4,307 | $231.13 | 55% |
| Aerdenhout | 17 | $4,288 | $694.02 | 53% |
| Incourt | 11 | $4,281 | $293.31 | 43% |
| Merksplas | 10 | $3,885 | $256.59 | 44% |
| Oud Ade | 17 | $3,779 | $277.47 | 51% |
| Rijs | 27 | $3,772 | $356.97 | 45% |