Berg en Terblijt Airbnb Market Analysis 2025: Short Term Rental Data & Vacation Rental Statistics in Limburg, Netherlands
Is Airbnb profitable in Berg en Terblijt in 2025? Explore comprehensive Airbnb analytics for Berg en Terblijt, Limburg, Netherlands to uncover income potential. This 2025 STR market report for Berg en Terblijt, based on AirROI data from April 2024 to March 2025, reveals key trends in the niche market of 23 active listings.
Whether you're considering an Airbnb investment in Berg en Terblijt, optimizing your existing vacation rental, or exploring rental arbitrage opportunities, understanding the Berg en Terblijt Airbnb data is crucial. Leveraging the low regulation environment is key to maximizing your short term rental income potential. Let's dive into the specifics.
Key Berg en Terblijt Airbnb Performance Metrics Overview
Monthly Airbnb Revenue Variations & Income Potential in Berg en Terblijt (2025)
Understanding the monthly revenue variations for Airbnb listings in Berg en Terblijt is key to maximizing your short term rental income potential. Seasonality significantly impacts earnings. Our analysis, based on data from the past 12 months, shows that the peak revenue month for STRs in Berg en Terblijt is typically May, while January often presents the lowest earnings, highlighting opportunities for strategic pricing adjustments during shoulder and low seasons. Explore the typical Airbnb income in Berg en Terblijt across different performance tiers:
- Best-in-class properties (Top 10%) achieve $4,984+ monthly, often utilizing dynamic pricing and superior guest experiences.
- Strong performing properties (Top 25%) earn $3,370 or more, indicating effective management and desirable locations/amenities.
- Typical properties (Median) generate around $1,692 per month, representing the average market performance.
- Entry-level properties (Bottom 25%) see earnings around $922, often with potential for optimization.
Average Monthly Airbnb Earnings Trend in Berg en Terblijt
Berg en Terblijt Airbnb Occupancy Rate Trends (2025)
Maximize your bookings by understanding the Berg en Terblijt STR occupancy trends. Seasonal demand shifts significantly influence how often properties are booked. Typically, Maysees the highest demand (peak season occupancy), while January experiences the lowest (low season). Effective strategies, like adjusting minimum stays or offering promotions, can boost occupancy during slower periods. Here's how different property tiers perform in Berg en Terblijt:
- Best-in-class properties (Top 10%) achieve 67%+ occupancy, indicating high desirability and potentially optimized availability.
- Strong performing properties (Top 25%) maintain 46% or higher occupancy, suggesting good market fit and guest satisfaction.
- Typical properties (Median) have an occupancy rate around 26%.
- Entry-level properties (Bottom 25%) average 13% occupancy, potentially facing higher vacancy.
Average Monthly Occupancy Rate Trend in Berg en Terblijt
Average Daily Rate (ADR) Airbnb Trends in Berg en Terblijt (2025)
Effective short term rental pricing strategy in Berg en Terblijt involves understanding monthly ADR fluctuations. The Average Daily Rate (ADR) for Airbnb in Berg en Terblijt typically peaks in August and dips lowest during November. Leveraging Airbnb dynamic pricing tools or strategies based on this seasonality can significantly boost revenue. Here's a look at the typical nightly rates achieved:
- Best-in-class properties (Top 10%) command rates of $410+ per night, often due to premium features or locations.
- Strong performing properties (Top 25%) achieve nightly rates of $294 or more.
- Typical properties (Median) charge around $180 per night.
- Entry-level properties (Bottom 25%) earn around $114 per night.
Average Daily Rate (ADR) Trend by Month in Berg en Terblijt
Get Live Berg en Terblijt Market Intelligence 👇

Explore Real-time Analytics
Airbnb Seasonality Analysis & Trends in Berg en Terblijt (2025)
Peak Season (May, April, June)
- Revenue averages $4,008 per month
- Occupancy rates average 43.9%
- Daily rates average $225
Shoulder Season
- Revenue averages $2,007 per month
- Occupancy maintains around 30.6%
- Daily rates hold near $217
Low Season (January, February, March)
- Revenue drops to average $1,161 per month
- Occupancy decreases to average 21.9%
- Daily rates adjust to average $205
Seasonality Insights for Berg en Terblijt
- The Airbnb seasonality in Berg en Terblijt shows highly seasonal trends requiring careful strategy. While the sections above show seasonal averages, it's also insightful to look at the extremes:
- During the high season, the absolute peak month showcases Berg en Terblijt's highest earning potential, with monthly revenues capable of climbing to $4,391, occupancy reaching a high of 48.8%, and ADRs peaking at $238.
- Conversely, the slowest single month of the year, typically falling within the low season, marks the market's lowest point. In this month, revenue might dip to $1,006, occupancy could drop to 17.0%, and ADRs may adjust down to $198.
- Understanding both the seasonal averages and these monthly peaks and troughs in revenue, occupancy, and ADR is crucial for maximizing your Airbnb profit potential in Berg en Terblijt.
Seasonal Strategies for Maximizing Profit
- Peak Season: Maximize revenue through premium pricing and potentially longer minimum stays. Ensure high availability.
- Low Season: Offer competitive pricing, special promotions (e.g., extended stay discounts), and flexible cancellation policies. Target off-season travelers like remote workers or budget-conscious guests.
- Shoulder Seasons: Implement dynamic pricing that balances peak and low rates. Target weekend travelers or specific events. Offer slightly more flexible terms than peak season.
- Regularly analyze your own performance against these Berg en Terblijt seasonality benchmarks and adjust your pricing and availability strategy accordingly.
Best Areas for Airbnb Investment in Berg en Terblijt (2025)
Exploring the top neighborhoods for short-term rentals in Berg en Terblijt? This section highlights key areas, outlining why they are attractive for hosts and guests, along with notable local attractions. Consider these locations based on your target guest profile and investment strategy.
| Neighborhood / Area | Why Host Here? (Target Guests & Appeal) | Key Attractions & Landmarks |
|---|---|---|
| Berg en Terblijt Center | A charming village atmosphere with easy access to local amenities and a picturesque setting by the river. | Maastricht, Hoge Kempen National Park, St. Servaas Church, Local cafes and restaurants |
| Eijsden | A scenic area close to the border with Belgium, popular for its historic architecture and tranquility, attracting visitors looking for a peaceful retreat. | Eijsden Castle, Historic town center, River Maas, Cycling routes |
| Kessel | Known for its beautiful landscapes and nature, Kessel attracts visitors interested in hiking and outdoor activities, making it ideal for nature lovers. | Kesseler Kasteel, Nature trails, Limburgse Maas |
| Wyck | A trendy and artistic neighborhood known for its boutique shops and cultural events, appealing to young travelers and creatives. | Independent shops, Art galleries, Wyck's architecture |
| Meerssen | Rich in history and culture, Meerssen is a quaint town that offers visitors a slice of local life with charming streets and historical sites. | Old monasteries, St. Benedictus Church, Local markets |
| Margraten | A beautiful area known for its memorial parks and rural landscapes, attracting those interested in history and nature. | American Cemetery, Historical sites, Countryside walks |
| Valkenburg | Famous for its caves and castle, Valkenburg is a popular tourist destination with plenty of attractions making it great for Airbnb hosts. | Valkenburg Castle, Thermae 2000, Kasteel Ter Borch |
| Maastricht | A vibrant city with a rich history, known for its lively atmosphere, cultural events, and culinary scene, making it a prime location for shorter stays. | Vrijthof square, Basilica of Saint Servatius, St. Pietersberg Caves, Culinary delights and restaurants |
Understanding Airbnb License Requirements & STR Laws in Berg en Terblijt (2025)
While Berg en Terblijt, Limburg, Netherlands currently shows low STR regulations, specific Airbnb license requirements might still exist or change. Always verify the latest short term rental regulations and Airbnb license requirements directly with local government authorities for Berg en Terblijt to ensure full compliance before hosting.
(Source: AirROI data, 2025, finding no licensed listings among those analyzed)
Top Performing Airbnb Properties in Berg en Terblijt (2025)
Benchmark your potential! Explore examples of top-performing Airbnb properties in Berg en Terblijtbased on Trailing Twelve Month (TTM) revenue. Analyze their characteristics, revenue, occupancy rate, and ADR to understand what drives success in this market.
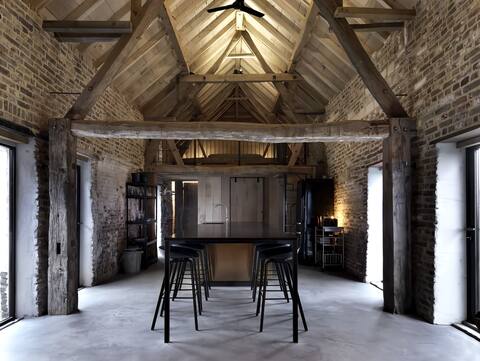
Hoeve apartment at the outskirts of Maastricht
Entire Place • 2 bedrooms
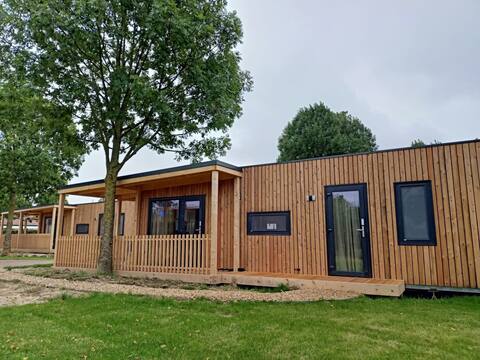
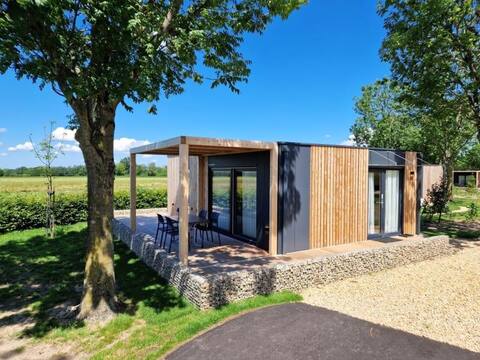
Modern chalet with airco, 9 km. from Maastricht
Entire Place • 2 bedrooms
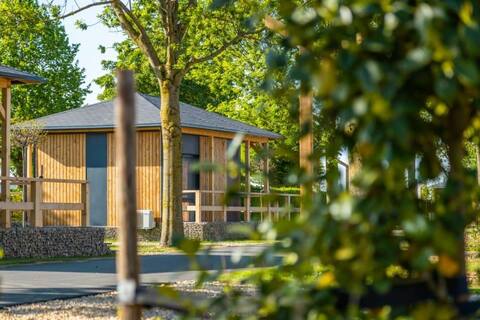
Tiny House 2
Entire Place • 1 bedroom
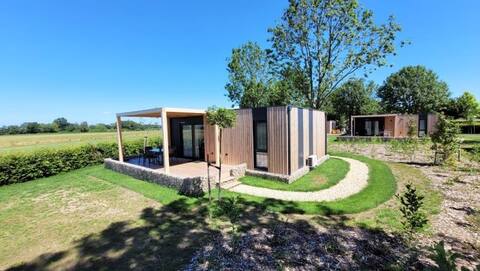
Domus 4+2
Entire Place • 3 bedrooms
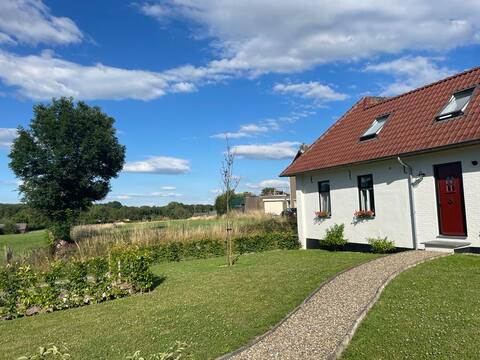
Rural B&B in South Limburgs Heuvelland.
Entire Place • 1 bedroom
Domus 4
Entire Place • 2 bedrooms
Note: Performance varies based on location, size, amenities, seasonality, and management quality. Data reflects the past 12 months.
Top Performing Airbnb Hosts in Berg en Terblijt (2025)
Learn from the best! This table showcases top-performing Airbnb hosts in Berg en Terblijt based on the number of properties managed and estimated total revenue over the past year. Analyze their scale and performance metrics.
| Host Name | Properties | Grossing Revenue | Stay Reviews | Avg Rating |
|---|---|---|---|---|
| Host #387867368 | 6 | $141,488 | 20 | 1.38/5.0 |
| Host #124661153 | 6 | $91,915 | 8 | 0.67/5.0 |
| Miranda | 1 | $51,216 | 170 | 4.86/5.0 |
| Frank | 1 | $36,799 | 44 | 4.98/5.0 |
| Wouter & Carmen | 1 | $28,158 | 291 | 4.77/5.0 |
| Ikkelien | 1 | $19,349 | 122 | 4.81/5.0 |
| Marij | 1 | $18,635 | 184 | 4.92/5.0 |
| Juul | 1 | $12,469 | 8 | 4.50/5.0 |
| Suzanne | 1 | $11,911 | 29 | 4.76/5.0 |
| Bas | 1 | $11,840 | 17 | 4.94/5.0 |
Analyzing the strategies of top hosts, such as their property selection, pricing, and guest communication, can offer valuable lessons for optimizing your own Airbnb operations in Berg en Terblijt.
Dive Deeper: Advanced Berg en Terblijt STR Market Data (2025)
Ready to unlock more insights? AirROI provides access to advanced metrics and comprehensive Airbnb data for Berg en Terblijt. Explore detailed analytics beyond this report to refine your investment strategy, optimize pricing, and maximize your vacation rental profits.
Explore Advanced MetricsBerg en Terblijt Short-Term Rental Market Composition (2025): Property & Room Types
Room Type Distribution
Property Type Distribution
Market Composition Insights for Berg en Terblijt
- The Berg en Terblijt Airbnb market composition is heavily skewed towards Entire Home/Apt listings, which make up 82.6% of the 23 active rentals. This indicates strong guest preference for privacy and space.
- Looking at the property type distribution in Berg en Terblijt, House properties are the most common (43.5%), reflecting the local real estate landscape.
- Houses represent a significant 43.5% portion, catering likely to families or larger groups.
- The presence of 17.4% Hotel/Boutique listings indicates integration with traditional hospitality.
- Smaller segments like unique stays (combined 4.3%) offer potential for unique stay experiences.
Berg en Terblijt Airbnb Room Capacity Analysis (2025): Bedroom Distribution
Distribution of Listings by Number of Bedrooms
Room Capacity Insights for Berg en Terblijt
- The dominant room capacity in Berg en Terblijt is 2 bedrooms listings, making up 43.5% of the market. This suggests a strong demand for properties suitable for couples or solo travelers.
- Together, 2 bedrooms and 1 bedroom properties represent 78.3% of the active Airbnb listings in Berg en Terblijt, indicating a high concentration in these sizes.
Berg en Terblijt Vacation Rental Guest Capacity Trends (2025)
Distribution of Listings by Guest Capacity
Guest Capacity Insights for Berg en Terblijt
- The most common guest capacity trend in Berg en Terblijt vacation rentals is listings accommodating 4 guests (43.5%). This suggests the primary traveler segment is likely small families or groups.
- Properties designed for 4 guests and 2 guests dominate the Berg en Terblijt STR market, accounting for 69.6% of listings.
- 13.0% of properties accommodate 6+ guests, serving the market segment for larger families or group travel in Berg en Terblijt.
- On average, properties in Berg en Terblijt are equipped to host 3.4 guests.
Berg en Terblijt Airbnb Booking Patterns (2025): Available vs. Booked Days
Available Days Distribution
Booked Days Distribution
Booking Pattern Insights for Berg en Terblijt
- The most common availability pattern in Berg en Terblijt falls within the 271-366 days range, representing 60.9% of listings. This suggests many properties have significant open periods on their calendars.
- Approximately 82.6% of listings show high availability (181+ days open annually), indicating potential for increased bookings or specific owner usage patterns.
- For booked days, the 1-30 days range is most frequent in Berg en Terblijt (34.8%), reflecting common guest stay durations or potential owner blocking patterns.
- A notable 17.3% of properties secure long booking periods (181+ days booked per year), highlighting successful long-term rental strategies or significant owner usage.
Berg en Terblijt Airbnb Minimum Stay Requirements Analysis
Distribution of Listings by Minimum Night Requirement
1 Night
7 listings
50% of total
2 Nights
5 listings
35.7% of total
3 Nights
1 listings
7.1% of total
7-29 Nights
1 listings
7.1% of total
Key Insights
- The most prevalent minimum stay requirement in Berg en Terblijt is 1 Night, adopted by 50% of listings. This highlights the market's preference for shorter, flexible bookings.
- A strong majority (85.7%) of the Berg en Terblijt Airbnb data shows acceptance of very short stays (1-2 nights), indicating a dynamic, high-turnover market.
Recommendations
- Align with the market by considering a 1 Night minimum stay, as 50% of Berg en Terblijt hosts use this setting.
- Adjust minimum nights based on seasonality – potentially shorter during low season and longer during peak demand periods in Berg en Terblijt.
Berg en Terblijt Airbnb Cancellation Policy Trends Analysis (2025)
Moderate
8 listings
88.9% of total
Strict
1 listings
11.1% of total
Cancellation Policy Insights for Berg en Terblijt
- The prevailing Airbnb cancellation policy trend in Berg en Terblijt is Moderate, used by 88.9% of listings.
- The market strongly favors guest-friendly terms, with 88.9% of listings offering Flexible or Moderate policies. This suggests guests in Berg en Terblijt may expect booking flexibility.
Recommendations for Hosts
- Consider adopting a Moderate policy to align with the 88.9% market standard in Berg en Terblijt.
- Using a Strict policy might deter some guests, as only 11.1% of listings use it. Evaluate if potential revenue protection outweighs possible lower booking rates.
- Regularly review your cancellation policy against competitors and market demand shifts in Berg en Terblijt.
Berg en Terblijt STR Booking Lead Time Analysis (2025)
Average Booking Lead Time by Month
Booking Lead Time Insights for Berg en Terblijt
- The overall average booking lead time for vacation rentals in Berg en Terblijt is 86 days.
- Guests book furthest in advance for stays during June (average 168 days), likely coinciding with peak travel demand or local events.
- The shortest booking windows occur for stays in November (average 75 days), indicating more last-minute travel plans during this time.
- Seasonally, Summer (136 days avg.) sees the longest lead times, while Fall (95 days avg.) has the shortest, reflecting typical travel planning cycles.
Recommendations for Hosts
- Use the overall average lead time (86 days) as a baseline for your pricing and availability strategy in Berg en Terblijt.
- For June stays, consider implementing length-of-stay discounts or slightly higher rates for bookings made less than 168 days out to capitalize on advance planning.
- Target marketing efforts for the Summer season well in advance (at least 136 days) to capture early planners.
- Monitor your own booking lead times against these Berg en Terblijt averages to identify opportunities for dynamic pricing adjustments.
Popular & Essential Airbnb Amenities in Berg en Terblijt (2025)
Amenity Prevalence
Amenity Insights for Berg en Terblijt
- Essential amenities in Berg en Terblijt that guests expect include: Smoke alarm, Hot water, Essentials, Heating, Wifi. Lacking these (any) could significantly impact bookings.
- Popular amenities like TV, Carbon monoxide alarm, Private entrance are common but not universal. Offering these can provide a competitive edge.
Recommendations for Hosts
- Ensure your listing includes all essential amenities for Berg en Terblijt: Smoke alarm, Hot water, Essentials, Heating, Wifi.
- Consider adding popular differentiators like TV or Carbon monoxide alarm to increase appeal.
- Highlight unique or less common amenities you offer (e.g., hot tub, dedicated workspace, EV charger) in your listing description and photos.
- Regularly check competitor amenities in Berg en Terblijt to stay competitive.
Berg en Terblijt Airbnb Guest Demographics & Profile Analysis (2025)
Guest Profile Summary for Berg en Terblijt
- The typical guest profile for Airbnb in Berg en Terblijt consists of primarily domestic travelers (66%), often arriving from nearby Amsterdam, typically belonging to the Post-2000s (Gen Z/Alpha) group (50%), primarily speaking English or Dutch.
- Domestic travelers account for 66.4% of guests.
- Key international markets include Netherlands (66.4%) and Germany (10.7%).
- Top languages spoken are English (39.3%) followed by Dutch (27.1%).
- A significant demographic segment is the Post-2000s (Gen Z/Alpha) group, representing 50% of guests.
Recommendations for Hosts
- Target domestic marketing efforts towards travelers from Amsterdam and Utrecht.
- Tailor amenities and listing descriptions to appeal to the dominant Post-2000s (Gen Z/Alpha) demographic (e.g., highlight fast WiFi, smart home features, local guides).
- Highlight unique local experiences or amenities relevant to the primary guest profile.
- Consider seasonal promotions aligned with peak travel times for key origin markets.
Nearby Short-Term Rental Market Comparison
How does the Berg en Terblijt Airbnb market stack up against its neighbors? Compare key performance metrics like average monthly revenue, ADR, and occupancy rates in surrounding areas to understand the broader regional STR landscape.
| Market | Active Properties | Monthly Revenue | Daily Rate | Avg. Occupancy |
|---|---|---|---|---|
| Baarlo | 18 | $5,602 | $313.73 | 60% |
| Dion | 13 | $4,589 | $265.41 | 58% |
| Incourt | 11 | $4,281 | $293.31 | 43% |
| Merksplas | 10 | $3,885 | $256.59 | 44% |
| Kerkdriel | 25 | $3,607 | $323.16 | 40% |
| Brecht | 10 | $3,531 | $251.70 | 54% |
| Ondenval | 10 | $3,432 | $235.00 | 45% |
| Aubel | 33 | $3,418 | $244.77 | 44% |
| Saint-Hubert | 28 | $3,414 | $294.66 | 41% |
| Heusden-Zolder | 14 | $3,392 | $290.06 | 44% |