Belfeld Airbnb Market Analysis 2025: Short Term Rental Data & Vacation Rental Statistics in Limburg, Netherlands
Is Airbnb profitable in Belfeld in 2025? Explore comprehensive Airbnb analytics for Belfeld, Limburg, Netherlands to uncover income potential. This 2025 STR market report for Belfeld, based on AirROI data from April 2024 to March 2025, reveals key trends in the niche market of 30 active listings.
Whether you're considering an Airbnb investment in Belfeld, optimizing your existing vacation rental, or exploring rental arbitrage opportunities, understanding the Belfeld Airbnb data is crucial. Leveraging the low regulation environment is key to maximizing your short term rental income potential. Let's dive into the specifics.
Key Belfeld Airbnb Performance Metrics Overview
Monthly Airbnb Revenue Variations & Income Potential in Belfeld (2025)
Understanding the monthly revenue variations for Airbnb listings in Belfeld is key to maximizing your short term rental income potential. Seasonality significantly impacts earnings. Our analysis, based on data from the past 12 months, shows that the peak revenue month for STRs in Belfeld is typically May, while January often presents the lowest earnings, highlighting opportunities for strategic pricing adjustments during shoulder and low seasons. Explore the typical Airbnb income in Belfeld across different performance tiers:
- Best-in-class properties (Top 10%) achieve $6,279+ monthly, often utilizing dynamic pricing and superior guest experiences.
- Strong performing properties (Top 25%) earn $4,142 or more, indicating effective management and desirable locations/amenities.
- Typical properties (Median) generate around $3,025 per month, representing the average market performance.
- Entry-level properties (Bottom 25%) see earnings around $1,962, often with potential for optimization.
Average Monthly Airbnb Earnings Trend in Belfeld
Belfeld Airbnb Occupancy Rate Trends (2025)
Maximize your bookings by understanding the Belfeld STR occupancy trends. Seasonal demand shifts significantly influence how often properties are booked. Typically, Aprilsees the highest demand (peak season occupancy), while January experiences the lowest (low season). Effective strategies, like adjusting minimum stays or offering promotions, can boost occupancy during slower periods. Here's how different property tiers perform in Belfeld:
- Best-in-class properties (Top 10%) achieve 61%+ occupancy, indicating high desirability and potentially optimized availability.
- Strong performing properties (Top 25%) maintain 45% or higher occupancy, suggesting good market fit and guest satisfaction.
- Typical properties (Median) have an occupancy rate around 30%.
- Entry-level properties (Bottom 25%) average 16% occupancy, potentially facing higher vacancy.
Average Monthly Occupancy Rate Trend in Belfeld
Average Daily Rate (ADR) Airbnb Trends in Belfeld (2025)
Effective short term rental pricing strategy in Belfeld involves understanding monthly ADR fluctuations. The Average Daily Rate (ADR) for Airbnb in Belfeld typically peaks in August and dips lowest during November. Leveraging Airbnb dynamic pricing tools or strategies based on this seasonality can significantly boost revenue. Here's a look at the typical nightly rates achieved:
- Best-in-class properties (Top 10%) command rates of $382+ per night, often due to premium features or locations.
- Strong performing properties (Top 25%) achieve nightly rates of $290 or more.
- Typical properties (Median) charge around $236 per night.
- Entry-level properties (Bottom 25%) earn around $180 per night.
Average Daily Rate (ADR) Trend by Month in Belfeld
Get Live Belfeld Market Intelligence 👇

Explore Real-time Analytics
Airbnb Seasonality Analysis & Trends in Belfeld (2025)
Peak Season (May, April, June)
- Revenue averages $8,209 per month
- Occupancy rates average 60.4%
- Daily rates average $279
Shoulder Season
- Revenue averages $2,058 per month
- Occupancy maintains around 25.9%
- Daily rates hold near $243
Low Season (January, September, November)
- Revenue drops to average $1,181 per month
- Occupancy decreases to average 20.1%
- Daily rates adjust to average $205
Seasonality Insights for Belfeld
- The Airbnb seasonality in Belfeld shows highly seasonal trends requiring careful strategy. While the sections above show seasonal averages, it's also insightful to look at the extremes:
- During the high season, the absolute peak month showcases Belfeld's highest earning potential, with monthly revenues capable of climbing to $8,752, occupancy reaching a high of 64.6%, and ADRs peaking at $314.
- Conversely, the slowest single month of the year, typically falling within the low season, marks the market's lowest point. In this month, revenue might dip to $826, occupancy could drop to 8.9%, and ADRs may adjust down to $175.
- Understanding both the seasonal averages and these monthly peaks and troughs in revenue, occupancy, and ADR is crucial for maximizing your Airbnb profit potential in Belfeld.
Seasonal Strategies for Maximizing Profit
- Peak Season: Maximize revenue through premium pricing and potentially longer minimum stays. Ensure high availability.
- Low Season: Offer competitive pricing, special promotions (e.g., extended stay discounts), and flexible cancellation policies. Target off-season travelers like remote workers or budget-conscious guests.
- Shoulder Seasons: Implement dynamic pricing that balances peak and low rates. Target weekend travelers or specific events. Offer slightly more flexible terms than peak season.
- Regularly analyze your own performance against these Belfeld seasonality benchmarks and adjust your pricing and availability strategy accordingly.
Best Areas for Airbnb Investment in Belfeld (2025)
Exploring the top neighborhoods for short-term rentals in Belfeld? This section highlights key areas, outlining why they are attractive for hosts and guests, along with notable local attractions. Consider these locations based on your target guest profile and investment strategy.
| Neighborhood / Area | Why Host Here? (Target Guests & Appeal) | Key Attractions & Landmarks |
|---|---|---|
| Belfeld Village Center | Charming village atmosphere with local shops and cafes. Close to residential areas, making it appealing for families and visitors looking for a peaceful stay. | St. Martinus Church, Local restaurants, Village parks, Belfeld Market |
| Roermond Shopping District | Just a short drive away, Roermond is known for its outlet shopping center and vibrant city life, attracting shoppers and tourists throughout the year. | Designer Outlet Roermond, Roermond City Center, Museum van de Vrouw, Maasplassen Lake |
| Venlo City Center | Nearby Venlo offers diverse restaurants, cultural sites, and a lively atmosphere, making it a good location for various travelers. | Venlo Town Hall, Theater Venlo, St. Martinus Church, Jochum-Hof |
| Nature Reserves | Belfeld is surrounded by beautiful nature reserves ideal for outdoor enthusiasts looking for activities such as hiking and cycling, attracting nature lovers for accommodation. | Peijerhaof, Natuurgebied Rödgen, De Maasduinen National Park |
| Lomm | A quiet village situated near Belfeld, ideal for travelers looking for a getaway close to nature and local culture, providing a serene environment. | Local cycling paths, Village parks, Nearby restaurants |
| Grathem | A picturesque little community with beautiful landscapes and quaint streets, ideal for visitors seeking tranquility and a touch of local charm. | Historic buildings, Natural beauty, Local festivals |
| Kessel | Known for its historical significance and natural beauty, Kessel has become a popular spot for tourists and is quite accessible from Belfeld. | Castle Ter Borch, Kessel Castle, Cycling paths |
| Dining and Wine Tours | The surrounding area of Belfeld is known for its local cuisine and wine tours, making it an attractive destination for foodies and wine lovers. | Local wineries, Gastronomic restaurants, Wine tasting events |
Understanding Airbnb License Requirements & STR Laws in Belfeld (2025)
While Belfeld, Limburg, Netherlands currently shows low STR regulations, specific Airbnb license requirements might still exist or change. Always verify the latest short term rental regulations and Airbnb license requirements directly with local government authorities for Belfeld to ensure full compliance before hosting.
(Source: AirROI data, 2025, finding no licensed listings among those analyzed)
Top Performing Airbnb Properties in Belfeld (2025)
Benchmark your potential! Explore examples of top-performing Airbnb properties in Belfeldbased on Trailing Twelve Month (TTM) revenue. Analyze their characteristics, revenue, occupancy rate, and ADR to understand what drives success in this market.
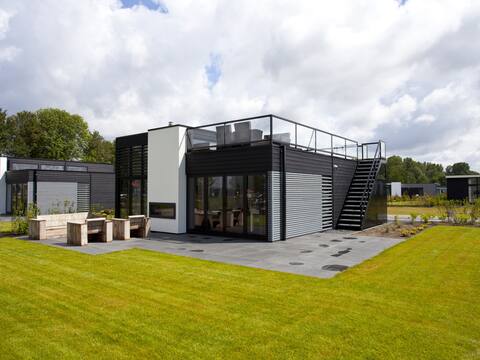
Luxurious house with a gas fireplace
Entire Place • 2 bedrooms
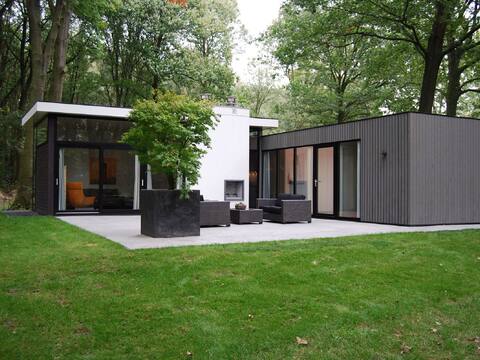
Modern house with dishwasher, near the Maasduinen
Entire Place • 3 bedrooms
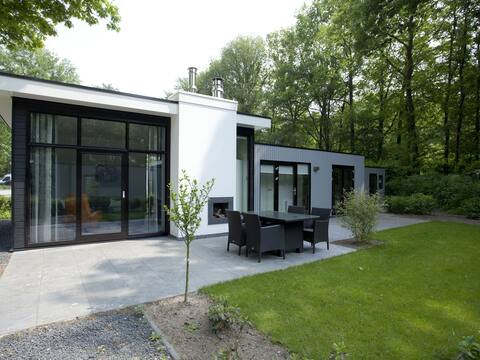
Modern house near a nature reserve
Entire Place • 2 bedrooms
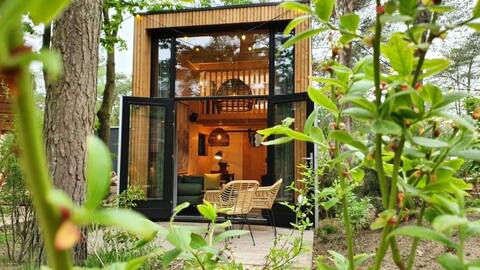
Tiny House 2
Entire Place • 1 bedroom
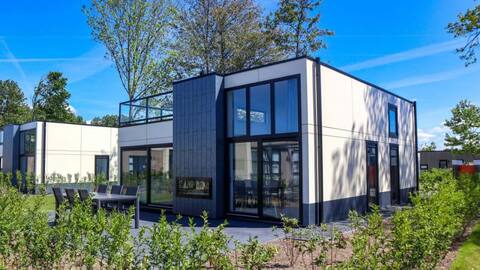
Cube Elite 6
Entire Place • 3 bedrooms
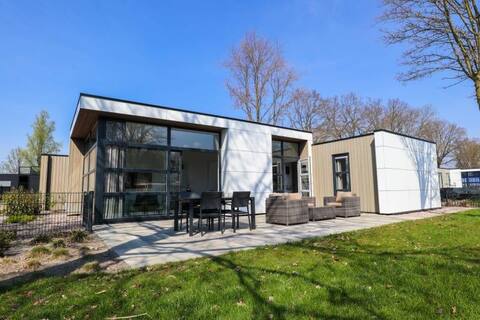
L-Cube 4
Entire Place • 2 bedrooms
Note: Performance varies based on location, size, amenities, seasonality, and management quality. Data reflects the past 12 months.
Top Performing Airbnb Hosts in Belfeld (2025)
Learn from the best! This table showcases top-performing Airbnb hosts in Belfeld based on the number of properties managed and estimated total revenue over the past year. Analyze their scale and performance metrics.
| Host Name | Properties | Grossing Revenue | Stay Reviews | Avg Rating |
|---|---|---|---|---|
| Host #387867368 | 15 | $333,647 | 67 | 3.86/5.0 |
| Diana - BELVILLA | 11 | $247,342 | 42 | 2.88/5.0 |
| Sebastiaan | 1 | $32,517 | 77 | 4.62/5.0 |
| Eugenie En Rens | 1 | $26,642 | 48 | 4.56/5.0 |
| Jan | 1 | $12,082 | 4 | 4.75/5.0 |
| Martin | 1 | $3,095 | 3 | 4.67/5.0 |
Analyzing the strategies of top hosts, such as their property selection, pricing, and guest communication, can offer valuable lessons for optimizing your own Airbnb operations in Belfeld.
Dive Deeper: Advanced Belfeld STR Market Data (2025)
Ready to unlock more insights? AirROI provides access to advanced metrics and comprehensive Airbnb data for Belfeld. Explore detailed analytics beyond this report to refine your investment strategy, optimize pricing, and maximize your vacation rental profits.
Explore Advanced MetricsBelfeld Short-Term Rental Market Composition (2025): Property & Room Types
Room Type Distribution
Property Type Distribution
Market Composition Insights for Belfeld
- The Belfeld Airbnb market composition is heavily skewed towards Entire Home/Apt listings, which make up 100% of the 30 active rentals. This indicates strong guest preference for privacy and space.
- Looking at the property type distribution in Belfeld, House properties are the most common (100%), reflecting the local real estate landscape.
- Houses represent a significant 100% portion, catering likely to families or larger groups.
Belfeld Airbnb Room Capacity Analysis (2025): Bedroom Distribution
Distribution of Listings by Number of Bedrooms
Room Capacity Insights for Belfeld
- The dominant room capacity in Belfeld is 2 bedrooms listings, making up 66.7% of the market. This suggests a strong demand for properties suitable for couples or solo travelers.
- Together, 2 bedrooms and 3 bedrooms properties represent 86.7% of the active Airbnb listings in Belfeld, indicating a high concentration in these sizes.
- A significant 23.3% of listings offer 3+ bedrooms, catering to larger groups and families seeking more space in Belfeld.
Belfeld Vacation Rental Guest Capacity Trends (2025)
Distribution of Listings by Guest Capacity
Guest Capacity Insights for Belfeld
- The most common guest capacity trend in Belfeld vacation rentals is listings accommodating 4 guests (63.3%). This suggests the primary traveler segment is likely small families or groups.
- Properties designed for 4 guests and 6 guests dominate the Belfeld STR market, accounting for 86.6% of listings.
- 26.6% of properties accommodate 6+ guests, serving the market segment for larger families or group travel in Belfeld.
- On average, properties in Belfeld are equipped to host 4.4 guests.
Belfeld Airbnb Booking Patterns (2025): Available vs. Booked Days
Available Days Distribution
Booked Days Distribution
Booking Pattern Insights for Belfeld
- The most common availability pattern in Belfeld falls within the 271-366 days range, representing 60% of listings. This suggests many properties have significant open periods on their calendars.
- Approximately 93.3% of listings show high availability (181+ days open annually), indicating potential for increased bookings or specific owner usage patterns.
- For booked days, the 91-180 days range is most frequent in Belfeld (36.7%), reflecting common guest stay durations or potential owner blocking patterns.
- A notable 6.7% of properties secure long booking periods (181+ days booked per year), highlighting successful long-term rental strategies or significant owner usage.
Belfeld Airbnb Minimum Stay Requirements Analysis
Distribution of Listings by Minimum Night Requirement
1 Night
4 listings
50% of total
2 Nights
2 listings
25% of total
3 Nights
2 listings
25% of total
Key Insights
- The most prevalent minimum stay requirement in Belfeld is 1 Night, adopted by 50% of listings. This highlights the market's preference for shorter, flexible bookings.
- A strong majority (75.0%) of the Belfeld Airbnb data shows acceptance of very short stays (1-2 nights), indicating a dynamic, high-turnover market.
Recommendations
- Align with the market by considering a 1 Night minimum stay, as 50% of Belfeld hosts use this setting.
- Adjust minimum nights based on seasonality – potentially shorter during low season and longer during peak demand periods in Belfeld.
Belfeld Airbnb Cancellation Policy Trends Analysis (2025)
Moderate
1 listings
12.5% of total
Strict
7 listings
87.5% of total
Cancellation Policy Insights for Belfeld
- The prevailing Airbnb cancellation policy trend in Belfeld is Strict, used by 87.5% of listings.
- A majority (87.5%) of hosts in Belfeld utilize Firm or Strict policies, indicating a market where hosts prioritize booking security.
Recommendations for Hosts
- Consider adopting a Strict policy to align with the 87.5% market standard in Belfeld.
- With 87.5% using Strict terms, this is a viable option in Belfeld, particularly for high-value properties or during peak demand periods.
- Regularly review your cancellation policy against competitors and market demand shifts in Belfeld.
Belfeld STR Booking Lead Time Analysis (2025)
Average Booking Lead Time by Month
Booking Lead Time Insights for Belfeld
- The overall average booking lead time for vacation rentals in Belfeld is 40 days.
- Guests book furthest in advance for stays during August (average 72 days), likely coinciding with peak travel demand or local events.
- The shortest booking windows occur for stays in February (average 23 days), indicating more last-minute travel plans during this time.
- Seasonally, Summer (65 days avg.) sees the longest lead times, while Fall (40 days avg.) has the shortest, reflecting typical travel planning cycles.
Recommendations for Hosts
- Use the overall average lead time (40 days) as a baseline for your pricing and availability strategy in Belfeld.
- For August stays, consider implementing length-of-stay discounts or slightly higher rates for bookings made less than 72 days out to capitalize on advance planning.
- Target marketing efforts for the Summer season well in advance (at least 65 days) to capture early planners.
- Monitor your own booking lead times against these Belfeld averages to identify opportunities for dynamic pricing adjustments.
Popular & Essential Airbnb Amenities in Belfeld (2025)
Amenity Prevalence
Amenity Insights for Belfeld
- Essential amenities in Belfeld that guests expect include: Wifi, Private entrance, Heating, TV, Kitchen, Coffee maker. Lacking these (any) could significantly impact bookings.
- Popular amenities like Smoke alarm, Hot water, Carbon monoxide alarm are common but not universal. Offering these can provide a competitive edge.
Recommendations for Hosts
- Ensure your listing includes all essential amenities for Belfeld: Wifi, Private entrance, Heating, TV, Kitchen, Coffee maker.
- Prioritize adding missing essentials: Coffee maker.
- Consider adding popular differentiators like Smoke alarm or Hot water to increase appeal.
- Highlight unique or less common amenities you offer (e.g., hot tub, dedicated workspace, EV charger) in your listing description and photos.
- Regularly check competitor amenities in Belfeld to stay competitive.
Belfeld Airbnb Guest Demographics & Profile Analysis (2025)
Guest Profile Summary for Belfeld
- The typical guest profile for Airbnb in Belfeld consists of predominantly international visitors (77%), with top international origins including Netherlands, typically belonging to the Post-2000s (Gen Z/Alpha) group (50%), primarily speaking English or German.
- Domestic travelers account for 23.5% of guests.
- Key international markets include Germany (47.1%) and Netherlands (23.5%).
- Top languages spoken are English (42.1%) followed by German (26.3%).
- A significant demographic segment is the Post-2000s (Gen Z/Alpha) group, representing 50% of guests.
Recommendations for Hosts
- Focus marketing internationally, particularly towards travelers from Netherlands.
- Tailor amenities and listing descriptions to appeal to the dominant Post-2000s (Gen Z/Alpha) demographic (e.g., highlight fast WiFi, smart home features, local guides).
- Highlight unique local experiences or amenities relevant to the primary guest profile.
- Consider seasonal promotions aligned with peak travel times for key origin markets.
Nearby Short-Term Rental Market Comparison
How does the Belfeld Airbnb market stack up against its neighbors? Compare key performance metrics like average monthly revenue, ADR, and occupancy rates in surrounding areas to understand the broader regional STR landscape.
| Market | Active Properties | Monthly Revenue | Daily Rate | Avg. Occupancy |
|---|---|---|---|---|
| Baarlo | 18 | $5,602 | $313.73 | 60% |
| Rijs | 27 | $3,772 | $356.97 | 45% |
| Kerkdriel | 25 | $3,607 | $323.16 | 40% |
| Kortenhoef | 15 | $3,495 | $255.48 | 53% |
| Ondenval | 10 | $3,432 | $235.00 | 45% |
| Aubel | 33 | $3,418 | $244.77 | 44% |
| Saint-Hubert | 28 | $3,414 | $294.66 | 41% |
| Heusden-Zolder | 14 | $3,392 | $290.06 | 44% |
| Samrée | 16 | $3,330 | $366.11 | 30% |
| Bertogne | 30 | $3,297 | $296.96 | 38% |