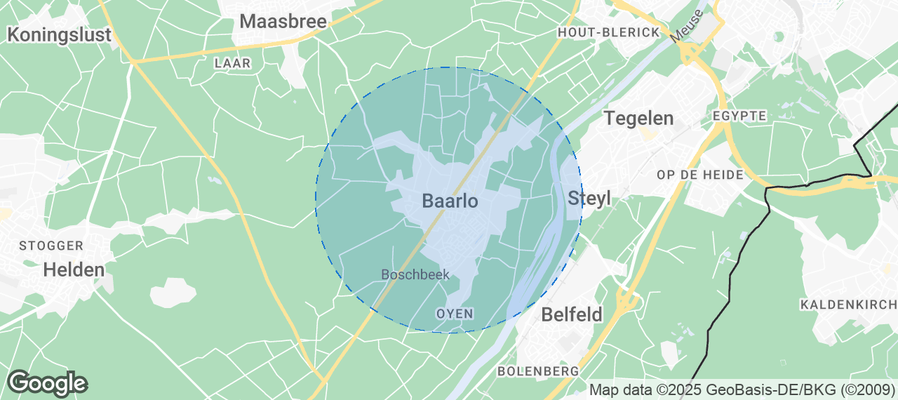
Baarlo Airbnb Market Analysis 2025: Short Term Rental Data & Vacation Rental Statistics in Limburg, Netherlands
Is Airbnb profitable in Baarlo in 2025? Explore comprehensive Airbnb analytics for Baarlo, Limburg, Netherlands to uncover income potential. This 2025 STR market report for Baarlo, based on AirROI data from April 2024 to March 2025, reveals key trends in the niche market of 18 active listings.
Whether you're considering an Airbnb investment in Baarlo, optimizing your existing vacation rental, or exploring rental arbitrage opportunities, understanding the Baarlo Airbnb data is crucial. Leveraging the low regulation environment is key to maximizing your short term rental income potential. Let's dive into the specifics.
Key Baarlo Airbnb Performance Metrics Overview
Monthly Airbnb Revenue Variations & Income Potential in Baarlo (2025)
Understanding the monthly revenue variations for Airbnb listings in Baarlo is key to maximizing your short term rental income potential. Seasonality significantly impacts earnings. Our analysis, based on data from the past 12 months, shows that the peak revenue month for STRs in Baarlo is typically August, while February often presents the lowest earnings, highlighting opportunities for strategic pricing adjustments during shoulder and low seasons. Explore the typical Airbnb income in Baarlo across different performance tiers:
- Best-in-class properties (Top 10%) achieve $13,225+ monthly, often utilizing dynamic pricing and superior guest experiences.
- Strong performing properties (Top 25%) earn $8,635 or more, indicating effective management and desirable locations/amenities.
- Typical properties (Median) generate around $4,919 per month, representing the average market performance.
- Entry-level properties (Bottom 25%) see earnings around $2,951, often with potential for optimization.
Average Monthly Airbnb Earnings Trend in Baarlo
Baarlo Airbnb Occupancy Rate Trends (2025)
Maximize your bookings by understanding the Baarlo STR occupancy trends. Seasonal demand shifts significantly influence how often properties are booked. Typically, Augustsees the highest demand (peak season occupancy), while February experiences the lowest (low season). Effective strategies, like adjusting minimum stays or offering promotions, can boost occupancy during slower periods. Here's how different property tiers perform in Baarlo:
- Best-in-class properties (Top 10%) achieve 82%+ occupancy, indicating high desirability and potentially optimized availability.
- Strong performing properties (Top 25%) maintain 73% or higher occupancy, suggesting good market fit and guest satisfaction.
- Typical properties (Median) have an occupancy rate around 59%.
- Entry-level properties (Bottom 25%) average 47% occupancy, potentially facing higher vacancy.
Average Monthly Occupancy Rate Trend in Baarlo
Average Daily Rate (ADR) Airbnb Trends in Baarlo (2025)
Effective short term rental pricing strategy in Baarlo involves understanding monthly ADR fluctuations. The Average Daily Rate (ADR) for Airbnb in Baarlo typically peaks in December and dips lowest during April. Leveraging Airbnb dynamic pricing tools or strategies based on this seasonality can significantly boost revenue. Here's a look at the typical nightly rates achieved:
- Best-in-class properties (Top 10%) command rates of $576+ per night, often due to premium features or locations.
- Strong performing properties (Top 25%) achieve nightly rates of $426 or more.
- Typical properties (Median) charge around $226 per night.
- Entry-level properties (Bottom 25%) earn around $131 per night.
Average Daily Rate (ADR) Trend by Month in Baarlo
Get Live Baarlo Market Intelligence 👇
Explore Real-time Analytics
Airbnb Seasonality Analysis & Trends in Baarlo (2025)
Peak Season (August, July, October)
- Revenue averages $8,287 per month
- Occupancy rates average 74.8%
- Daily rates average $282
Shoulder Season
- Revenue averages $6,176 per month
- Occupancy maintains around 61.6%
- Daily rates hold near $280
Low Season (January, February, March)
- Revenue drops to average $4,284 per month
- Occupancy decreases to average 38.0%
- Daily rates adjust to average $301
Seasonality Insights for Baarlo
- The Airbnb seasonality in Baarlo shows highly seasonal trends requiring careful strategy. While the sections above show seasonal averages, it's also insightful to look at the extremes:
- During the high season, the absolute peak month showcases Baarlo's highest earning potential, with monthly revenues capable of climbing to $9,866, occupancy reaching a high of 80.1%, and ADRs peaking at $310.
- Conversely, the slowest single month of the year, typically falling within the low season, marks the market's lowest point. In this month, revenue might dip to $3,593, occupancy could drop to 30.2%, and ADRs may adjust down to $258.
- Understanding both the seasonal averages and these monthly peaks and troughs in revenue, occupancy, and ADR is crucial for maximizing your Airbnb profit potential in Baarlo.
Seasonal Strategies for Maximizing Profit
- Peak Season: Maximize revenue through premium pricing and potentially longer minimum stays. Ensure high availability.
- Low Season: Offer competitive pricing, special promotions (e.g., extended stay discounts), and flexible cancellation policies. Target off-season travelers like remote workers or budget-conscious guests.
- Shoulder Seasons: Implement dynamic pricing that balances peak and low rates. Target weekend travelers or specific events. Offer slightly more flexible terms than peak season.
- Regularly analyze your own performance against these Baarlo seasonality benchmarks and adjust your pricing and availability strategy accordingly.
Best Areas for Airbnb Investment in Baarlo (2025)
Exploring the top neighborhoods for short-term rentals in Baarlo? This section highlights key areas, outlining why they are attractive for hosts and guests, along with notable local attractions. Consider these locations based on your target guest profile and investment strategy.
| Neighborhood / Area | Why Host Here? (Target Guests & Appeal) | Key Attractions & Landmarks |
|---|---|---|
| Baarlo Centrum | The picturesque center of Baarlo is known for its charming streets, historical buildings, and local shops. It provides a great experience for visitors wanting to explore Dutch culture and history. | Kasteel Ter Borch, Molen van Baarlo, Local cafes and restaurants, Baarlo Market, Historical buildings |
| Kasteel Baarlo | This area is famous for the beautiful castle and its surroundings. It attracts tourists interested in history and nature. | Kasteel Ter Borch, Baarlo Park, Nature trails, Scenic views, Photography spots |
| Baarlo Nature Park | A tranquil area featuring lush greenery and walking trails, perfect for nature lovers and families looking for outdoor activities. | Walking trails, Picnic areas, Birdwatching, Cycling paths, Family-friendly outdoor activities |
| Baarlo Cycling Routes | With its flat terrain and beautiful scenery, Baarlo is an ideal spot for cycling enthusiasts exploring the Limburg region. | Cycling trails, Bike rental shops, Scenic villages, Countryside views, Cycling events |
| De Maas, | N/A | |
| Festivals in Baarlo | Baarlo hosts several local festivals throughout the year, attracting visitors interested in local culture and community events. | Annual local festivals, Cultural activities, Food markets, Live music, Artisan markets |
| Nearby Venlo | The city of Venlo is just a short drive away and offers a range of attractions including shopping, dining, and entertainment for visitors staying in Baarlo. | Museum van Bommel van Dam, Venlo City Center, Shopping districts, Restaurants, Cultural events |
| Proximity to German border | Baarlo's location near the German border makes it popular with visitors looking to explore both Dutch and German culture and attractions. | Shopping in Germany, Cross-border cultural events, Scenic drives, Local cuisine, Historical sites near the border |
Understanding Airbnb License Requirements & STR Laws in Baarlo (2025)
While Baarlo, Limburg, Netherlands currently shows low STR regulations, specific Airbnb license requirements might still exist or change. Always verify the latest short term rental regulations and Airbnb license requirements directly with local government authorities for Baarlo to ensure full compliance before hosting.
(Source: AirROI data, 2025, finding no licensed listings among those analyzed)
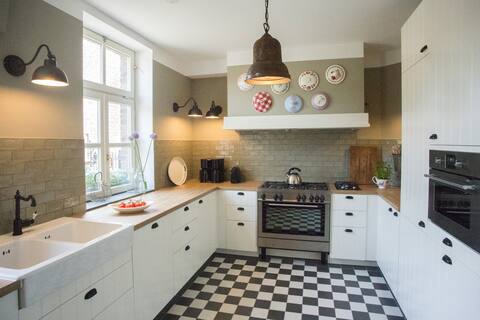
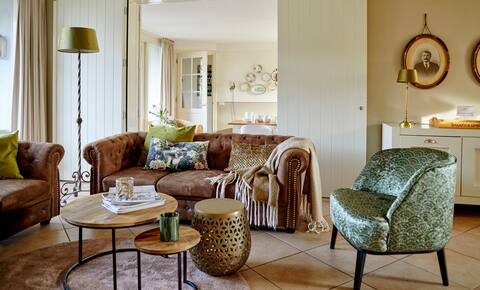
Top Performing Airbnb Properties in Baarlo (2025)
Benchmark your potential! Explore examples of top-performing Airbnb properties in Baarlobased on Trailing Twelve Month (TTM) revenue. Analyze their characteristics, revenue, occupancy rate, and ADR to understand what drives success in this market.
Authentic 20 person Castle Farm
Entire Place • 9 bedrooms

Very big luxury 18p. Vacation home
Entire Place • 7 bedrooms

Kasteelhoeve & 't Knechthuys
Entire Place • 5 bedrooms

Luxurious holiday cottage (16 persons) Limburg
Entire Place • 8 bedrooms
Luxury 14 p. Holiday home in Baarlo
Entire Place • 6 bedrooms

Luxury 14p. family Vacation home
Entire Place • 6 bedrooms
Note: Performance varies based on location, size, amenities, seasonality, and management quality. Data reflects the past 12 months.
Top Performing Airbnb Hosts in Baarlo (2025)
Learn from the best! This table showcases top-performing Airbnb hosts in Baarlo based on the number of properties managed and estimated total revenue over the past year. Analyze their scale and performance metrics.
| Host Name | Properties | Grossing Revenue | Stay Reviews | Avg Rating |
|---|---|---|---|---|
| Bart & Liesbeth | 11 | $840,925 | 464 | 4.85/5.0 |
| Renée | 3 | $200,358 | 69 | 4.91/5.0 |
| Fruitboerderij | 1 | $130,997 | 81 | 4.88/5.0 |
| Lion | 1 | $19,342 | 10 | 4.80/5.0 |
| Pieter En José | 1 | $12,103 | 45 | 4.96/5.0 |
| Marilola | 1 | $6,251 | 101 | 4.86/5.0 |
Analyzing the strategies of top hosts, such as their property selection, pricing, and guest communication, can offer valuable lessons for optimizing your own Airbnb operations in Baarlo.
Dive Deeper: Advanced Baarlo STR Market Data (2025)
Ready to unlock more insights? AirROI provides access to advanced metrics and comprehensive Airbnb data for Baarlo. Explore detailed analytics beyond this report to refine your investment strategy, optimize pricing, and maximize your vacation rental profits.
Explore Advanced MetricsBaarlo Short-Term Rental Market Composition (2025): Property & Room Types
Room Type Distribution
Property Type Distribution
Market Composition Insights for Baarlo
- The Baarlo Airbnb market composition is heavily skewed towards Entire Home/Apt listings, which make up 94.4% of the 18 active rentals. This indicates strong guest preference for privacy and space.
- Looking at the property type distribution in Baarlo, House properties are the most common (83.3%), reflecting the local real estate landscape.
- Houses represent a significant 83.3% portion, catering likely to families or larger groups.
- The presence of 11.1% Hotel/Boutique listings indicates integration with traditional hospitality.
Baarlo Airbnb Room Capacity Analysis (2025): Bedroom Distribution
Distribution of Listings by Number of Bedrooms
Room Capacity Insights for Baarlo
- The dominant room capacity in Baarlo is 5+ bedrooms listings, making up 33.3% of the market. This suggests a strong demand for properties suitable for families or small groups.
- Together, 5+ bedrooms and 3 bedrooms properties represent 55.5% of the active Airbnb listings in Baarlo, indicating a high concentration in these sizes.
- A significant 72.2% of listings offer 3+ bedrooms, catering to larger groups and families seeking more space in Baarlo.
Baarlo Vacation Rental Guest Capacity Trends (2025)
Distribution of Listings by Guest Capacity
Guest Capacity Insights for Baarlo
- The most common guest capacity trend in Baarlo vacation rentals is listings accommodating 8+ guests (50%). This suggests the primary traveler segment is likely larger groups.
- Properties designed for 8+ guests and 7 guests dominate the Baarlo STR market, accounting for 72.2% of listings.
- 72.2% of properties accommodate 6+ guests, serving the market segment for larger families or group travel in Baarlo.
- On average, properties in Baarlo are equipped to host 6.1 guests.
Baarlo Airbnb Booking Patterns (2025): Available vs. Booked Days
Available Days Distribution
Booked Days Distribution
Booking Pattern Insights for Baarlo
- The most common availability pattern in Baarlo falls within the 91-180 days range, representing 72.2% of listings. This suggests many properties have significant open periods on their calendars.
- Approximately 27.8% of listings show high availability (181+ days open annually), indicating potential for increased bookings or specific owner usage patterns.
- For booked days, the 181-270 days range is most frequent in Baarlo (72.2%), reflecting common guest stay durations or potential owner blocking patterns.
- A notable 72.2% of properties secure long booking periods (181+ days booked per year), highlighting successful long-term rental strategies or significant owner usage.
Baarlo Airbnb Minimum Stay Requirements Analysis
Distribution of Listings by Minimum Night Requirement
1 Night
2 listings
11.1% of total
2 Nights
1 listings
5.6% of total
4-6 Nights
1 listings
5.6% of total
30+ Nights
14 listings
77.8% of total
Key Insights
- The most prevalent minimum stay requirement in Baarlo is 30+ Nights, adopted by 77.8% of listings. This highlights the market's preference for longer commitments.
- Very short stays (1-2 nights) are less common (16.7%), suggesting hosts prefer slightly longer bookings to optimize turnover.
- A significant segment (77.8%) caters to monthly stays (30+ nights) in Baarlo, pointing to opportunities in the extended-stay market.
Recommendations
- Align with the market by considering a 30+ Nights minimum stay, as 77.8% of Baarlo hosts use this setting.
- If feasible, allowing 1-night stays, especially midweek or during low season, could capture last-minute bookings, as only 11.1% currently do.
- Explore offering discounts for stays of 30+ nights to attract the 77.8% of the market seeking extended stays.
- Adjust minimum nights based on seasonality – potentially shorter during low season and longer during peak demand periods in Baarlo.
Baarlo Airbnb Cancellation Policy Trends Analysis (2025)
Super Strict 60 Days
2 listings
11.1% of total
Flexible
1 listings
5.6% of total
Moderate
2 listings
11.1% of total
Firm
11 listings
61.1% of total
Strict
2 listings
11.1% of total
Cancellation Policy Insights for Baarlo
- The prevailing Airbnb cancellation policy trend in Baarlo is Firm, used by 61.1% of listings.
- A majority (72.2%) of hosts in Baarlo utilize Firm or Strict policies, indicating a market where hosts prioritize booking security.
Recommendations for Hosts
- Consider adopting a Firm policy to align with the 61.1% market standard in Baarlo.
- Using a Strict policy might deter some guests, as only 11.1% of listings use it. Evaluate if potential revenue protection outweighs possible lower booking rates.
- Regularly review your cancellation policy against competitors and market demand shifts in Baarlo.
Baarlo STR Booking Lead Time Analysis (2025)
Average Booking Lead Time by Month
Booking Lead Time Insights for Baarlo
- The overall average booking lead time for vacation rentals in Baarlo is 149 days.
- Guests book furthest in advance for stays during October (average 216 days), likely coinciding with peak travel demand or local events.
- The shortest booking windows occur for stays in March (average 77 days), indicating more last-minute travel plans during this time.
- Seasonally, Fall (175 days avg.) sees the longest lead times, while Winter (98 days avg.) has the shortest, reflecting typical travel planning cycles.
Recommendations for Hosts
- Use the overall average lead time (149 days) as a baseline for your pricing and availability strategy in Baarlo.
- For October stays, consider implementing length-of-stay discounts or slightly higher rates for bookings made less than 216 days out to capitalize on advance planning.
- Target marketing efforts for the Fall season well in advance (at least 175 days) to capture early planners.
- Monitor your own booking lead times against these Baarlo averages to identify opportunities for dynamic pricing adjustments.
Popular & Essential Airbnb Amenities in Baarlo (2025)
Amenity Prevalence
Amenity Insights for Baarlo
- Essential amenities in Baarlo that guests expect include: Free parking on premises, TV, Hair dryer, Heating, Smoke alarm, Wifi. Lacking these (any) could significantly impact bookings.
- Popular amenities like Dishes and silverware, Refrigerator, Kitchen are common but not universal. Offering these can provide a competitive edge.
Recommendations for Hosts
- Ensure your listing includes all essential amenities for Baarlo: Free parking on premises, TV, Hair dryer, Heating, Smoke alarm, Wifi.
- Consider adding popular differentiators like Dishes and silverware or Refrigerator to increase appeal.
- Highlight unique or less common amenities you offer (e.g., hot tub, dedicated workspace, EV charger) in your listing description and photos.
- Regularly check competitor amenities in Baarlo to stay competitive.
Baarlo Airbnb Guest Demographics & Profile Analysis (2025)
Guest Profile Summary for Baarlo
- The typical guest profile for Airbnb in Baarlo consists of a mix of domestic (37%) and international guests, with top international origins including Netherlands, typically belonging to the Post-2000s (Gen Z/Alpha) group (50%), primarily speaking English or German.
- Domestic travelers account for 36.6% of guests.
- Key international markets include Germany (39%) and Netherlands (36.6%).
- Top languages spoken are English (38.1%) followed by German (21.6%).
- A significant demographic segment is the Post-2000s (Gen Z/Alpha) group, representing 50% of guests.
Recommendations for Hosts
- Focus marketing internationally, particularly towards travelers from Netherlands.
- Tailor amenities and listing descriptions to appeal to the dominant Post-2000s (Gen Z/Alpha) demographic (e.g., highlight fast WiFi, smart home features, local guides).
- Highlight unique local experiences or amenities relevant to the primary guest profile.
- Consider seasonal promotions aligned with peak travel times for key origin markets.
Nearby Short-Term Rental Market Comparison
How does the Baarlo Airbnb market stack up against its neighbors? Compare key performance metrics like average monthly revenue, ADR, and occupancy rates in surrounding areas to understand the broader regional STR landscape.
| Market | Active Properties | Monthly Revenue | Daily Rate | Avg. Occupancy |
|---|---|---|---|---|
| Rijs | 27 | $3,772 | $356.97 | 45% |
| Kerkdriel | 25 | $3,607 | $323.16 | 40% |
| Kortenhoef | 15 | $3,495 | $255.48 | 53% |
| Ondenval | 10 | $3,432 | $235.00 | 45% |
| Aubel | 33 | $3,418 | $244.77 | 44% |
| Saint-Hubert | 28 | $3,414 | $294.66 | 41% |
| Heusden-Zolder | 14 | $3,392 | $290.06 | 44% |
| Samrée | 16 | $3,330 | $366.11 | 30% |
| Bertogne | 30 | $3,297 | $296.96 | 38% |
| Muiden | 29 | $3,226 | $291.72 | 48% |