America Airbnb Market Analysis 2025: Short Term Rental Data & Vacation Rental Statistics in Limburg, Netherlands
Is Airbnb profitable in America in 2025? Explore comprehensive Airbnb analytics for America, Limburg, Netherlands to uncover income potential. This 2025 STR market report for America, based on AirROI data from April 2024 to March 2025, reveals key trends in the niche market of 22 active listings.
Whether you're considering an Airbnb investment in America, optimizing your existing vacation rental, or exploring rental arbitrage opportunities, understanding the America Airbnb data is crucial. Leveraging the low regulation environment is key to maximizing your short term rental income potential. Let's dive into the specifics.
Key America Airbnb Performance Metrics Overview
Monthly Airbnb Revenue Variations & Income Potential in America (2025)
Understanding the monthly revenue variations for Airbnb listings in America is key to maximizing your short term rental income potential. Seasonality significantly impacts earnings. Our analysis, based on data from the past 12 months, shows that the peak revenue month for STRs in America is typically June, while March often presents the lowest earnings, highlighting opportunities for strategic pricing adjustments during shoulder and low seasons. Explore the typical Airbnb income in America across different performance tiers:
- Best-in-class properties (Top 10%) achieve $6,115+ monthly, often utilizing dynamic pricing and superior guest experiences.
- Strong performing properties (Top 25%) earn $4,019 or more, indicating effective management and desirable locations/amenities.
- Typical properties (Median) generate around $2,676 per month, representing the average market performance.
- Entry-level properties (Bottom 25%) see earnings around $1,788, often with potential for optimization.
Average Monthly Airbnb Earnings Trend in America
America Airbnb Occupancy Rate Trends (2025)
Maximize your bookings by understanding the America STR occupancy trends. Seasonal demand shifts significantly influence how often properties are booked. Typically, Junesees the highest demand (peak season occupancy), while March experiences the lowest (low season). Effective strategies, like adjusting minimum stays or offering promotions, can boost occupancy during slower periods. Here's how different property tiers perform in America:
- Best-in-class properties (Top 10%) achieve 64%+ occupancy, indicating high desirability and potentially optimized availability.
- Strong performing properties (Top 25%) maintain 45% or higher occupancy, suggesting good market fit and guest satisfaction.
- Typical properties (Median) have an occupancy rate around 33%.
- Entry-level properties (Bottom 25%) average 26% occupancy, potentially facing higher vacancy.
Average Monthly Occupancy Rate Trend in America
Average Daily Rate (ADR) Airbnb Trends in America (2025)
Effective short term rental pricing strategy in America involves understanding monthly ADR fluctuations. The Average Daily Rate (ADR) for Airbnb in America typically peaks in December and dips lowest during September. Leveraging Airbnb dynamic pricing tools or strategies based on this seasonality can significantly boost revenue. Here's a look at the typical nightly rates achieved:
- Best-in-class properties (Top 10%) command rates of $313+ per night, often due to premium features or locations.
- Strong performing properties (Top 25%) achieve nightly rates of $278 or more.
- Typical properties (Median) charge around $215 per night.
- Entry-level properties (Bottom 25%) earn around $78 per night.
Average Daily Rate (ADR) Trend by Month in America
Get Live America Market Intelligence 👇

Explore Real-time Analytics
Airbnb Seasonality Analysis & Trends in America (2025)
Peak Season (June, May, April)
- Revenue averages $6,225 per month
- Occupancy rates average 63.4%
- Daily rates average $206
Shoulder Season
- Revenue averages $2,769 per month
- Occupancy maintains around 34.4%
- Daily rates hold near $211
Low Season (January, February, March)
- Revenue drops to average $1,219 per month
- Occupancy decreases to average 19.4%
- Daily rates adjust to average $195
Seasonality Insights for America
- The Airbnb seasonality in America shows highly seasonal trends requiring careful strategy. While the sections above show seasonal averages, it's also insightful to look at the extremes:
- During the high season, the absolute peak month showcases America's highest earning potential, with monthly revenues capable of climbing to $6,683, occupancy reaching a high of 83.3%, and ADRs peaking at $270.
- Conversely, the slowest single month of the year, typically falling within the low season, marks the market's lowest point. In this month, revenue might dip to $1,122, occupancy could drop to 17.4%, and ADRs may adjust down to $165.
- Understanding both the seasonal averages and these monthly peaks and troughs in revenue, occupancy, and ADR is crucial for maximizing your Airbnb profit potential in America.
Seasonal Strategies for Maximizing Profit
- Peak Season: Maximize revenue through premium pricing and potentially longer minimum stays. Ensure high availability.
- Low Season: Offer competitive pricing, special promotions (e.g., extended stay discounts), and flexible cancellation policies. Target off-season travelers like remote workers or budget-conscious guests.
- Shoulder Seasons: Implement dynamic pricing that balances peak and low rates. Target weekend travelers or specific events. Offer slightly more flexible terms than peak season.
- Regularly analyze your own performance against these America seasonality benchmarks and adjust your pricing and availability strategy accordingly.
Best Areas for Airbnb Investment in America (2025)
Exploring the top neighborhoods for short-term rentals in America? This section highlights key areas, outlining why they are attractive for hosts and guests, along with notable local attractions. Consider these locations based on your target guest profile and investment strategy.
| Neighborhood / Area | Why Host Here? (Target Guests & Appeal) | Key Attractions & Landmarks |
|---|---|---|
| Amsterdam | A major hub for tourism and culture in the Netherlands, featuring historic canals, museums, and vibrant nightlife. Amsterdam attracts millions of visitors each year, making it a prime location for hosting Airbnb accommodations. | Rijksmuseum, Van Gogh Museum, Canal Ring, Anne Frank House, Dam Square, Vondelpark |
| Utrecht | Known for its medieval architecture and scenic canals, Utrecht is a charming city that attracts tourists and students alike. Its vibrant atmosphere and historic charm make it an appealing location for short-term rentals. | Utrecht Dom Tower, Oude Gracht, Museum Speelklok, Railway Museum, Botanical Gardens Utrecht, Griftpark |
| Rotterdam | A modern city known for its stunning architecture and extensive cultural scene. Rotterdam is becoming increasingly popular with travelers, making it a great area for Airbnb hosting, especially among those seeking a modern experience in the Netherlands. | Markthal, Erasmus Bridge, Kunsthal Rotterdam, Cube Houses, Waterfront, Museum Boijmans Van Beuningen |
| The Hague | As the political center of the Netherlands, The Hague has a unique blend of culture, history, and beach access. It attracts both business and leisure travelers, providing a steady market for Airbnb hosts. | Mauritshuis, Scheveningen Beach, Peace Palace, Binnenhof, Escher Museum, Madurodam |
| Zandvoort | A popular beach destination close to Amsterdam, Zandvoort attracts many beachgoers during the summer. The demand for short-term accommodations rises significantly here, making it a lucrative location for Airbnb. | Zandvoort Beach, Circuit Park Zandvoort, National Park Zuid-Kennumerland, Beach Club Zand, Juttersmu-Zee-um |
| Leiden | With its prestigious university and rich history, Leiden attracts students and tourists looking for a more authentic Dutch experience. Its picturesque streets and canals are a draw for many visitors. | Leiden University, Rijksmuseum van Oudheden, Botanical Garden, Molen de Valk, National Museum of Antiquities |
| Nijmegen | One of the oldest cities in the Netherlands, Nijmegen has a vibrant history and numerous festivals. The city's unique character and historical significance attract many visitors throughout the year. | Valkhof Museum, Nijmegen Bridge, Grote Markt, Lange Hezelstraat, Saint Stevenskerk |
| Groningen | Known for its youthful energy due to the large student population, Groningen offers a unique cultural experience and has a bustling city life. It is increasingly popular with tourists looking for an off-the-beaten-path experience. | Groninger Museum, Martinitoren, Noorderplantsoen, Folkingestraat, Vismarkt |
Understanding Airbnb License Requirements & STR Laws in America (2025)
While America, Limburg, Netherlands currently shows low STR regulations, specific Airbnb license requirements might still exist or change. Always verify the latest short term rental regulations and Airbnb license requirements directly with local government authorities for America to ensure full compliance before hosting.
(Source: AirROI data, 2025, finding no licensed listings among those analyzed)
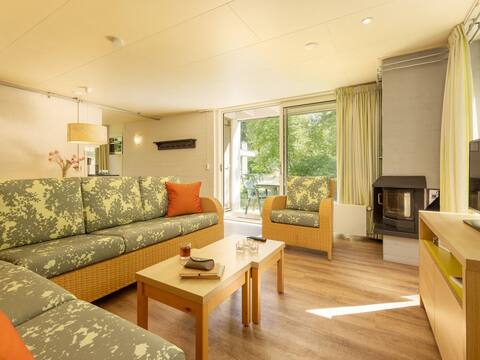
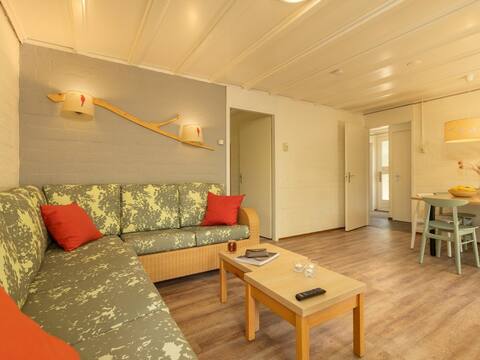
Top Performing Airbnb Properties in America (2025)
Benchmark your potential! Explore examples of top-performing Airbnb properties in Americabased on Trailing Twelve Month (TTM) revenue. Analyze their characteristics, revenue, occupancy rate, and ADR to understand what drives success in this market.

cottage Premium 8 persons
Entire Place • 4 bedrooms

cottage Comfort 6 persons
Entire Place • 4 bedrooms
cottage 6 persons
Entire Place • 3 bedrooms

cottage 7 persons
Entire Place • 4 bedrooms

cottage VIP 4 persons
Entire Place • 2 bedrooms
cottage 5 persons
Entire Place • 3 bedrooms
Note: Performance varies based on location, size, amenities, seasonality, and management quality. Data reflects the past 12 months.
Top Performing Airbnb Hosts in America (2025)
Learn from the best! This table showcases top-performing Airbnb hosts in America based on the number of properties managed and estimated total revenue over the past year. Analyze their scale and performance metrics.
| Host Name | Properties | Grossing Revenue | Stay Reviews | Avg Rating |
|---|---|---|---|---|
| Center Parcs Europe | 15 | $222,171 | 6 | 0.27/5.0 |
| Center Parcs Europe | 7 | $130,018 | 23 | 2.44/5.0 |
Analyzing the strategies of top hosts, such as their property selection, pricing, and guest communication, can offer valuable lessons for optimizing your own Airbnb operations in America.
Dive Deeper: Advanced America STR Market Data (2025)
Ready to unlock more insights? AirROI provides access to advanced metrics and comprehensive Airbnb data for America. Explore detailed analytics beyond this report to refine your investment strategy, optimize pricing, and maximize your vacation rental profits.
Explore Advanced MetricsAmerica Short-Term Rental Market Composition (2025): Property & Room Types
Room Type Distribution
Property Type Distribution
Market Composition Insights for America
- The America Airbnb market composition is heavily skewed towards Entire Home/Apt listings, which make up 100% of the 22 active rentals. This indicates strong guest preference for privacy and space.
- Looking at the property type distribution in America, House properties are the most common (100%), reflecting the local real estate landscape.
- Houses represent a significant 100% portion, catering likely to families or larger groups.
America Airbnb Room Capacity Analysis (2025): Bedroom Distribution
Distribution of Listings by Number of Bedrooms
Room Capacity Insights for America
- The dominant room capacity in America is 2 bedrooms listings, making up 36.4% of the market. This suggests a strong demand for properties suitable for couples or solo travelers.
- Together, 2 bedrooms and 3 bedrooms properties represent 68.2% of the active Airbnb listings in America, indicating a high concentration in these sizes.
- A significant 54.5% of listings offer 3+ bedrooms, catering to larger groups and families seeking more space in America.
America Vacation Rental Guest Capacity Trends (2025)
Distribution of Listings by Guest Capacity
Guest Capacity Insights for America
- The most common guest capacity trend in America vacation rentals is listings accommodating 4 guests (31.8%). This suggests the primary traveler segment is likely small families or groups.
- Properties designed for 4 guests and 6 guests dominate the America STR market, accounting for 59.1% of listings.
- 40.9% of properties accommodate 6+ guests, serving the market segment for larger families or group travel in America.
- On average, properties in America are equipped to host 5.0 guests.
America Airbnb Booking Patterns (2025): Available vs. Booked Days
Available Days Distribution
Booked Days Distribution
Booking Pattern Insights for America
- The most common availability pattern in America falls within the 271-366 days range, representing 63.6% of listings. This suggests many properties have significant open periods on their calendars.
- Approximately 100.0% of listings show high availability (181+ days open annually), indicating potential for increased bookings or specific owner usage patterns.
- For booked days, the 91-180 days range is most frequent in America (36.4%), reflecting common guest stay durations or potential owner blocking patterns.
America Airbnb Minimum Stay Requirements Analysis
Distribution of Listings by Minimum Night Requirement
1 Night
4 listings
18.2% of total
2 Nights
8 listings
36.4% of total
30+ Nights
10 listings
45.5% of total
Key Insights
- The most prevalent minimum stay requirement in America is 30+ Nights, adopted by 45.5% of listings. This highlights the market's preference for longer commitments.
- A significant segment (45.5%) caters to monthly stays (30+ nights) in America, pointing to opportunities in the extended-stay market.
Recommendations
- Align with the market by considering a 30+ Nights minimum stay, as 45.5% of America hosts use this setting.
- If feasible, allowing 1-night stays, especially midweek or during low season, could capture last-minute bookings, as only 18.2% currently do.
- A 2-night minimum appears standard (36.4%). Consider this for weekends or peak periods.
- Explore offering discounts for stays of 30+ nights to attract the 45.5% of the market seeking extended stays.
- Adjust minimum nights based on seasonality – potentially shorter during low season and longer during peak demand periods in America.
America Airbnb Cancellation Policy Trends Analysis (2025)
Firm
5 listings
100% of total
Cancellation Policy Insights for America
- The prevailing Airbnb cancellation policy trend in America is Firm, used by 100% of listings.
- A majority (100.0%) of hosts in America utilize Firm or Strict policies, indicating a market where hosts prioritize booking security.
Recommendations for Hosts
- Consider adopting a Firm policy to align with the 100% market standard in America.
- Regularly review your cancellation policy against competitors and market demand shifts in America.
America STR Booking Lead Time Analysis (2025)
Average Booking Lead Time by Month
Booking Lead Time Insights for America
- The overall average booking lead time for vacation rentals in America is 42 days.
- Guests book furthest in advance for stays during March (average 54 days), likely coinciding with peak travel demand or local events.
- The shortest booking windows occur for stays in August (average 0 days), indicating more last-minute travel plans during this time.
- Seasonally, Winter (25 days avg.) sees the longest lead times, while Summer (0 days avg.) has the shortest, reflecting typical travel planning cycles.
Recommendations for Hosts
- Use the overall average lead time (42 days) as a baseline for your pricing and availability strategy in America.
- For March stays, consider implementing length-of-stay discounts or slightly higher rates for bookings made less than 54 days out to capitalize on advance planning.
- During August, focus on last-minute booking availability and promotions, as guests book with very short notice (0 days avg.).
- Target marketing efforts for the Winter season well in advance (at least 25 days) to capture early planners.
- Monitor your own booking lead times against these America averages to identify opportunities for dynamic pricing adjustments.
Popular & Essential Airbnb Amenities in America (2025)
Amenity Prevalence
Amenity Insights for America
- Essential amenities in America that guests expect include: TV, Heating, Smoke alarm, Kitchen. Lacking these (any) could significantly impact bookings.
- Popular amenities like Dishwasher, Microwave, Washer are common but not universal. Offering these can provide a competitive edge.
Recommendations for Hosts
- Ensure your listing includes all essential amenities for America: TV, Heating, Smoke alarm, Kitchen.
- Consider adding popular differentiators like Dishwasher or Microwave to increase appeal.
- Highlight unique or less common amenities you offer (e.g., hot tub, dedicated workspace, EV charger) in your listing description and photos.
- Regularly check competitor amenities in America to stay competitive.
America Airbnb Guest Demographics & Profile Analysis (2025)
Guest Profile Summary for America
- The typical guest profile for Airbnb in America consists of a mix of domestic (44%) and international guests, with top international origins including France, typically belonging to the Post-2000s (Gen Z/Alpha) group (50%), primarily speaking English or Dutch.
- Domestic travelers account for 43.8% of guests.
- Key international markets include Netherlands (43.8%) and France (18.8%).
- Top languages spoken are English (41.7%) followed by Dutch (25%).
- A significant demographic segment is the Post-2000s (Gen Z/Alpha) group, representing 50% of guests.
Recommendations for Hosts
- Balance marketing efforts between domestic and international channels based on the guest mix.
- Tailor amenities and listing descriptions to appeal to the dominant Post-2000s (Gen Z/Alpha) demographic (e.g., highlight fast WiFi, smart home features, local guides).
- Highlight unique local experiences or amenities relevant to the primary guest profile.
- Consider seasonal promotions aligned with peak travel times for key origin markets.
Nearby Short-Term Rental Market Comparison
How does the America Airbnb market stack up against its neighbors? Compare key performance metrics like average monthly revenue, ADR, and occupancy rates in surrounding areas to understand the broader regional STR landscape.
| Market | Active Properties | Monthly Revenue | Daily Rate | Avg. Occupancy |
|---|---|---|---|---|
| Kockengen | 12 | $7,560 | $396.31 | 61% |
| Baarlo | 18 | $5,602 | $313.73 | 60% |
| Bentveld | 13 | $4,798 | $443.61 | 54% |
| Dion | 13 | $4,589 | $265.41 | 58% |
| Halfweg | 17 | $4,307 | $231.13 | 55% |
| Aerdenhout | 17 | $4,288 | $694.02 | 53% |
| Incourt | 11 | $4,281 | $293.31 | 43% |
| Merksplas | 10 | $3,885 | $256.59 | 44% |
| Oud Ade | 17 | $3,779 | $277.47 | 51% |
| Rijs | 27 | $3,772 | $356.97 | 45% |