Rheden Airbnb Market Analysis 2025: Short Term Rental Data & Vacation Rental Statistics in Gelderland, Netherlands
Is Airbnb profitable in Rheden in 2025? Explore comprehensive Airbnb analytics for Rheden, Gelderland, Netherlands to uncover income potential. This 2025 STR market report for Rheden, based on AirROI data from April 2024 to March 2025, reveals key trends in the niche market of 20 active listings.
Whether you're considering an Airbnb investment in Rheden, optimizing your existing vacation rental, or exploring rental arbitrage opportunities, understanding the Rheden Airbnb data is crucial. Leveraging the low regulation environment is key to maximizing your short term rental income potential. Let's dive into the specifics.
Key Rheden Airbnb Performance Metrics Overview
Monthly Airbnb Revenue Variations & Income Potential in Rheden (2025)
Understanding the monthly revenue variations for Airbnb listings in Rheden is key to maximizing your short term rental income potential. Seasonality significantly impacts earnings. Our analysis, based on data from the past 12 months, shows that the peak revenue month for STRs in Rheden is typically August, while January often presents the lowest earnings, highlighting opportunities for strategic pricing adjustments during shoulder and low seasons. Explore the typical Airbnb income in Rheden across different performance tiers:
- Best-in-class properties (Top 10%) achieve $3,274+ monthly, often utilizing dynamic pricing and superior guest experiences.
- Strong performing properties (Top 25%) earn $2,488 or more, indicating effective management and desirable locations/amenities.
- Typical properties (Median) generate around $1,695 per month, representing the average market performance.
- Entry-level properties (Bottom 25%) see earnings around $1,040, often with potential for optimization.
Average Monthly Airbnb Earnings Trend in Rheden
Rheden Airbnb Occupancy Rate Trends (2025)
Maximize your bookings by understanding the Rheden STR occupancy trends. Seasonal demand shifts significantly influence how often properties are booked. Typically, Augustsees the highest demand (peak season occupancy), while January experiences the lowest (low season). Effective strategies, like adjusting minimum stays or offering promotions, can boost occupancy during slower periods. Here's how different property tiers perform in Rheden:
- Best-in-class properties (Top 10%) achieve 77%+ occupancy, indicating high desirability and potentially optimized availability.
- Strong performing properties (Top 25%) maintain 58% or higher occupancy, suggesting good market fit and guest satisfaction.
- Typical properties (Median) have an occupancy rate around 45%.
- Entry-level properties (Bottom 25%) average 31% occupancy, potentially facing higher vacancy.
Average Monthly Occupancy Rate Trend in Rheden
Average Daily Rate (ADR) Airbnb Trends in Rheden (2025)
Effective short term rental pricing strategy in Rheden involves understanding monthly ADR fluctuations. The Average Daily Rate (ADR) for Airbnb in Rheden typically peaks in July and dips lowest during March. Leveraging Airbnb dynamic pricing tools or strategies based on this seasonality can significantly boost revenue. Here's a look at the typical nightly rates achieved:
- Best-in-class properties (Top 10%) command rates of $136+ per night, often due to premium features or locations.
- Strong performing properties (Top 25%) achieve nightly rates of $125 or more.
- Typical properties (Median) charge around $116 per night.
- Entry-level properties (Bottom 25%) earn around $98 per night.
Average Daily Rate (ADR) Trend by Month in Rheden
Get Live Rheden Market Intelligence 👇

Explore Real-time Analytics
Airbnb Seasonality Analysis & Trends in Rheden (2025)
Peak Season (August, July, May)
- Revenue averages $2,642 per month
- Occupancy rates average 68.6%
- Daily rates average $117
Shoulder Season
- Revenue averages $1,732 per month
- Occupancy maintains around 43.7%
- Daily rates hold near $113
Low Season (January, November, December)
- Revenue drops to average $1,137 per month
- Occupancy decreases to average 30.3%
- Daily rates adjust to average $114
Seasonality Insights for Rheden
- The Airbnb seasonality in Rheden shows highly seasonal trends requiring careful strategy. While the sections above show seasonal averages, it's also insightful to look at the extremes:
- During the high season, the absolute peak month showcases Rheden's highest earning potential, with monthly revenues capable of climbing to $2,877, occupancy reaching a high of 78.0%, and ADRs peaking at $118.
- Conversely, the slowest single month of the year, typically falling within the low season, marks the market's lowest point. In this month, revenue might dip to $958, occupancy could drop to 25.8%, and ADRs may adjust down to $110.
- Understanding both the seasonal averages and these monthly peaks and troughs in revenue, occupancy, and ADR is crucial for maximizing your Airbnb profit potential in Rheden.
Seasonal Strategies for Maximizing Profit
- Peak Season: Maximize revenue through premium pricing and potentially longer minimum stays. Ensure high availability.
- Low Season: Offer competitive pricing, special promotions (e.g., extended stay discounts), and flexible cancellation policies. Target off-season travelers like remote workers or budget-conscious guests.
- Shoulder Seasons: Implement dynamic pricing that balances peak and low rates. Target weekend travelers or specific events. Offer slightly more flexible terms than peak season.
- Regularly analyze your own performance against these Rheden seasonality benchmarks and adjust your pricing and availability strategy accordingly.
Best Areas for Airbnb Investment in Rheden (2025)
Exploring the top neighborhoods for short-term rentals in Rheden? This section highlights key areas, outlining why they are attractive for hosts and guests, along with notable local attractions. Consider these locations based on your target guest profile and investment strategy.
| Neighborhood / Area | Why Host Here? (Target Guests & Appeal) | Key Attractions & Landmarks |
|---|---|---|
| Rheden Village | Charming village atmosphere with close proximity to the beautiful nature reserves in the Veluwe National Park. Ideal for guests seeking a tranquil retreat with outdoor activities. | Veluwe National Park, Kasteel Middachten, Heuvense Beek, Buitengoed Beneden-Hemel, Rhedense Molen |
| Dieren | A nearby town offering good access to both nature and urban amenities. Great for families and nature lovers looking for a quiet stay with accessibility to surrounding attractions. | Dierense Bossen, Polder de Vloei, Achterhoek, Huis te Rheden, Atelier Dieren |
| De Steeg | Located near the scenic Posbank, this area is favored by hikers and cyclists. Offers breathtaking views and a peaceful environment, making it attractive for outdoor enthusiasts. | Posbank, Nationaal Park Veluwezoom, Museum Bronbeek, Landgoed Beekhuizen, De Steeg Watermill |
| Velp | Suburb of Arnhem with a mix of urban and rural charm. Attractive for visitors wishing to explore both city life and nature. | Kasteel Rosendael, Parklandschap Sonsbeek, Stadstheater Arnhem, Arnhem's Historical Museum, Zypendaal Castle |
| Rozendaal | Known for its picturesque landscapes and historic estates. Ideal for those wanting a luxurious countryside experience. | Castle Rosendael, Nationaal Park Veluwezoom, Rozendaalse Veld, Historical Windmill, Huis te Rozendaal |
| Oosterbeek | Historic village with beautiful parks and close proximity to Arnhem, popular among travelers interested in World War history and nature. | Airborne Museum, Oosterbeek War Cemetery, Hoge Veluwe National Park, Park Sonsbeek, Museum Kröller-Müller |
| Arnhem | The capital of Gelderland, offering rich history, culture, and nightlife. Great for urban travelers and those seeking a vibrant city experience. | Burgers' Zoo, Openluchtmuseum, John Frost Bridge, Eusebius Church, Sonsbeek Park |
| Loo | A small village known for its nature and serene environment, appealing to guests looking for peace and quiet, with lovely walking paths. | Villa De Loo, Natural Reserves, Rivierenwijk, Historic Farms, Scenic Walks |
Understanding Airbnb License Requirements & STR Laws in Rheden (2025)
While Rheden, Gelderland, Netherlands currently shows low STR regulations, specific Airbnb license requirements might still exist or change. Always verify the latest short term rental regulations and Airbnb license requirements directly with local government authorities for Rheden to ensure full compliance before hosting.
(Source: AirROI data, 2025, finding no licensed listings among those analyzed)
Top Performing Airbnb Properties in Rheden (2025)
Benchmark your potential! Explore examples of top-performing Airbnb properties in Rhedenbased on Trailing Twelve Month (TTM) revenue. Analyze their characteristics, revenue, occupancy rate, and ADR to understand what drives success in this market.
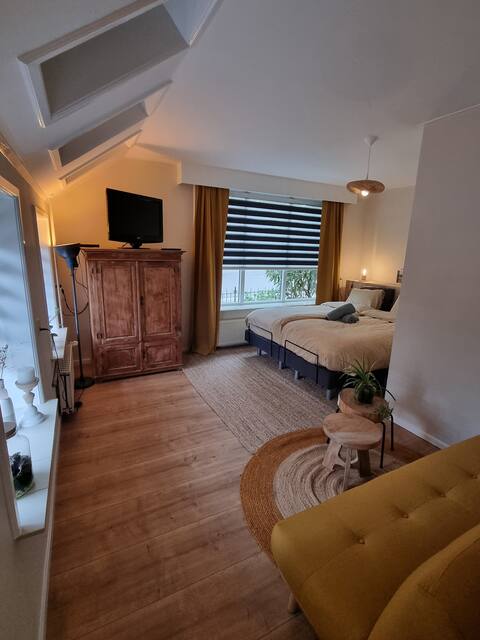
Characteristic stay on the foot of the Veluwe
Entire Place • 1 bedroom

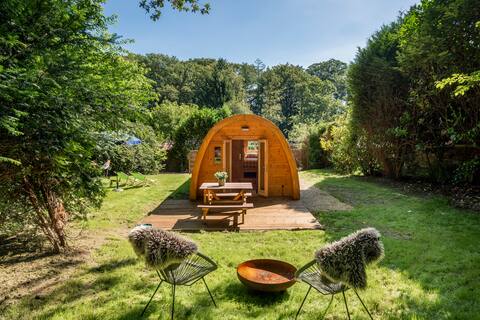
Luxury Lodge! Wild Spot pod with fire bowl!.
Entire Place • 1 bedroom
Only at the World Lodge, private with fire bowl!
Entire Place • 1 bedroom
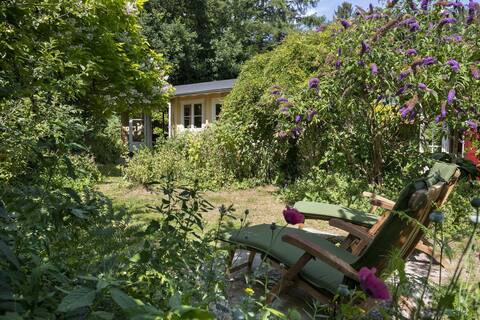
Forest cottage with wood-burning stove and private entrance to forest!
Entire Place • 1 bedroom
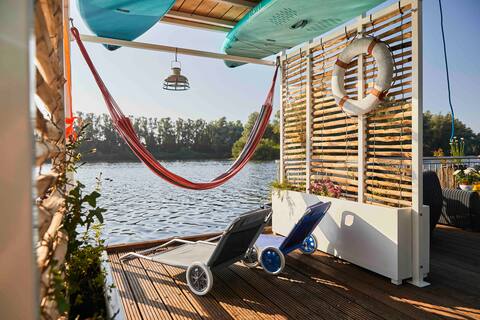
Water villa in a great place
Entire Place • 1 bedroom
Great views, nice place!
Entire Place • 2 bedrooms
Note: Performance varies based on location, size, amenities, seasonality, and management quality. Data reflects the past 12 months.
Top Performing Airbnb Hosts in Rheden (2025)
Learn from the best! This table showcases top-performing Airbnb hosts in Rheden based on the number of properties managed and estimated total revenue over the past year. Analyze their scale and performance metrics.
| Host Name | Properties | Grossing Revenue | Stay Reviews | Avg Rating |
|---|---|---|---|---|
| Arlette | 15 | $284,409 | 561 | 4.83/5.0 |
| Roy / Marloes | 1 | $32,945 | 17 | 4.94/5.0 |
| Iwan | 1 | $25,956 | 42 | 4.93/5.0 |
| Marco | 1 | $13,413 | 152 | 4.47/5.0 |
| Judith | 1 | $11,093 | 102 | 4.51/5.0 |
| Bram | 1 | $9,235 | 30 | 4.90/5.0 |
Analyzing the strategies of top hosts, such as their property selection, pricing, and guest communication, can offer valuable lessons for optimizing your own Airbnb operations in Rheden.
Dive Deeper: Advanced Rheden STR Market Data (2025)
Ready to unlock more insights? AirROI provides access to advanced metrics and comprehensive Airbnb data for Rheden. Explore detailed analytics beyond this report to refine your investment strategy, optimize pricing, and maximize your vacation rental profits.
Explore Advanced MetricsRheden Short-Term Rental Market Composition (2025): Property & Room Types
Room Type Distribution
Property Type Distribution
Market Composition Insights for Rheden
- The Rheden Airbnb market composition is heavily skewed towards Entire Home/Apt listings, which make up 95% of the 20 active rentals. This indicates strong guest preference for privacy and space.
- Looking at the property type distribution in Rheden, House properties are the most common (60%), reflecting the local real estate landscape.
- Houses represent a significant 60% portion, catering likely to families or larger groups.
- The presence of 10% Hotel/Boutique listings indicates integration with traditional hospitality.
Rheden Airbnb Room Capacity Analysis (2025): Bedroom Distribution
Distribution of Listings by Number of Bedrooms
Room Capacity Insights for Rheden
- The dominant room capacity in Rheden is 1 bedroom listings, making up 75% of the market. This suggests a strong demand for properties suitable for couples or solo travelers.
- Together, 1 bedroom and 2 bedrooms properties represent 95.0% of the active Airbnb listings in Rheden, indicating a high concentration in these sizes.
- With over half the market (75%) consisting of studios or 1-bedroom units, Rheden is particularly well-suited for individuals or couples.
Rheden Vacation Rental Guest Capacity Trends (2025)
Distribution of Listings by Guest Capacity
Guest Capacity Insights for Rheden
- The most common guest capacity trend in Rheden vacation rentals is listings accommodating 2 guests (55%). This suggests the primary traveler segment is likely couples or solo travelers.
- Properties designed for 2 guests and 4 guests dominate the Rheden STR market, accounting for 80.0% of listings.
- A significant 55.0% of listings cater specifically to 1-2 guests, highlighting strong demand from couples and solo travelers in Rheden.
- On average, properties in Rheden are equipped to host 2.5 guests.
Rheden Airbnb Booking Patterns (2025): Available vs. Booked Days
Available Days Distribution
Booked Days Distribution
Booking Pattern Insights for Rheden
- The most common availability pattern in Rheden falls within the 181-270 days range, representing 65% of listings. This suggests many properties have significant open periods on their calendars.
- Approximately 75.0% of listings show high availability (181+ days open annually), indicating potential for increased bookings or specific owner usage patterns.
- For booked days, the 91-180 days range is most frequent in Rheden (65%), reflecting common guest stay durations or potential owner blocking patterns.
- A notable 25.0% of properties secure long booking periods (181+ days booked per year), highlighting successful long-term rental strategies or significant owner usage.
Rheden Airbnb Minimum Stay Requirements Analysis
Distribution of Listings by Minimum Night Requirement
1 Night
1 listings
5% of total
2 Nights
14 listings
70% of total
3 Nights
4 listings
20% of total
4-6 Nights
1 listings
5% of total
Key Insights
- The most prevalent minimum stay requirement in Rheden is 2 Nights, adopted by 70% of listings. This highlights the market's preference for shorter, flexible bookings.
- A strong majority (75.0%) of the Rheden Airbnb data shows acceptance of very short stays (1-2 nights), indicating a dynamic, high-turnover market.
Recommendations
- Align with the market by considering a 2 Nights minimum stay, as 70% of Rheden hosts use this setting.
- If feasible, allowing 1-night stays, especially midweek or during low season, could capture last-minute bookings, as only 5% currently do.
- A 2-night minimum appears standard (70%). Consider this for weekends or peak periods.
- Adjust minimum nights based on seasonality – potentially shorter during low season and longer during peak demand periods in Rheden.
Rheden Airbnb Cancellation Policy Trends Analysis (2025)
Moderate
4 listings
20% of total
Firm
5 listings
25% of total
Strict
11 listings
55% of total
Cancellation Policy Insights for Rheden
- The prevailing Airbnb cancellation policy trend in Rheden is Strict, used by 55% of listings.
- A majority (80.0%) of hosts in Rheden utilize Firm or Strict policies, indicating a market where hosts prioritize booking security.
Recommendations for Hosts
- Consider adopting a Strict policy to align with the 55% market standard in Rheden.
- With 55% using Strict terms, this is a viable option in Rheden, particularly for high-value properties or during peak demand periods.
- Regularly review your cancellation policy against competitors and market demand shifts in Rheden.
Rheden STR Booking Lead Time Analysis (2025)
Average Booking Lead Time by Month
Booking Lead Time Insights for Rheden
- The overall average booking lead time for vacation rentals in Rheden is 41 days.
- Guests book furthest in advance for stays during June (average 76 days), likely coinciding with peak travel demand or local events.
- The shortest booking windows occur for stays in March (average 27 days), indicating more last-minute travel plans during this time.
- Seasonally, Summer (64 days avg.) sees the longest lead times, while Winter (36 days avg.) has the shortest, reflecting typical travel planning cycles.
Recommendations for Hosts
- Use the overall average lead time (41 days) as a baseline for your pricing and availability strategy in Rheden.
- For June stays, consider implementing length-of-stay discounts or slightly higher rates for bookings made less than 76 days out to capitalize on advance planning.
- Target marketing efforts for the Summer season well in advance (at least 64 days) to capture early planners.
- Monitor your own booking lead times against these Rheden averages to identify opportunities for dynamic pricing adjustments.
Popular & Essential Airbnb Amenities in Rheden (2025)
Amenity Prevalence
Amenity Insights for Rheden
- Essential amenities in Rheden that guests expect include: Wifi, Smoke alarm, Essentials, Heating, Bed linens, Kitchen. Lacking these (any) could significantly impact bookings.
- Popular amenities like Coffee maker, Refrigerator, Cooking basics are common but not universal. Offering these can provide a competitive edge.
Recommendations for Hosts
- Ensure your listing includes all essential amenities for Rheden: Wifi, Smoke alarm, Essentials, Heating, Bed linens, Kitchen.
- Prioritize adding missing essentials: Essentials, Heating, Bed linens, Kitchen.
- Consider adding popular differentiators like Coffee maker or Refrigerator to increase appeal.
- Highlight unique or less common amenities you offer (e.g., hot tub, dedicated workspace, EV charger) in your listing description and photos.
- Regularly check competitor amenities in Rheden to stay competitive.
Rheden Airbnb Guest Demographics & Profile Analysis (2025)
Guest Profile Summary for Rheden
- The typical guest profile for Airbnb in Rheden consists of a mix of domestic (57%) and international guests, often arriving from nearby Amsterdam, typically belonging to the Post-2000s (Gen Z/Alpha) group (50%), primarily speaking English or Dutch.
- Domestic travelers account for 56.9% of guests.
- Key international markets include Netherlands (56.9%) and Germany (20.4%).
- Top languages spoken are English (40%) followed by Dutch (19.6%).
- A significant demographic segment is the Post-2000s (Gen Z/Alpha) group, representing 50% of guests.
Recommendations for Hosts
- Balance marketing efforts between domestic and international channels based on the guest mix.
- Tailor amenities and listing descriptions to appeal to the dominant Post-2000s (Gen Z/Alpha) demographic (e.g., highlight fast WiFi, smart home features, local guides).
- Highlight unique local experiences or amenities relevant to the primary guest profile.
- Consider seasonal promotions aligned with peak travel times for key origin markets.
Nearby Short-Term Rental Market Comparison
How does the Rheden Airbnb market stack up against its neighbors? Compare key performance metrics like average monthly revenue, ADR, and occupancy rates in surrounding areas to understand the broader regional STR landscape.
| Market | Active Properties | Monthly Revenue | Daily Rate | Avg. Occupancy |
|---|---|---|---|---|
| Baarlo | 18 | $5,602 | $313.73 | 60% |
| Rijs | 27 | $3,772 | $356.97 | 45% |
| Kerkdriel | 25 | $3,607 | $323.16 | 40% |
| Kortenhoef | 15 | $3,495 | $255.48 | 53% |
| Heusden-Zolder | 14 | $3,392 | $290.06 | 44% |
| Muiden | 29 | $3,226 | $291.72 | 48% |
| Haaren | 11 | $3,125 | $266.89 | 49% |
| Vierhouten | 15 | $3,026 | $196.88 | 52% |
| Bant | 10 | $2,983 | $538.44 | 25% |
| Uitdam | 34 | $2,907 | $425.90 | 30% |