Nijkerk Airbnb Market Analysis 2025: Short Term Rental Data & Vacation Rental Statistics in Gelderland, Netherlands
Is Airbnb profitable in Nijkerk in 2025? Explore comprehensive Airbnb analytics for Nijkerk, Gelderland, Netherlands to uncover income potential. This 2025 STR market report for Nijkerk, based on AirROI data from April 2024 to March 2025, reveals key trends in the niche market of 50 active listings.
Whether you're considering an Airbnb investment in Nijkerk, optimizing your existing vacation rental, or exploring rental arbitrage opportunities, understanding the Nijkerk Airbnb data is crucial. Leveraging the low regulation environment is key to maximizing your short term rental income potential. Let's dive into the specifics.
Key Nijkerk Airbnb Performance Metrics Overview
Monthly Airbnb Revenue Variations & Income Potential in Nijkerk (2025)
Understanding the monthly revenue variations for Airbnb listings in Nijkerk is key to maximizing your short term rental income potential. Seasonality significantly impacts earnings. Our analysis, based on data from the past 12 months, shows that the peak revenue month for STRs in Nijkerk is typically April, while February often presents the lowest earnings, highlighting opportunities for strategic pricing adjustments during shoulder and low seasons. Explore the typical Airbnb income in Nijkerk across different performance tiers:
- Best-in-class properties (Top 10%) achieve $5,151+ monthly, often utilizing dynamic pricing and superior guest experiences.
- Strong performing properties (Top 25%) earn $3,710 or more, indicating effective management and desirable locations/amenities.
- Typical properties (Median) generate around $2,086 per month, representing the average market performance.
- Entry-level properties (Bottom 25%) see earnings around $1,087, often with potential for optimization.
Average Monthly Airbnb Earnings Trend in Nijkerk
Nijkerk Airbnb Occupancy Rate Trends (2025)
Maximize your bookings by understanding the Nijkerk STR occupancy trends. Seasonal demand shifts significantly influence how often properties are booked. Typically, Aprilsees the highest demand (peak season occupancy), while January experiences the lowest (low season). Effective strategies, like adjusting minimum stays or offering promotions, can boost occupancy during slower periods. Here's how different property tiers perform in Nijkerk:
- Best-in-class properties (Top 10%) achieve 81%+ occupancy, indicating high desirability and potentially optimized availability.
- Strong performing properties (Top 25%) maintain 57% or higher occupancy, suggesting good market fit and guest satisfaction.
- Typical properties (Median) have an occupancy rate around 33%.
- Entry-level properties (Bottom 25%) average 20% occupancy, potentially facing higher vacancy.
Average Monthly Occupancy Rate Trend in Nijkerk
Average Daily Rate (ADR) Airbnb Trends in Nijkerk (2025)
Effective short term rental pricing strategy in Nijkerk involves understanding monthly ADR fluctuations. The Average Daily Rate (ADR) for Airbnb in Nijkerk typically peaks in August and dips lowest during November. Leveraging Airbnb dynamic pricing tools or strategies based on this seasonality can significantly boost revenue. Here's a look at the typical nightly rates achieved:
- Best-in-class properties (Top 10%) command rates of $320+ per night, often due to premium features or locations.
- Strong performing properties (Top 25%) achieve nightly rates of $239 or more.
- Typical properties (Median) charge around $169 per night.
- Entry-level properties (Bottom 25%) earn around $97 per night.
Average Daily Rate (ADR) Trend by Month in Nijkerk
Get Live Nijkerk Market Intelligence 👇

Explore Real-time Analytics
Airbnb Seasonality Analysis & Trends in Nijkerk (2025)
Peak Season (April, June, May)
- Revenue averages $4,563 per month
- Occupancy rates average 61.0%
- Daily rates average $185
Shoulder Season
- Revenue averages $2,171 per month
- Occupancy maintains around 36.7%
- Daily rates hold near $180
Low Season (January, February, March)
- Revenue drops to average $1,186 per month
- Occupancy decreases to average 31.1%
- Daily rates adjust to average $173
Seasonality Insights for Nijkerk
- The Airbnb seasonality in Nijkerk shows highly seasonal trends requiring careful strategy. While the sections above show seasonal averages, it's also insightful to look at the extremes:
- During the high season, the absolute peak month showcases Nijkerk's highest earning potential, with monthly revenues capable of climbing to $4,760, occupancy reaching a high of 63.7%, and ADRs peaking at $191.
- Conversely, the slowest single month of the year, typically falling within the low season, marks the market's lowest point. In this month, revenue might dip to $1,073, occupancy could drop to 20.0%, and ADRs may adjust down to $165.
- Understanding both the seasonal averages and these monthly peaks and troughs in revenue, occupancy, and ADR is crucial for maximizing your Airbnb profit potential in Nijkerk.
Seasonal Strategies for Maximizing Profit
- Peak Season: Maximize revenue through premium pricing and potentially longer minimum stays. Ensure high availability.
- Low Season: Offer competitive pricing, special promotions (e.g., extended stay discounts), and flexible cancellation policies. Target off-season travelers like remote workers or budget-conscious guests.
- Shoulder Seasons: Implement dynamic pricing that balances peak and low rates. Target weekend travelers or specific events. Offer slightly more flexible terms than peak season.
- Regularly analyze your own performance against these Nijkerk seasonality benchmarks and adjust your pricing and availability strategy accordingly.
Best Areas for Airbnb Investment in Nijkerk (2025)
Exploring the top neighborhoods for short-term rentals in Nijkerk? This section highlights key areas, outlining why they are attractive for hosts and guests, along with notable local attractions. Consider these locations based on your target guest profile and investment strategy.
| Neighborhood / Area | Why Host Here? (Target Guests & Appeal) | Key Attractions & Landmarks |
|---|---|---|
| City Center Nijkerk | The bustling heart of Nijkerk with access to shops, restaurants, and public transport. It attracts tourists looking to explore the local culture and enjoy convenient amenities. | Nijkerk Historical Museum, De Ark Church, Local markets, Restaurants and cafes, Shopping streets |
| Nijkerk's Countryside | A serene area offering a rural experience with beautiful landscapes. Perfect for guests seeking tranquility and outdoor activities such as hiking and cycling. | Veluwe National Park, Cycle paths, Scenic farms, Nature reserves |
| Lake Nijkerk | A popular recreational area with opportunities for water sports and leisure activities. Ideal for families and holidaymakers during the summer months. | Beach at Nijkerk, Water sports, Picnic areas, Fishing opportunities, Walking paths |
| Nearby Amersfoort | This nearby city is known for its historic architecture and vibrant arts scene. Visitors can enjoy day trips to Amersfoort while staying in Nijkerk. | Amersfoort Zoo, Koppelpoort, Museum Flehite, Onze Lieve Vrouwe Tower, Shopping area |
| Nijkerk's Parks | Numerous parks in and around Nijkerk that provide a pleasant environment for relaxation and outdoor activities, attracting families and outdoor enthusiasts. | Wilhelminapark, Nijkerkse Berg, Playgrounds, Walking and cycling paths |
| Cultural Venues | Nijkerk hosts various cultural events and venues that appeal to arts and culture lovers. Great for guests interested in local culture and events. | Theater Nijkerk, Cultural festivals, Art exhibitions, Local performances |
| Train Station Area | Convenient access to transportation for travelers who want to explore the surrounding regions. Ideal for business travelers and transit visitors. | Access to local trains, Nearby coffee shops, Public transport links |
| Community Events | Nijkerk has a lively community spirit with events throughout the year, attracting visitors looking for a local experience with festivals and gatherings. | Annual festivals, Markets, Seasonal events, Local food |
Understanding Airbnb License Requirements & STR Laws in Nijkerk (2025)
While Nijkerk, Gelderland, Netherlands currently shows low STR regulations, specific Airbnb license requirements might still exist or change. Always verify the latest short term rental regulations and Airbnb license requirements directly with local government authorities for Nijkerk to ensure full compliance before hosting.
(Source: AirROI data, 2025, finding no licensed listings among those analyzed)
Top Performing Airbnb Properties in Nijkerk (2025)
Benchmark your potential! Explore examples of top-performing Airbnb properties in Nijkerkbased on Trailing Twelve Month (TTM) revenue. Analyze their characteristics, revenue, occupancy rate, and ADR to understand what drives success in this market.

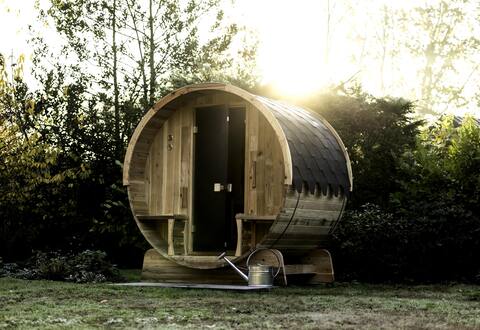
Bakhuis @ Ahof.farm
Entire Place • 2 bedrooms
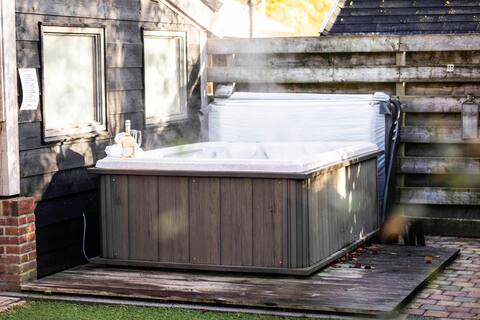
Holiday house with Jacuzzi and sauna on the Veluwe
Entire Place • 2 bedrooms
Nice chalet with dishwasher, near Veluwemeer
Entire Place • 3 bedrooms
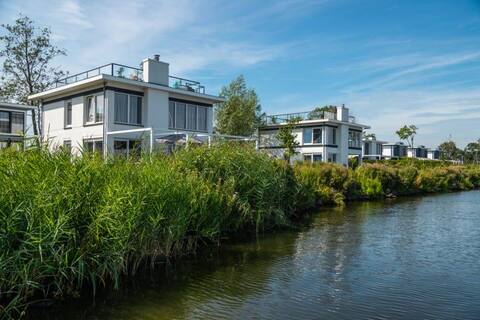
Villa Meerzicht 8
Entire Place • 4 bedrooms

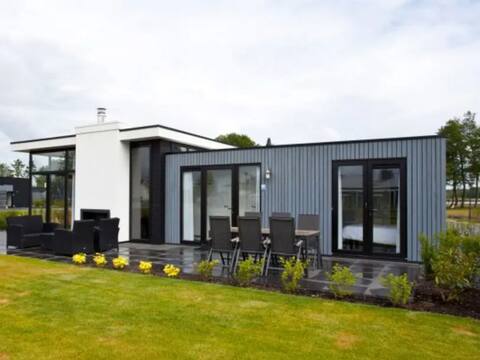
Cube Magnifique Plus 8
Entire Place • 4 bedrooms
Holiday home #TinyHouse #Jacuzzi#Sauna on the Veluwe
Entire Place • 2 bedrooms
Note: Performance varies based on location, size, amenities, seasonality, and management quality. Data reflects the past 12 months.
Top Performing Airbnb Hosts in Nijkerk (2025)
Learn from the best! This table showcases top-performing Airbnb hosts in Nijkerk based on the number of properties managed and estimated total revenue over the past year. Analyze their scale and performance metrics.
| Host Name | Properties | Grossing Revenue | Stay Reviews | Avg Rating |
|---|---|---|---|---|
| Host #387867368 | 21 | $486,283 | 70 | 2.48/5.0 |
| Host #124661153 | 5 | $160,135 | 20 | 2.63/5.0 |
| Jantine | 2 | $98,558 | 233 | 4.83/5.0 |
| Julia | 1 | $63,542 | 21 | 4.90/5.0 |
| Trudy En Kees | 2 | $32,000 | 94 | 4.79/5.0 |
| Lenie | 1 | $26,923 | 71 | 4.93/5.0 |
| Riet | 1 | $25,229 | 64 | 4.98/5.0 |
| Carmen | 1 | $24,944 | 11 | 4.91/5.0 |
| Cynthia | 1 | $21,508 | 16 | 4.44/5.0 |
| Jan En Marina | 1 | $21,101 | 116 | 4.93/5.0 |
Analyzing the strategies of top hosts, such as their property selection, pricing, and guest communication, can offer valuable lessons for optimizing your own Airbnb operations in Nijkerk.
Dive Deeper: Advanced Nijkerk STR Market Data (2025)
Ready to unlock more insights? AirROI provides access to advanced metrics and comprehensive Airbnb data for Nijkerk. Explore detailed analytics beyond this report to refine your investment strategy, optimize pricing, and maximize your vacation rental profits.
Explore Advanced MetricsNijkerk Short-Term Rental Market Composition (2025): Property & Room Types
Room Type Distribution
Property Type Distribution
Market Composition Insights for Nijkerk
- The Nijkerk Airbnb market composition is heavily skewed towards Entire Home/Apt listings, which make up 86% of the 50 active rentals. This indicates strong guest preference for privacy and space.
- Looking at the property type distribution in Nijkerk, House properties are the most common (88%), reflecting the local real estate landscape.
- Houses represent a significant 88% portion, catering likely to families or larger groups.
- The presence of 6% Hotel/Boutique listings indicates integration with traditional hospitality.
- Smaller segments like outdoor/unique, apartment/condo, others (combined 6.0%) offer potential for unique stay experiences.
Nijkerk Airbnb Room Capacity Analysis (2025): Bedroom Distribution
Distribution of Listings by Number of Bedrooms
Room Capacity Insights for Nijkerk
- The dominant room capacity in Nijkerk is 2 bedrooms listings, making up 42% of the market. This suggests a strong demand for properties suitable for couples or solo travelers.
- Together, 2 bedrooms and 3 bedrooms properties represent 64.0% of the active Airbnb listings in Nijkerk, indicating a high concentration in these sizes.
- A significant 34.0% of listings offer 3+ bedrooms, catering to larger groups and families seeking more space in Nijkerk.
Nijkerk Vacation Rental Guest Capacity Trends (2025)
Distribution of Listings by Guest Capacity
Guest Capacity Insights for Nijkerk
- The most common guest capacity trend in Nijkerk vacation rentals is listings accommodating 4 guests (42%). This suggests the primary traveler segment is likely small families or groups.
- Properties designed for 4 guests and 6 guests dominate the Nijkerk STR market, accounting for 64.0% of listings.
- 32.0% of properties accommodate 6+ guests, serving the market segment for larger families or group travel in Nijkerk.
- On average, properties in Nijkerk are equipped to host 4.2 guests.
Nijkerk Airbnb Booking Patterns (2025): Available vs. Booked Days
Available Days Distribution
Booked Days Distribution
Booking Pattern Insights for Nijkerk
- The most common availability pattern in Nijkerk falls within the 271-366 days range, representing 42% of listings. This suggests many properties have significant open periods on their calendars.
- Approximately 82.0% of listings show high availability (181+ days open annually), indicating potential for increased bookings or specific owner usage patterns.
- For booked days, the 91-180 days range is most frequent in Nijkerk (42%), reflecting common guest stay durations or potential owner blocking patterns.
- A notable 18.0% of properties secure long booking periods (181+ days booked per year), highlighting successful long-term rental strategies or significant owner usage.
Nijkerk Airbnb Minimum Stay Requirements Analysis
Distribution of Listings by Minimum Night Requirement
1 Night
3 listings
12.5% of total
2 Nights
9 listings
37.5% of total
3 Nights
2 listings
8.3% of total
4-6 Nights
2 listings
8.3% of total
7-29 Nights
3 listings
12.5% of total
30+ Nights
5 listings
20.8% of total
Key Insights
- The most prevalent minimum stay requirement in Nijkerk is 2 Nights, adopted by 37.5% of listings. This highlights the market's preference for shorter, flexible bookings.
- A significant segment (20.8%) caters to monthly stays (30+ nights) in Nijkerk, pointing to opportunities in the extended-stay market.
Recommendations
- Align with the market by considering a 2 Nights minimum stay, as 37.5% of Nijkerk hosts use this setting.
- If feasible, allowing 1-night stays, especially midweek or during low season, could capture last-minute bookings, as only 12.5% currently do.
- A 2-night minimum appears standard (37.5%). Consider this for weekends or peak periods.
- Explore offering discounts for stays of 30+ nights to attract the 20.8% of the market seeking extended stays.
- Adjust minimum nights based on seasonality – potentially shorter during low season and longer during peak demand periods in Nijkerk.
Nijkerk Airbnb Cancellation Policy Trends Analysis (2025)
Flexible
6 listings
33.3% of total
Moderate
4 listings
22.2% of total
Firm
6 listings
33.3% of total
Strict
2 listings
11.1% of total
Cancellation Policy Insights for Nijkerk
- The prevailing Airbnb cancellation policy trend in Nijkerk is Flexible, used by 33.3% of listings.
- There's a relatively balanced mix between guest-friendly (55.5%) and stricter (44.4%) policies, offering choices for different guest needs.
Recommendations for Hosts
- Consider adopting a Flexible policy to align with the 33.3% market standard in Nijkerk.
- Using a Strict policy might deter some guests, as only 11.1% of listings use it. Evaluate if potential revenue protection outweighs possible lower booking rates.
- Regularly review your cancellation policy against competitors and market demand shifts in Nijkerk.
Nijkerk STR Booking Lead Time Analysis (2025)
Average Booking Lead Time by Month
Booking Lead Time Insights for Nijkerk
- The overall average booking lead time for vacation rentals in Nijkerk is 60 days.
- Guests book furthest in advance for stays during January (average 106 days), likely coinciding with peak travel demand or local events.
- The shortest booking windows occur for stays in February (average 29 days), indicating more last-minute travel plans during this time.
- Seasonally, Winter (74 days avg.) sees the longest lead times, while Spring (51 days avg.) has the shortest, reflecting typical travel planning cycles.
Recommendations for Hosts
- Use the overall average lead time (60 days) as a baseline for your pricing and availability strategy in Nijkerk.
- For January stays, consider implementing length-of-stay discounts or slightly higher rates for bookings made less than 106 days out to capitalize on advance planning.
- Target marketing efforts for the Winter season well in advance (at least 74 days) to capture early planners.
- Monitor your own booking lead times against these Nijkerk averages to identify opportunities for dynamic pricing adjustments.
Popular & Essential Airbnb Amenities in Nijkerk (2025)
Amenity Prevalence
Amenity Insights for Nijkerk
- Essential amenities in Nijkerk that guests expect include: Smoke alarm, Wifi, Heating, Hot water. Lacking these (any) could significantly impact bookings.
- Popular amenities like Essentials, Coffee maker, Kitchen are common but not universal. Offering these can provide a competitive edge.
Recommendations for Hosts
- Ensure your listing includes all essential amenities for Nijkerk: Smoke alarm, Wifi, Heating, Hot water.
- Prioritize adding missing essentials: Heating, Hot water.
- Consider adding popular differentiators like Essentials or Coffee maker to increase appeal.
- Highlight unique or less common amenities you offer (e.g., hot tub, dedicated workspace, EV charger) in your listing description and photos.
- Regularly check competitor amenities in Nijkerk to stay competitive.
Nijkerk Airbnb Guest Demographics & Profile Analysis (2025)
Guest Profile Summary for Nijkerk
- The typical guest profile for Airbnb in Nijkerk consists of predominantly international visitors (69%), with top international origins including Germany, typically belonging to the Post-2000s (Gen Z/Alpha) group (50%), primarily speaking English or German.
- Domestic travelers account for 30.9% of guests.
- Key international markets include Netherlands (30.9%) and Germany (30.4%).
- Top languages spoken are English (39.8%) followed by German (22.1%).
- A significant demographic segment is the Post-2000s (Gen Z/Alpha) group, representing 50% of guests.
Recommendations for Hosts
- Focus marketing internationally, particularly towards travelers from Germany.
- Tailor amenities and listing descriptions to appeal to the dominant Post-2000s (Gen Z/Alpha) demographic (e.g., highlight fast WiFi, smart home features, local guides).
- Highlight unique local experiences or amenities relevant to the primary guest profile.
- Consider seasonal promotions aligned with peak travel times for key origin markets.
Nearby Short-Term Rental Market Comparison
How does the Nijkerk Airbnb market stack up against its neighbors? Compare key performance metrics like average monthly revenue, ADR, and occupancy rates in surrounding areas to understand the broader regional STR landscape.
| Market | Active Properties | Monthly Revenue | Daily Rate | Avg. Occupancy |
|---|---|---|---|---|
| Kockengen | 12 | $7,560 | $396.31 | 61% |
| Baarlo | 18 | $5,602 | $313.73 | 60% |
| Bentveld | 13 | $4,798 | $443.61 | 54% |
| Halfweg | 17 | $4,307 | $231.13 | 55% |
| Aerdenhout | 17 | $4,288 | $694.02 | 53% |
| Merksplas | 10 | $3,885 | $256.59 | 44% |
| Oud Ade | 17 | $3,779 | $277.47 | 51% |
| Rijs | 27 | $3,772 | $356.97 | 45% |
| Zwanenburg | 24 | $3,720 | $240.77 | 66% |
| Kerkdriel | 25 | $3,607 | $323.16 | 40% |