Ede Airbnb Market Analysis 2025: Short Term Rental Data & Vacation Rental Statistics in Gelderland, Netherlands
Is Airbnb profitable in Ede in 2025? Explore comprehensive Airbnb analytics for Ede, Gelderland, Netherlands to uncover income potential. This 2025 STR market report for Ede, based on AirROI data from April 2024 to March 2025, reveals key trends in the niche market of 36 active listings.
Whether you're considering an Airbnb investment in Ede, optimizing your existing vacation rental, or exploring rental arbitrage opportunities, understanding the Ede Airbnb data is crucial. Leveraging the low regulation environment is key to maximizing your short term rental income potential. Let's dive into the specifics.
Key Ede Airbnb Performance Metrics Overview
Monthly Airbnb Revenue Variations & Income Potential in Ede (2025)
Understanding the monthly revenue variations for Airbnb listings in Ede is key to maximizing your short term rental income potential. Seasonality significantly impacts earnings. Our analysis, based on data from the past 12 months, shows that the peak revenue month for STRs in Ede is typically May, while March often presents the lowest earnings, highlighting opportunities for strategic pricing adjustments during shoulder and low seasons. Explore the typical Airbnb income in Ede across different performance tiers:
- Best-in-class properties (Top 10%) achieve $4,268+ monthly, often utilizing dynamic pricing and superior guest experiences.
- Strong performing properties (Top 25%) earn $3,386 or more, indicating effective management and desirable locations/amenities.
- Typical properties (Median) generate around $2,139 per month, representing the average market performance.
- Entry-level properties (Bottom 25%) see earnings around $1,157, often with potential for optimization.
Average Monthly Airbnb Earnings Trend in Ede
Ede Airbnb Occupancy Rate Trends (2025)
Maximize your bookings by understanding the Ede STR occupancy trends. Seasonal demand shifts significantly influence how often properties are booked. Typically, Julysees the highest demand (peak season occupancy), while June experiences the lowest (low season). Effective strategies, like adjusting minimum stays or offering promotions, can boost occupancy during slower periods. Here's how different property tiers perform in Ede:
- Best-in-class properties (Top 10%) achieve 84%+ occupancy, indicating high desirability and potentially optimized availability.
- Strong performing properties (Top 25%) maintain 73% or higher occupancy, suggesting good market fit and guest satisfaction.
- Typical properties (Median) have an occupancy rate around 51%.
- Entry-level properties (Bottom 25%) average 31% occupancy, potentially facing higher vacancy.
Average Monthly Occupancy Rate Trend in Ede
Average Daily Rate (ADR) Airbnb Trends in Ede (2025)
Effective short term rental pricing strategy in Ede involves understanding monthly ADR fluctuations. The Average Daily Rate (ADR) for Airbnb in Ede typically peaks in July and dips lowest during February. Leveraging Airbnb dynamic pricing tools or strategies based on this seasonality can significantly boost revenue. Here's a look at the typical nightly rates achieved:
- Best-in-class properties (Top 10%) command rates of $203+ per night, often due to premium features or locations.
- Strong performing properties (Top 25%) achieve nightly rates of $161 or more.
- Typical properties (Median) charge around $126 per night.
- Entry-level properties (Bottom 25%) earn around $83 per night.
Average Daily Rate (ADR) Trend by Month in Ede
Get Live Ede Market Intelligence 👇

Explore Real-time Analytics
Airbnb Seasonality Analysis & Trends in Ede (2025)
Peak Season (May, July, April)
- Revenue averages $2,950 per month
- Occupancy rates average 55.1%
- Daily rates average $144
Shoulder Season
- Revenue averages $2,388 per month
- Occupancy maintains around 53.1%
- Daily rates hold near $138
Low Season (February, March, October)
- Revenue drops to average $1,840 per month
- Occupancy decreases to average 46.4%
- Daily rates adjust to average $134
Seasonality Insights for Ede
- The Airbnb seasonality in Ede shows moderate seasonality with distinct peak and low periods. While the sections above show seasonal averages, it's also insightful to look at the extremes:
- During the high season, the absolute peak month showcases Ede's highest earning potential, with monthly revenues capable of climbing to $3,091, occupancy reaching a high of 67.4%, and ADRs peaking at $145.
- Conversely, the slowest single month of the year, typically falling within the low season, marks the market's lowest point. In this month, revenue might dip to $1,655, occupancy could drop to 42.2%, and ADRs may adjust down to $129.
- Understanding both the seasonal averages and these monthly peaks and troughs in revenue, occupancy, and ADR is crucial for maximizing your Airbnb profit potential in Ede.
Seasonal Strategies for Maximizing Profit
- Peak Season: Maximize revenue through premium pricing and potentially longer minimum stays. Ensure high availability.
- Low Season: Offer competitive pricing, special promotions (e.g., extended stay discounts), and flexible cancellation policies. Target off-season travelers like remote workers or budget-conscious guests.
- Shoulder Seasons: Implement dynamic pricing that balances peak and low rates. Target weekend travelers or specific events. Offer slightly more flexible terms than peak season.
- Regularly analyze your own performance against these Ede seasonality benchmarks and adjust your pricing and availability strategy accordingly.
Best Areas for Airbnb Investment in Ede (2025)
Exploring the top neighborhoods for short-term rentals in Ede? This section highlights key areas, outlining why they are attractive for hosts and guests, along with notable local attractions. Consider these locations based on your target guest profile and investment strategy.
| Neighborhood / Area | Why Host Here? (Target Guests & Appeal) | Key Attractions & Landmarks |
|---|---|---|
| City Center | The heart of Ede, with easy access to shops, restaurants, and public transport. A vibrant area popular with tourists and locals. | Bekerstroom Park, Cinemec Ede, De Reehorst, Ede Shopping Center, Cultural Center Ede |
| Ede-Wageningen | A picturesque area close to both Ede and Wageningen, known for its scenic natural beauty and outdoor activities. Ideal for guests looking for nature experiences. | National Park Utrechtse Heuvelrug, Grebbeberg, Wageningen University, Huis te Rhenen, Museum Wereld van de Waterionen |
| Bovenbuurt | A residential neighborhood with a more local feel, preferred by families and longer-term stays. Close to schools and parks, making it ideal for families visiting Ede. | Stadsgracht, Ede Sports Park, 2scout Local Park |
| Eastern Ede | An area that offers a quiet atmosphere yet still provides access to local amenities and transport, perfect for those wanting a peaceful escape while being close to attractions. | Ede Forest, Veldhuizen Park, Oude Kerk |
| De Valouwe | A charming area with historical significance and a welcoming community. Great for those interested in local culture and history. | De Valouwe Church, Local Heritage Sites, Walking Tours |
| Ede Railway Station | A convenient location for travelers, being close to the railway station. This area attracts those who wish to explore nearby cities as well. | Ede Railway Museum, Transport Links, Shopping Options |
| Oosterbeek | A beautiful residential area close to Ede, known for its parks and river views. Ideal for nature lovers and those wanting a peaceful retreat. | Oosterbeek War Cemetery, The Rhine, Local Nature Trails |
| Ede North | This area offers larger properties with ample gardens and outdoor space, suitable for groups and families. Quiet and suburban. | Local Parks, Playgrounds, Community Centers |
Understanding Airbnb License Requirements & STR Laws in Ede (2025)
While Ede, Gelderland, Netherlands currently shows low STR regulations, specific Airbnb license requirements might still exist or change. Always verify the latest short term rental regulations and Airbnb license requirements directly with local government authorities for Ede to ensure full compliance before hosting.
(Source: AirROI data, 2025, finding no licensed listings among those analyzed)
Top Performing Airbnb Properties in Ede (2025)
Benchmark your potential! Explore examples of top-performing Airbnb properties in Edebased on Trailing Twelve Month (TTM) revenue. Analyze their characteristics, revenue, occupancy rate, and ADR to understand what drives success in this market.
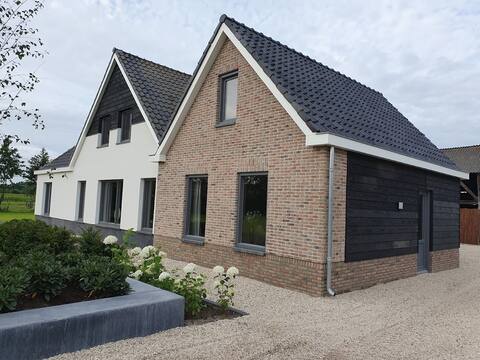
Complete new holiday home "Villa de Berken"
Entire Place • 6 bedrooms
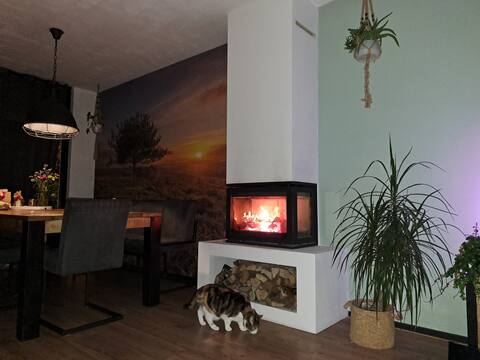
Corner house with private garden and sauna by the woods!
Entire Place • 1 bedroom
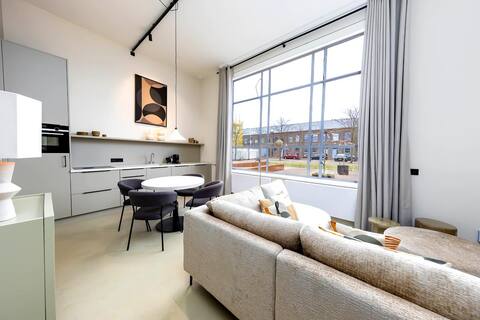
ENKA Studio 129 (2+2)
Entire Place • 1 bedroom

Spacious luxury 3 bedroom Holiday Villa - Veluwe
Entire Place • 3 bedrooms

ENKA Studio 127
Entire Place • 1 bedroom
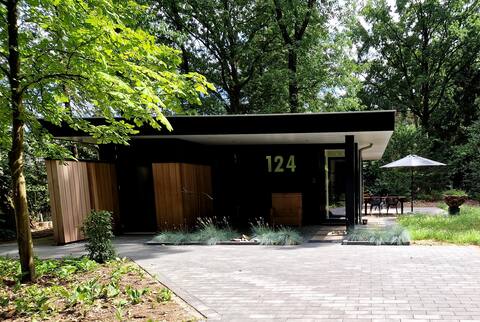
New cottage in the forest in Ede. #Oak Neeltjes.
Entire Place • 2 bedrooms
Note: Performance varies based on location, size, amenities, seasonality, and management quality. Data reflects the past 12 months.
Top Performing Airbnb Hosts in Ede (2025)
Learn from the best! This table showcases top-performing Airbnb hosts in Ede based on the number of properties managed and estimated total revenue over the past year. Analyze their scale and performance metrics.
| Host Name | Properties | Grossing Revenue | Stay Reviews | Avg Rating |
|---|---|---|---|---|
| StayIn | 8 | $277,669 | 296 | 4.85/5.0 |
| Jolanda | 1 | $76,060 | 87 | 4.86/5.0 |
| Wil | 4 | $64,543 | 119 | 4.95/5.0 |
| Christian | 2 | $50,011 | 120 | 4.55/5.0 |
| Lucinda | 1 | $45,420 | 26 | 4.92/5.0 |
| Jackie | 1 | $42,918 | 17 | 4.65/5.0 |
| Erica En Mark | 1 | $37,743 | 139 | 4.99/5.0 |
| Ine | 1 | $35,820 | 3 | 5.00/5.0 |
| Host #417130378 | 1 | $31,623 | 0 | 0.00/5.0 |
| Peter | 1 | $27,686 | 109 | 4.80/5.0 |
Analyzing the strategies of top hosts, such as their property selection, pricing, and guest communication, can offer valuable lessons for optimizing your own Airbnb operations in Ede.
Dive Deeper: Advanced Ede STR Market Data (2025)
Ready to unlock more insights? AirROI provides access to advanced metrics and comprehensive Airbnb data for Ede. Explore detailed analytics beyond this report to refine your investment strategy, optimize pricing, and maximize your vacation rental profits.
Explore Advanced MetricsEde Short-Term Rental Market Composition (2025): Property & Room Types
Room Type Distribution
Property Type Distribution
Market Composition Insights for Ede
- The Ede Airbnb market composition is heavily skewed towards Entire Home/Apt listings, which make up 83.3% of the 36 active rentals. This indicates strong guest preference for privacy and space.
- Looking at the property type distribution in Ede, House properties are the most common (63.9%), reflecting the local real estate landscape.
- Houses represent a significant 63.9% portion, catering likely to families or larger groups.
- Smaller segments like hotel/boutique (combined 2.8%) offer potential for unique stay experiences.
Ede Airbnb Room Capacity Analysis (2025): Bedroom Distribution
Distribution of Listings by Number of Bedrooms
Room Capacity Insights for Ede
- The dominant room capacity in Ede is 1 bedroom listings, making up 47.2% of the market. This suggests a strong demand for properties suitable for couples or solo travelers.
- Together, 1 bedroom and 2 bedrooms properties represent 61.1% of the active Airbnb listings in Ede, indicating a high concentration in these sizes.
Ede Vacation Rental Guest Capacity Trends (2025)
Distribution of Listings by Guest Capacity
Guest Capacity Insights for Ede
- The most common guest capacity trend in Ede vacation rentals is listings accommodating 2 guests (38.9%). This suggests the primary traveler segment is likely couples or solo travelers.
- Properties designed for 2 guests and 4 guests dominate the Ede STR market, accounting for 55.6% of listings.
- 19.5% of properties accommodate 6+ guests, serving the market segment for larger families or group travel in Ede.
- On average, properties in Ede are equipped to host 3.2 guests.
Ede Airbnb Booking Patterns (2025): Available vs. Booked Days
Available Days Distribution
Booked Days Distribution
Booking Pattern Insights for Ede
- The most common availability pattern in Ede falls within the 91-180 days range, representing 50% of listings. This suggests many properties have significant open periods on their calendars.
- Approximately 38.9% of listings show high availability (181+ days open annually), indicating potential for increased bookings or specific owner usage patterns.
- For booked days, the 181-270 days range is most frequent in Ede (44.4%), reflecting common guest stay durations or potential owner blocking patterns.
- A notable 61.1% of properties secure long booking periods (181+ days booked per year), highlighting successful long-term rental strategies or significant owner usage.
Ede Airbnb Minimum Stay Requirements Analysis
Distribution of Listings by Minimum Night Requirement
1 Night
6 listings
16.7% of total
2 Nights
20 listings
55.6% of total
3 Nights
3 listings
8.3% of total
4-6 Nights
1 listings
2.8% of total
7-29 Nights
2 listings
5.6% of total
30+ Nights
4 listings
11.1% of total
Key Insights
- The most prevalent minimum stay requirement in Ede is 2 Nights, adopted by 55.6% of listings. This highlights the market's preference for shorter, flexible bookings.
- A strong majority (72.3%) of the Ede Airbnb data shows acceptance of very short stays (1-2 nights), indicating a dynamic, high-turnover market.
- A significant segment (11.1%) caters to monthly stays (30+ nights) in Ede, pointing to opportunities in the extended-stay market.
Recommendations
- Align with the market by considering a 2 Nights minimum stay, as 55.6% of Ede hosts use this setting.
- If feasible, allowing 1-night stays, especially midweek or during low season, could capture last-minute bookings, as only 16.7% currently do.
- A 2-night minimum appears standard (55.6%). Consider this for weekends or peak periods.
- Explore offering discounts for stays of 30+ nights to attract the 11.1% of the market seeking extended stays.
- Adjust minimum nights based on seasonality – potentially shorter during low season and longer during peak demand periods in Ede.
Ede Airbnb Cancellation Policy Trends Analysis (2025)
Flexible
5 listings
14.3% of total
Moderate
16 listings
45.7% of total
Firm
5 listings
14.3% of total
Strict
9 listings
25.7% of total
Cancellation Policy Insights for Ede
- The prevailing Airbnb cancellation policy trend in Ede is Moderate, used by 45.7% of listings.
- There's a relatively balanced mix between guest-friendly (60.0%) and stricter (40.0%) policies, offering choices for different guest needs.
Recommendations for Hosts
- Consider adopting a Moderate policy to align with the 45.7% market standard in Ede.
- Regularly review your cancellation policy against competitors and market demand shifts in Ede.
Ede STR Booking Lead Time Analysis (2025)
Average Booking Lead Time by Month
Booking Lead Time Insights for Ede
- The overall average booking lead time for vacation rentals in Ede is 45 days.
- Guests book furthest in advance for stays during July (average 88 days), likely coinciding with peak travel demand or local events.
- The shortest booking windows occur for stays in November (average 38 days), indicating more last-minute travel plans during this time.
- Seasonally, Summer (67 days avg.) sees the longest lead times, while Fall (51 days avg.) has the shortest, reflecting typical travel planning cycles.
Recommendations for Hosts
- Use the overall average lead time (45 days) as a baseline for your pricing and availability strategy in Ede.
- For July stays, consider implementing length-of-stay discounts or slightly higher rates for bookings made less than 88 days out to capitalize on advance planning.
- Target marketing efforts for the Summer season well in advance (at least 67 days) to capture early planners.
- Monitor your own booking lead times against these Ede averages to identify opportunities for dynamic pricing adjustments.
Popular & Essential Airbnb Amenities in Ede (2025)
Amenity Prevalence
Amenity Insights for Ede
- Essential amenities in Ede that guests expect include: Heating, Wifi, Smoke alarm, Hot water, Dishes and silverware. Lacking these (any) could significantly impact bookings.
- Popular amenities like Kitchen, Essentials, Refrigerator are common but not universal. Offering these can provide a competitive edge.
Recommendations for Hosts
- Ensure your listing includes all essential amenities for Ede: Heating, Wifi, Smoke alarm, Hot water, Dishes and silverware.
- Prioritize adding missing essentials: Smoke alarm, Hot water, Dishes and silverware.
- Consider adding popular differentiators like Kitchen or Essentials to increase appeal.
- Highlight unique or less common amenities you offer (e.g., hot tub, dedicated workspace, EV charger) in your listing description and photos.
- Regularly check competitor amenities in Ede to stay competitive.
Ede Airbnb Guest Demographics & Profile Analysis (2025)
Guest Profile Summary for Ede
- The typical guest profile for Airbnb in Ede consists of a mix of domestic (44%) and international guests, with top international origins including Germany, typically belonging to the Post-2000s (Gen Z/Alpha) group (50%), primarily speaking English or Dutch.
- Domestic travelers account for 43.9% of guests.
- Key international markets include Netherlands (43.9%) and Germany (16.9%).
- Top languages spoken are English (38.5%) followed by Dutch (15.5%).
- A significant demographic segment is the Post-2000s (Gen Z/Alpha) group, representing 50% of guests.
Recommendations for Hosts
- Balance marketing efforts between domestic and international channels based on the guest mix.
- Tailor amenities and listing descriptions to appeal to the dominant Post-2000s (Gen Z/Alpha) demographic (e.g., highlight fast WiFi, smart home features, local guides).
- Highlight unique local experiences or amenities relevant to the primary guest profile.
- Consider seasonal promotions aligned with peak travel times for key origin markets.
Nearby Short-Term Rental Market Comparison
How does the Ede Airbnb market stack up against its neighbors? Compare key performance metrics like average monthly revenue, ADR, and occupancy rates in surrounding areas to understand the broader regional STR landscape.
| Market | Active Properties | Monthly Revenue | Daily Rate | Avg. Occupancy |
|---|---|---|---|---|
| Kockengen | 12 | $7,560 | $396.31 | 61% |
| Baarlo | 18 | $5,602 | $313.73 | 60% |
| Bentveld | 13 | $4,798 | $443.61 | 54% |
| Halfweg | 17 | $4,307 | $231.13 | 55% |
| Aerdenhout | 17 | $4,288 | $694.02 | 53% |
| Merksplas | 10 | $3,885 | $256.59 | 44% |
| Oud Ade | 17 | $3,779 | $277.47 | 51% |
| Rijs | 27 | $3,772 | $356.97 | 45% |
| Zwanenburg | 24 | $3,720 | $240.77 | 66% |
| Kerkdriel | 25 | $3,607 | $323.16 | 40% |