Terherne Airbnb Market Analysis 2025: Short Term Rental Data & Vacation Rental Statistics in Frisia, Netherlands
Is Airbnb profitable in Terherne in 2025? Explore comprehensive Airbnb analytics for Terherne, Frisia, Netherlands to uncover income potential. This 2025 STR market report for Terherne, based on AirROI data from April 2024 to March 2025, reveals key trends in the niche market of 19 active listings.
Whether you're considering an Airbnb investment in Terherne, optimizing your existing vacation rental, or exploring rental arbitrage opportunities, understanding the Terherne Airbnb data is crucial. Leveraging the low regulation environment is key to maximizing your short term rental income potential. Let's dive into the specifics.
Key Terherne Airbnb Performance Metrics Overview
Monthly Airbnb Revenue Variations & Income Potential in Terherne (2025)
Understanding the monthly revenue variations for Airbnb listings in Terherne is key to maximizing your short term rental income potential. Seasonality significantly impacts earnings. Our analysis, based on data from the past 12 months, shows that the peak revenue month for STRs in Terherne is typically August, while February often presents the lowest earnings, highlighting opportunities for strategic pricing adjustments during shoulder and low seasons. Explore the typical Airbnb income in Terherne across different performance tiers:
- Best-in-class properties (Top 10%) achieve $4,010+ monthly, often utilizing dynamic pricing and superior guest experiences.
- Strong performing properties (Top 25%) earn $3,157 or more, indicating effective management and desirable locations/amenities.
- Typical properties (Median) generate around $2,138 per month, representing the average market performance.
- Entry-level properties (Bottom 25%) see earnings around $1,129, often with potential for optimization.
Average Monthly Airbnb Earnings Trend in Terherne
Terherne Airbnb Occupancy Rate Trends (2025)
Maximize your bookings by understanding the Terherne STR occupancy trends. Seasonal demand shifts significantly influence how often properties are booked. Typically, Augustsees the highest demand (peak season occupancy), while January experiences the lowest (low season). Effective strategies, like adjusting minimum stays or offering promotions, can boost occupancy during slower periods. Here's how different property tiers perform in Terherne:
- Best-in-class properties (Top 10%) achieve 79%+ occupancy, indicating high desirability and potentially optimized availability.
- Strong performing properties (Top 25%) maintain 60% or higher occupancy, suggesting good market fit and guest satisfaction.
- Typical properties (Median) have an occupancy rate around 44%.
- Entry-level properties (Bottom 25%) average 22% occupancy, potentially facing higher vacancy.
Average Monthly Occupancy Rate Trend in Terherne
Average Daily Rate (ADR) Airbnb Trends in Terherne (2025)
Effective short term rental pricing strategy in Terherne involves understanding monthly ADR fluctuations. The Average Daily Rate (ADR) for Airbnb in Terherne typically peaks in December and dips lowest during April. Leveraging Airbnb dynamic pricing tools or strategies based on this seasonality can significantly boost revenue. Here's a look at the typical nightly rates achieved:
- Best-in-class properties (Top 10%) command rates of $246+ per night, often due to premium features or locations.
- Strong performing properties (Top 25%) achieve nightly rates of $183 or more.
- Typical properties (Median) charge around $149 per night.
- Entry-level properties (Bottom 25%) earn around $122 per night.
Average Daily Rate (ADR) Trend by Month in Terherne
Get Live Terherne Market Intelligence 👇

Explore Real-time Analytics
Airbnb Seasonality Analysis & Trends in Terherne (2025)
Peak Season (August, July, September)
- Revenue averages $3,327 per month
- Occupancy rates average 62.8%
- Daily rates average $162
Shoulder Season
- Revenue averages $2,084 per month
- Occupancy maintains around 39.2%
- Daily rates hold near $158
Low Season (January, February, November)
- Revenue drops to average $1,561 per month
- Occupancy decreases to average 35.0%
- Daily rates adjust to average $163
Seasonality Insights for Terherne
- The Airbnb seasonality in Terherne shows highly seasonal trends requiring careful strategy. While the sections above show seasonal averages, it's also insightful to look at the extremes:
- During the high season, the absolute peak month showcases Terherne's highest earning potential, with monthly revenues capable of climbing to $3,962, occupancy reaching a high of 72.5%, and ADRs peaking at $164.
- Conversely, the slowest single month of the year, typically falling within the low season, marks the market's lowest point. In this month, revenue might dip to $1,454, occupancy could drop to 29.0%, and ADRs may adjust down to $152.
- Understanding both the seasonal averages and these monthly peaks and troughs in revenue, occupancy, and ADR is crucial for maximizing your Airbnb profit potential in Terherne.
Seasonal Strategies for Maximizing Profit
- Peak Season: Maximize revenue through premium pricing and potentially longer minimum stays. Ensure high availability.
- Low Season: Offer competitive pricing, special promotions (e.g., extended stay discounts), and flexible cancellation policies. Target off-season travelers like remote workers or budget-conscious guests.
- Shoulder Seasons: Implement dynamic pricing that balances peak and low rates. Target weekend travelers or specific events. Offer slightly more flexible terms than peak season.
- Regularly analyze your own performance against these Terherne seasonality benchmarks and adjust your pricing and availability strategy accordingly.
Best Areas for Airbnb Investment in Terherne (2025)
Exploring the top neighborhoods for short-term rentals in Terherne? This section highlights key areas, outlining why they are attractive for hosts and guests, along with notable local attractions. Consider these locations based on your target guest profile and investment strategy.
| Neighborhood / Area | Why Host Here? (Target Guests & Appeal) | Key Attractions & Landmarks |
|---|---|---|
| Terherne Village | A charming Dutch village surrounded by water, perfect for families and water sports enthusiasts. Its scenic views and local culture attract visitors looking for a peaceful getaway. | AquaZoo Friesland, De Kameleon, Water sports activities, Local cafes and restaurants |
| Terhernster Polder | A serene natural area great for nature lovers, with beautiful landscapes and excellent walking paths. Ideal for tourists seeking tranquility and outdoor adventures. | Bicycle routes, Scenic walking paths, Nature reserves, Wildlife watching |
| Sneek | Nearby city known for its historic center and marina. A popular destination for tourists exploring Friesland, with plenty of shopping and dining options. | Sneek Water Gate, Historic city center, Marina, Sneekweek sailing event |
| Heerenveen | A larger town offering cultural events, shopping, and dining. Perfect for visitors looking for urban amenities in close proximity to nature. | Thialf ice stadium, Heerenveen city center, Cultural events, Nature parks nearby |
| Langweer | A picturesque village set on a beautiful lake, popular for boating and relaxation. Attracts water sport enthusiasts and families. | Langweer Lake, Water sports, Quiet streets, Local restaurants |
| Joure | Known for its rich culture and markets, Joure is a lively town that draws visitors looking for local flavor and traditions. | Joure Clock Factory, Cultural festivals, Local markets, Shopping |
| Gaasterland | An area of natural beauty with forests and lakes, ideal for outdoor activities such as hiking and biking. Attracts nature lovers and explorers. | Gaasterland National Park, Hiking and biking trails, Lakes and scenery |
| De Fryske Marren | A municipality with diverse landscapes including lakes, forests, and quaint villages. Great for tourists looking for variety and outdoor activities. | Water sports, Nature areas, Traditional Dutch villages, Cycle routes |
Understanding Airbnb License Requirements & STR Laws in Terherne (2025)
While Terherne, Frisia, Netherlands currently shows low STR regulations, specific Airbnb license requirements might still exist or change. Always verify the latest short term rental regulations and Airbnb license requirements directly with local government authorities for Terherne to ensure full compliance before hosting.
(Source: AirROI data, 2025, finding no licensed listings among those analyzed)
Top Performing Airbnb Properties in Terherne (2025)
Benchmark your potential! Explore examples of top-performing Airbnb properties in Terhernebased on Trailing Twelve Month (TTM) revenue. Analyze their characteristics, revenue, occupancy rate, and ADR to understand what drives success in this market.

Friesgroen Vacationhome
Entire Place • 3 bedrooms
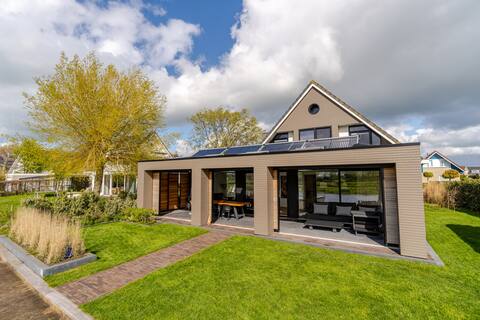
Watervilla Terhorne directly on the waterfront
Entire Place • 4 bedrooms

Light and spacious summer villa
Entire Place • 3 bedrooms

vintage bed boat farmhouse at lakeside
Entire Place • 3 bedrooms
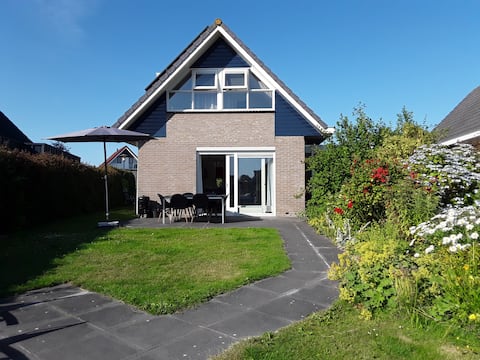
Vacation home on the water, with jetty
Entire Place • 3 bedrooms

Idyllic holiday home Fenna on the Sneekermeer
Entire Place • 2 bedrooms
Note: Performance varies based on location, size, amenities, seasonality, and management quality. Data reflects the past 12 months.
Top Performing Airbnb Hosts in Terherne (2025)
Learn from the best! This table showcases top-performing Airbnb hosts in Terherne based on the number of properties managed and estimated total revenue over the past year. Analyze their scale and performance metrics.
| Host Name | Properties | Grossing Revenue | Stay Reviews | Avg Rating |
|---|---|---|---|---|
| Steffen | 1 | $39,004 | 154 | 4.87/5.0 |
| Pascal | 1 | $37,297 | 53 | 4.92/5.0 |
| Marijke | 1 | $27,621 | 5 | 4.80/5.0 |
| Nico | 1 | $27,496 | 231 | 4.88/5.0 |
| Anneke | 1 | $26,503 | 116 | 4.62/5.0 |
| Manfred | 1 | $24,625 | 97 | 4.57/5.0 |
| Karin | 1 | $23,250 | 111 | 4.67/5.0 |
| Sander | 1 | $22,088 | 6 | 5.00/5.0 |
| Henry & Wilma | 1 | $21,523 | 32 | 4.78/5.0 |
| Martine Mirjam | 1 | $17,453 | 19 | 4.79/5.0 |
Analyzing the strategies of top hosts, such as their property selection, pricing, and guest communication, can offer valuable lessons for optimizing your own Airbnb operations in Terherne.
Dive Deeper: Advanced Terherne STR Market Data (2025)
Ready to unlock more insights? AirROI provides access to advanced metrics and comprehensive Airbnb data for Terherne. Explore detailed analytics beyond this report to refine your investment strategy, optimize pricing, and maximize your vacation rental profits.
Explore Advanced MetricsTerherne Short-Term Rental Market Composition (2025): Property & Room Types
Room Type Distribution
Property Type Distribution
Market Composition Insights for Terherne
- The Terherne Airbnb market composition is heavily skewed towards Entire Home/Apt listings, which make up 100% of the 19 active rentals. This indicates strong guest preference for privacy and space.
- Looking at the property type distribution in Terherne, House properties are the most common (84.2%), reflecting the local real estate landscape.
- Houses represent a significant 84.2% portion, catering likely to families or larger groups.
Terherne Airbnb Room Capacity Analysis (2025): Bedroom Distribution
Distribution of Listings by Number of Bedrooms
Room Capacity Insights for Terherne
- The dominant room capacity in Terherne is 3 bedrooms listings, making up 52.6% of the market. This suggests a strong demand for properties suitable for families or small groups.
- Together, 3 bedrooms and 2 bedrooms properties represent 84.2% of the active Airbnb listings in Terherne, indicating a high concentration in these sizes.
- A significant 63.1% of listings offer 3+ bedrooms, catering to larger groups and families seeking more space in Terherne.
Terherne Vacation Rental Guest Capacity Trends (2025)
Distribution of Listings by Guest Capacity
Guest Capacity Insights for Terherne
- The most common guest capacity trend in Terherne vacation rentals is listings accommodating 5 guests (36.8%). This suggests the primary traveler segment is likely larger groups.
- Properties designed for 5 guests and 6 guests dominate the Terherne STR market, accounting for 63.1% of listings.
- 42.1% of properties accommodate 6+ guests, serving the market segment for larger families or group travel in Terherne.
- On average, properties in Terherne are equipped to host 5.5 guests.
Terherne Airbnb Booking Patterns (2025): Available vs. Booked Days
Available Days Distribution
Booked Days Distribution
Booking Pattern Insights for Terherne
- The most common availability pattern in Terherne falls within the 181-270 days range, representing 63.2% of listings. This suggests many properties have significant open periods on their calendars.
- Approximately 89.5% of listings show high availability (181+ days open annually), indicating potential for increased bookings or specific owner usage patterns.
- For booked days, the 91-180 days range is most frequent in Terherne (57.9%), reflecting common guest stay durations or potential owner blocking patterns.
- A notable 15.8% of properties secure long booking periods (181+ days booked per year), highlighting successful long-term rental strategies or significant owner usage.
Terherne Airbnb Minimum Stay Requirements Analysis
Distribution of Listings by Minimum Night Requirement
1 Night
2 listings
10.5% of total
2 Nights
4 listings
21.1% of total
3 Nights
5 listings
26.3% of total
4-6 Nights
3 listings
15.8% of total
7-29 Nights
1 listings
5.3% of total
30+ Nights
4 listings
21.1% of total
Key Insights
- The most prevalent minimum stay requirement in Terherne is 3 Nights, adopted by 26.3% of listings. This highlights the market's preference for longer commitments.
- A significant segment (21.1%) caters to monthly stays (30+ nights) in Terherne, pointing to opportunities in the extended-stay market.
Recommendations
- Align with the market by considering a 3 Nights minimum stay, as 26.3% of Terherne hosts use this setting.
- If feasible, allowing 1-night stays, especially midweek or during low season, could capture last-minute bookings, as only 10.5% currently do.
- Explore offering discounts for stays of 30+ nights to attract the 21.1% of the market seeking extended stays.
- Adjust minimum nights based on seasonality – potentially shorter during low season and longer during peak demand periods in Terherne.
Terherne Airbnb Cancellation Policy Trends Analysis (2025)
Flexible
3 listings
16.7% of total
Moderate
2 listings
11.1% of total
Firm
10 listings
55.6% of total
Strict
3 listings
16.7% of total
Cancellation Policy Insights for Terherne
- The prevailing Airbnb cancellation policy trend in Terherne is Firm, used by 55.6% of listings.
- A majority (72.3%) of hosts in Terherne utilize Firm or Strict policies, indicating a market where hosts prioritize booking security.
Recommendations for Hosts
- Consider adopting a Firm policy to align with the 55.6% market standard in Terherne.
- Regularly review your cancellation policy against competitors and market demand shifts in Terherne.
Terherne STR Booking Lead Time Analysis (2025)
Average Booking Lead Time by Month
Booking Lead Time Insights for Terherne
- The overall average booking lead time for vacation rentals in Terherne is 65 days.
- Guests book furthest in advance for stays during July (average 112 days), likely coinciding with peak travel demand or local events.
- The shortest booking windows occur for stays in February (average 40 days), indicating more last-minute travel plans during this time.
- Seasonally, Summer (98 days avg.) sees the longest lead times, while Fall (54 days avg.) has the shortest, reflecting typical travel planning cycles.
Recommendations for Hosts
- Use the overall average lead time (65 days) as a baseline for your pricing and availability strategy in Terherne.
- For July stays, consider implementing length-of-stay discounts or slightly higher rates for bookings made less than 112 days out to capitalize on advance planning.
- Target marketing efforts for the Summer season well in advance (at least 98 days) to capture early planners.
- Monitor your own booking lead times against these Terherne averages to identify opportunities for dynamic pricing adjustments.
Popular & Essential Airbnb Amenities in Terherne (2025)
Amenity Prevalence
Amenity Insights for Terherne
- Essential amenities in Terherne that guests expect include: Heating, Kitchen. Lacking these (any) could significantly impact bookings.
- Popular amenities like Free parking on premises, Wifi, Coffee maker are common but not universal. Offering these can provide a competitive edge.
- Warning: Wifi is not universally provided but is considered essential globally. Ensure reliable Wifi is offered.
Recommendations for Hosts
- Ensure your listing includes all essential amenities for Terherne: Heating, Kitchen.
- Consider adding popular differentiators like Free parking on premises or Wifi to increase appeal.
- Highlight unique or less common amenities you offer (e.g., hot tub, dedicated workspace, EV charger) in your listing description and photos.
- Regularly check competitor amenities in Terherne to stay competitive.
Terherne Airbnb Guest Demographics & Profile Analysis (2025)
Guest Profile Summary for Terherne
- The typical guest profile for Airbnb in Terherne consists of a mix of domestic (43%) and international guests, with top international origins including Germany, typically belonging to the Post-2000s (Gen Z/Alpha) group (50%), primarily speaking English or German.
- Domestic travelers account for 43.2% of guests.
- Key international markets include Netherlands (43.2%) and Germany (41.2%).
- Top languages spoken are English (42%) followed by German (31.1%).
- A significant demographic segment is the Post-2000s (Gen Z/Alpha) group, representing 50% of guests.
Recommendations for Hosts
- Balance marketing efforts between domestic and international channels based on the guest mix.
- Tailor amenities and listing descriptions to appeal to the dominant Post-2000s (Gen Z/Alpha) demographic (e.g., highlight fast WiFi, smart home features, local guides).
- Highlight unique local experiences or amenities relevant to the primary guest profile.
- Consider seasonal promotions aligned with peak travel times for key origin markets.
Nearby Short-Term Rental Market Comparison
How does the Terherne Airbnb market stack up against its neighbors? Compare key performance metrics like average monthly revenue, ADR, and occupancy rates in surrounding areas to understand the broader regional STR landscape.
| Market | Active Properties | Monthly Revenue | Daily Rate | Avg. Occupancy |
|---|---|---|---|---|
| Kockengen | 12 | $7,560 | $396.31 | 61% |
| Bentveld | 13 | $4,798 | $443.61 | 54% |
| Halfweg | 17 | $4,307 | $231.13 | 55% |
| Aerdenhout | 17 | $4,288 | $694.02 | 53% |
| Oud Ade | 17 | $3,779 | $277.47 | 51% |
| Rijs | 27 | $3,772 | $356.97 | 45% |
| Zwanenburg | 24 | $3,720 | $240.77 | 66% |
| Kortenhoef | 15 | $3,495 | $255.48 | 53% |
| Ouderkerk aan de Amstel | 28 | $3,433 | $231.63 | 57% |
| Amsterdam | 4,967 | $3,368 | $295.90 | 52% |