Oudega Airbnb Market Analysis 2025: Short Term Rental Data & Vacation Rental Statistics in Frisia, Netherlands
Is Airbnb profitable in Oudega in 2025? Explore comprehensive Airbnb analytics for Oudega, Frisia, Netherlands to uncover income potential. This 2025 STR market report for Oudega, based on AirROI data from April 2024 to March 2025, reveals key trends in the niche market of 17 active listings.
Whether you're considering an Airbnb investment in Oudega, optimizing your existing vacation rental, or exploring rental arbitrage opportunities, understanding the Oudega Airbnb data is crucial. Leveraging the low regulation environment is key to maximizing your short term rental income potential. Let's dive into the specifics.
Key Oudega Airbnb Performance Metrics Overview
Monthly Airbnb Revenue Variations & Income Potential in Oudega (2025)
Understanding the monthly revenue variations for Airbnb listings in Oudega is key to maximizing your short term rental income potential. Seasonality significantly impacts earnings. Our analysis, based on data from the past 12 months, shows that the peak revenue month for STRs in Oudega is typically July, while January often presents the lowest earnings, highlighting opportunities for strategic pricing adjustments during shoulder and low seasons. Explore the typical Airbnb income in Oudega across different performance tiers:
- Best-in-class properties (Top 10%) achieve $3,245+ monthly, often utilizing dynamic pricing and superior guest experiences.
- Strong performing properties (Top 25%) earn $2,331 or more, indicating effective management and desirable locations/amenities.
- Typical properties (Median) generate around $1,579 per month, representing the average market performance.
- Entry-level properties (Bottom 25%) see earnings around $748, often with potential for optimization.
Average Monthly Airbnb Earnings Trend in Oudega
Oudega Airbnb Occupancy Rate Trends (2025)
Maximize your bookings by understanding the Oudega STR occupancy trends. Seasonal demand shifts significantly influence how often properties are booked. Typically, Julysees the highest demand (peak season occupancy), while January experiences the lowest (low season). Effective strategies, like adjusting minimum stays or offering promotions, can boost occupancy during slower periods. Here's how different property tiers perform in Oudega:
- Best-in-class properties (Top 10%) achieve 67%+ occupancy, indicating high desirability and potentially optimized availability.
- Strong performing properties (Top 25%) maintain 57% or higher occupancy, suggesting good market fit and guest satisfaction.
- Typical properties (Median) have an occupancy rate around 45%.
- Entry-level properties (Bottom 25%) average 25% occupancy, potentially facing higher vacancy.
Average Monthly Occupancy Rate Trend in Oudega
Average Daily Rate (ADR) Airbnb Trends in Oudega (2025)
Effective short term rental pricing strategy in Oudega involves understanding monthly ADR fluctuations. The Average Daily Rate (ADR) for Airbnb in Oudega typically peaks in July and dips lowest during December. Leveraging Airbnb dynamic pricing tools or strategies based on this seasonality can significantly boost revenue. Here's a look at the typical nightly rates achieved:
- Best-in-class properties (Top 10%) command rates of $246+ per night, often due to premium features or locations.
- Strong performing properties (Top 25%) achieve nightly rates of $133 or more.
- Typical properties (Median) charge around $112 per night.
- Entry-level properties (Bottom 25%) earn around $91 per night.
Average Daily Rate (ADR) Trend by Month in Oudega
Get Live Oudega Market Intelligence 👇

Explore Real-time Analytics
Airbnb Seasonality Analysis & Trends in Oudega (2025)
Peak Season (July, August, May)
- Revenue averages $2,585 per month
- Occupancy rates average 62.3%
- Daily rates average $135
Shoulder Season
- Revenue averages $1,730 per month
- Occupancy maintains around 39.8%
- Daily rates hold near $131
Low Season (January, February, March)
- Revenue drops to average $1,183 per month
- Occupancy decreases to average 26.5%
- Daily rates adjust to average $129
Seasonality Insights for Oudega
- The Airbnb seasonality in Oudega shows highly seasonal trends requiring careful strategy. While the sections above show seasonal averages, it's also insightful to look at the extremes:
- During the high season, the absolute peak month showcases Oudega's highest earning potential, with monthly revenues capable of climbing to $2,838, occupancy reaching a high of 69.0%, and ADRs peaking at $137.
- Conversely, the slowest single month of the year, typically falling within the low season, marks the market's lowest point. In this month, revenue might dip to $1,097, occupancy could drop to 22.9%, and ADRs may adjust down to $126.
- Understanding both the seasonal averages and these monthly peaks and troughs in revenue, occupancy, and ADR is crucial for maximizing your Airbnb profit potential in Oudega.
Seasonal Strategies for Maximizing Profit
- Peak Season: Maximize revenue through premium pricing and potentially longer minimum stays. Ensure high availability.
- Low Season: Offer competitive pricing, special promotions (e.g., extended stay discounts), and flexible cancellation policies. Target off-season travelers like remote workers or budget-conscious guests.
- Shoulder Seasons: Implement dynamic pricing that balances peak and low rates. Target weekend travelers or specific events. Offer slightly more flexible terms than peak season.
- Regularly analyze your own performance against these Oudega seasonality benchmarks and adjust your pricing and availability strategy accordingly.
Best Areas for Airbnb Investment in Oudega (2025)
Exploring the top neighborhoods for short-term rentals in Oudega? This section highlights key areas, outlining why they are attractive for hosts and guests, along with notable local attractions. Consider these locations based on your target guest profile and investment strategy.
| Neighborhood / Area | Why Host Here? (Target Guests & Appeal) | Key Attractions & Landmarks |
|---|---|---|
| Oudega Marina | A beautiful area with a marina that attracts boat enthusiasts and nature lovers. Ideal for hosting travelers looking to enjoy the water and relax in a peaceful setting. | Oudega Lake, Water sports activities, Nature trails, Scenic views, Fishing spots |
| Oudega Village Center | The heart of Oudega, with charming streets, local shops, and cafes. Great for visitors wanting to experience local culture and community life. | Local shops and boutiques, Cafes and restaurants, Community events, Historical sites, Nearby parks |
| Frisian Nature Reserves | Surrounded by beautiful nature reserves, perfect for hiking, cycling, and enjoying the great outdoors. Attracts nature lovers and families looking for adventure. | Alde Feanen National Park, Dunes of Frisia, Bird watching, Hiking and biking trails, Peaceful landscapes |
| Nearby Sneek | A historic town close to Oudega known for its waterways and vibrant culture. Popular with tourists for its attractions and events. | Sneekermeer Lake, Water sports, Historic buildings, Annual events, Local dining options |
| Woudsend | A quaint village nearby with a rich sailing history. Perfect for those who want a quieter experience while still being close to water activities. | Historic harbor, Sailing schools, Local restaurants, Cycling paths, Cultural events |
| Lemmer Beach | A lovely beach destination nearby, ideal for families and beachgoers looking for sun and sand. Attracts tourists during the warm months. | Swimming opportunities, Beachfront activities, Local cafes, Water sports rentals, Scenic beach walks |
| Kuinre | A historic village known for its traditional Dutch architecture and peaceful countryside. Great for hosting guests wanting a rural escape. | Traditional Dutch buildings, Local farms, Biking routes, Cultural heritage, Nature parks |
| Balk | A charming village with a scenic setting along the river. Popular for its hospitality and proximity to natural attractions. | River activities, Quaint village atmosphere, Local festivals, Cycling paths, Nature walks |
Understanding Airbnb License Requirements & STR Laws in Oudega (2025)
While Oudega, Frisia, Netherlands currently shows low STR regulations, specific Airbnb license requirements might still exist or change. Always verify the latest short term rental regulations and Airbnb license requirements directly with local government authorities for Oudega to ensure full compliance before hosting.
(Source: AirROI data, 2025, finding no licensed listings among those analyzed)
Top Performing Airbnb Properties in Oudega (2025)
Benchmark your potential! Explore examples of top-performing Airbnb properties in Oudegabased on Trailing Twelve Month (TTM) revenue. Analyze their characteristics, revenue, occupancy rate, and ADR to understand what drives success in this market.
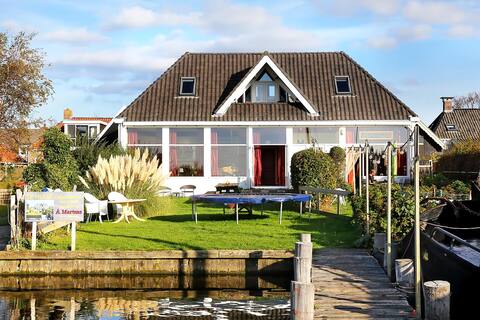
Vakantiewoning oan 'e Brek
Entire Place • 6 bedrooms

Cozy Tiny house in National Park the Old Fens
Entire Place • 1 bedroom

Surprising Tinyhouse overlooking National Park
Entire Place • 1 bedroom

Delightful holiday home in the middle of nature!
Entire Place • 1 bedroom
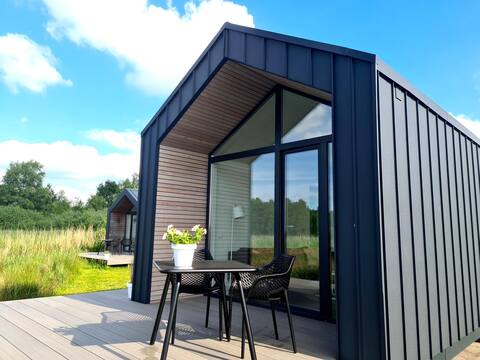
Cozy Tinyhouse in National Park de Alde Feanen
Entire Place • 1 bedroom
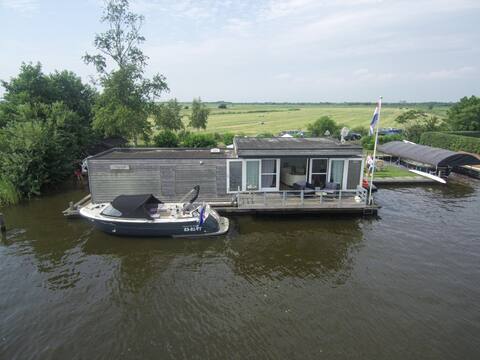
Luxury houseboat unique location Friesland Âlde Feanen
Entire Place • 3 bedrooms
Note: Performance varies based on location, size, amenities, seasonality, and management quality. Data reflects the past 12 months.
Top Performing Airbnb Hosts in Oudega (2025)
Learn from the best! This table showcases top-performing Airbnb hosts in Oudega based on the number of properties managed and estimated total revenue over the past year. Analyze their scale and performance metrics.
| Host Name | Properties | Grossing Revenue | Stay Reviews | Avg Rating |
|---|---|---|---|---|
| Harmke | 5 | $124,262 | 657 | 4.89/5.0 |
| Age | 1 | $57,457 | 291 | 4.68/5.0 |
| Josja | 2 | $25,359 | 93 | 4.77/5.0 |
| Pier | 1 | $20,748 | 26 | 5.00/5.0 |
| Age | 3 | $17,566 | 219 | 4.87/5.0 |
| Ypkjen | 1 | $14,628 | 23 | 4.96/5.0 |
| Host #8227133 | 1 | $13,966 | 88 | 4.74/5.0 |
| Jetse | 1 | $5,902 | 62 | 4.92/5.0 |
| Wiepkje | 2 | $2,824 | 3 | 2.50/5.0 |
Analyzing the strategies of top hosts, such as their property selection, pricing, and guest communication, can offer valuable lessons for optimizing your own Airbnb operations in Oudega.
Dive Deeper: Advanced Oudega STR Market Data (2025)
Ready to unlock more insights? AirROI provides access to advanced metrics and comprehensive Airbnb data for Oudega. Explore detailed analytics beyond this report to refine your investment strategy, optimize pricing, and maximize your vacation rental profits.
Explore Advanced MetricsOudega Short-Term Rental Market Composition (2025): Property & Room Types
Room Type Distribution
Property Type Distribution
Market Composition Insights for Oudega
- The Oudega Airbnb market composition is heavily skewed towards Entire Home/Apt listings, which make up 94.1% of the 17 active rentals. This indicates strong guest preference for privacy and space.
- Looking at the property type distribution in Oudega, House properties are the most common (82.4%), reflecting the local real estate landscape.
- Houses represent a significant 82.4% portion, catering likely to families or larger groups.
Oudega Airbnb Room Capacity Analysis (2025): Bedroom Distribution
Distribution of Listings by Number of Bedrooms
Room Capacity Insights for Oudega
- The dominant room capacity in Oudega is 1 bedroom listings, making up 70.6% of the market. This suggests a strong demand for properties suitable for couples or solo travelers.
- Together, 1 bedroom and 2 bedrooms properties represent 82.4% of the active Airbnb listings in Oudega, indicating a high concentration in these sizes.
- With over half the market (70.6%) consisting of studios or 1-bedroom units, Oudega is particularly well-suited for individuals or couples.
Oudega Vacation Rental Guest Capacity Trends (2025)
Distribution of Listings by Guest Capacity
Guest Capacity Insights for Oudega
- The most common guest capacity trend in Oudega vacation rentals is listings accommodating 2 guests (58.8%). This suggests the primary traveler segment is likely couples or solo travelers.
- Properties designed for 2 guests and 4 guests dominate the Oudega STR market, accounting for 82.3% of listings.
- A significant 58.8% of listings cater specifically to 1-2 guests, highlighting strong demand from couples and solo travelers in Oudega.
- 11.8% of properties accommodate 6+ guests, serving the market segment for larger families or group travel in Oudega.
- On average, properties in Oudega are equipped to host 3.2 guests.
Oudega Airbnb Booking Patterns (2025): Available vs. Booked Days
Available Days Distribution
Booked Days Distribution
Booking Pattern Insights for Oudega
- The most common availability pattern in Oudega falls within the 271-366 days range, representing 41.2% of listings. This suggests many properties have significant open periods on their calendars.
- Approximately 76.5% of listings show high availability (181+ days open annually), indicating potential for increased bookings or specific owner usage patterns.
- For booked days, the 31-90 days range is most frequent in Oudega (29.4%), reflecting common guest stay durations or potential owner blocking patterns.
- A notable 29.4% of properties secure long booking periods (181+ days booked per year), highlighting successful long-term rental strategies or significant owner usage.
Oudega Airbnb Minimum Stay Requirements Analysis
Distribution of Listings by Minimum Night Requirement
1 Night
2 listings
12.5% of total
2 Nights
12 listings
75% of total
3 Nights
1 listings
6.3% of total
7-29 Nights
1 listings
6.3% of total
Key Insights
- The most prevalent minimum stay requirement in Oudega is 2 Nights, adopted by 75% of listings. This highlights the market's preference for shorter, flexible bookings.
- A strong majority (87.5%) of the Oudega Airbnb data shows acceptance of very short stays (1-2 nights), indicating a dynamic, high-turnover market.
Recommendations
- Align with the market by considering a 2 Nights minimum stay, as 75% of Oudega hosts use this setting.
- If feasible, allowing 1-night stays, especially midweek or during low season, could capture last-minute bookings, as only 12.5% currently do.
- A 2-night minimum appears standard (75%). Consider this for weekends or peak periods.
- Adjust minimum nights based on seasonality – potentially shorter during low season and longer during peak demand periods in Oudega.
Oudega Airbnb Cancellation Policy Trends Analysis (2025)
Flexible
8 listings
50% of total
Moderate
4 listings
25% of total
Firm
4 listings
25% of total
Cancellation Policy Insights for Oudega
- The prevailing Airbnb cancellation policy trend in Oudega is Flexible, used by 50% of listings.
- The market strongly favors guest-friendly terms, with 75.0% of listings offering Flexible or Moderate policies. This suggests guests in Oudega may expect booking flexibility.
Recommendations for Hosts
- Consider adopting a Flexible policy to align with the 50% market standard in Oudega.
- Regularly review your cancellation policy against competitors and market demand shifts in Oudega.
Oudega STR Booking Lead Time Analysis (2025)
Average Booking Lead Time by Month
Booking Lead Time Insights for Oudega
- The overall average booking lead time for vacation rentals in Oudega is 66 days.
- Guests book furthest in advance for stays during October (average 103 days), likely coinciding with peak travel demand or local events.
- The shortest booking windows occur for stays in February (average 36 days), indicating more last-minute travel plans during this time.
- Seasonally, Summer (88 days avg.) sees the longest lead times, while Winter (51 days avg.) has the shortest, reflecting typical travel planning cycles.
Recommendations for Hosts
- Use the overall average lead time (66 days) as a baseline for your pricing and availability strategy in Oudega.
- For October stays, consider implementing length-of-stay discounts or slightly higher rates for bookings made less than 103 days out to capitalize on advance planning.
- Target marketing efforts for the Summer season well in advance (at least 88 days) to capture early planners.
- Monitor your own booking lead times against these Oudega averages to identify opportunities for dynamic pricing adjustments.
Popular & Essential Airbnb Amenities in Oudega (2025)
Amenity Prevalence
Amenity Insights for Oudega
- Essential amenities in Oudega that guests expect include: Smoke alarm. Lacking these (this) could significantly impact bookings.
- Popular amenities like Kitchen, Free parking on premises, Heating are common but not universal. Offering these can provide a competitive edge.
- Warning: Wifi is not universally provided but is considered essential globally. Ensure reliable Wifi is offered.
Recommendations for Hosts
- Ensure your listing includes all essential amenities for Oudega: Smoke alarm.
- Consider adding popular differentiators like Kitchen or Free parking on premises to increase appeal.
- Highlight unique or less common amenities you offer (e.g., hot tub, dedicated workspace, EV charger) in your listing description and photos.
- Regularly check competitor amenities in Oudega to stay competitive.
Oudega Airbnb Guest Demographics & Profile Analysis (2025)
Guest Profile Summary for Oudega
- The typical guest profile for Airbnb in Oudega consists of a mix of domestic (49%) and international guests, with top international origins including Germany, typically belonging to the Post-2000s (Gen Z/Alpha) group (50%), primarily speaking English or German.
- Domestic travelers account for 48.6% of guests.
- Key international markets include Netherlands (48.6%) and Germany (40.5%).
- Top languages spoken are English (39.1%) followed by German (27.1%).
- A significant demographic segment is the Post-2000s (Gen Z/Alpha) group, representing 50% of guests.
Recommendations for Hosts
- Balance marketing efforts between domestic and international channels based on the guest mix.
- Tailor amenities and listing descriptions to appeal to the dominant Post-2000s (Gen Z/Alpha) demographic (e.g., highlight fast WiFi, smart home features, local guides).
- Highlight unique local experiences or amenities relevant to the primary guest profile.
- Consider seasonal promotions aligned with peak travel times for key origin markets.
Nearby Short-Term Rental Market Comparison
How does the Oudega Airbnb market stack up against its neighbors? Compare key performance metrics like average monthly revenue, ADR, and occupancy rates in surrounding areas to understand the broader regional STR landscape.
| Market | Active Properties | Monthly Revenue | Daily Rate | Avg. Occupancy |
|---|---|---|---|---|
| Kockengen | 12 | $7,560 | $396.31 | 61% |
| Bentveld | 13 | $4,798 | $443.61 | 54% |
| Halfweg | 17 | $4,307 | $231.13 | 55% |
| Aerdenhout | 17 | $4,288 | $694.02 | 53% |
| Oud Ade | 17 | $3,779 | $277.47 | 51% |
| Rijs | 27 | $3,772 | $356.97 | 45% |
| Zwanenburg | 24 | $3,720 | $240.77 | 66% |
| Kortenhoef | 15 | $3,495 | $255.48 | 53% |
| Ouderkerk aan de Amstel | 28 | $3,433 | $231.63 | 57% |
| Amsterdam | 4,967 | $3,368 | $295.90 | 52% |