Oost-Vlieland Airbnb Market Analysis 2025: Short Term Rental Data & Vacation Rental Statistics in Frisia, Netherlands
Is Airbnb profitable in Oost-Vlieland in 2025? Explore comprehensive Airbnb analytics for Oost-Vlieland, Frisia, Netherlands to uncover income potential. This 2025 STR market report for Oost-Vlieland, based on AirROI data from April 2024 to March 2025, reveals key trends in the niche market of 29 active listings.
Whether you're considering an Airbnb investment in Oost-Vlieland, optimizing your existing vacation rental, or exploring rental arbitrage opportunities, understanding the Oost-Vlieland Airbnb data is crucial. Leveraging the low regulation environment is key to maximizing your short term rental income potential. Let's dive into the specifics.
Key Oost-Vlieland Airbnb Performance Metrics Overview
Monthly Airbnb Revenue Variations & Income Potential in Oost-Vlieland (2025)
Understanding the monthly revenue variations for Airbnb listings in Oost-Vlieland is key to maximizing your short term rental income potential. Seasonality significantly impacts earnings. Our analysis, based on data from the past 12 months, shows that the peak revenue month for STRs in Oost-Vlieland is typically October, while February often presents the lowest earnings, highlighting opportunities for strategic pricing adjustments during shoulder and low seasons. Explore the typical Airbnb income in Oost-Vlieland across different performance tiers:
- Best-in-class properties (Top 10%) achieve $4,411+ monthly, often utilizing dynamic pricing and superior guest experiences.
- Strong performing properties (Top 25%) earn $2,839 or more, indicating effective management and desirable locations/amenities.
- Typical properties (Median) generate around $2,063 per month, representing the average market performance.
- Entry-level properties (Bottom 25%) see earnings around $1,230, often with potential for optimization.
Average Monthly Airbnb Earnings Trend in Oost-Vlieland
Oost-Vlieland Airbnb Occupancy Rate Trends (2025)
Maximize your bookings by understanding the Oost-Vlieland STR occupancy trends. Seasonal demand shifts significantly influence how often properties are booked. Typically, Augustsees the highest demand (peak season occupancy), while December experiences the lowest (low season). Effective strategies, like adjusting minimum stays or offering promotions, can boost occupancy during slower periods. Here's how different property tiers perform in Oost-Vlieland:
- Best-in-class properties (Top 10%) achieve 79%+ occupancy, indicating high desirability and potentially optimized availability.
- Strong performing properties (Top 25%) maintain 69% or higher occupancy, suggesting good market fit and guest satisfaction.
- Typical properties (Median) have an occupancy rate around 51%.
- Entry-level properties (Bottom 25%) average 30% occupancy, potentially facing higher vacancy.
Average Monthly Occupancy Rate Trend in Oost-Vlieland
Average Daily Rate (ADR) Airbnb Trends in Oost-Vlieland (2025)
Effective short term rental pricing strategy in Oost-Vlieland involves understanding monthly ADR fluctuations. The Average Daily Rate (ADR) for Airbnb in Oost-Vlieland typically peaks in March and dips lowest during April. Leveraging Airbnb dynamic pricing tools or strategies based on this seasonality can significantly boost revenue. Here's a look at the typical nightly rates achieved:
- Best-in-class properties (Top 10%) command rates of $246+ per night, often due to premium features or locations.
- Strong performing properties (Top 25%) achieve nightly rates of $155 or more.
- Typical properties (Median) charge around $103 per night.
- Entry-level properties (Bottom 25%) earn around $88 per night.
Average Daily Rate (ADR) Trend by Month in Oost-Vlieland
Get Live Oost-Vlieland Market Intelligence 👇

Explore Real-time Analytics
Airbnb Seasonality Analysis & Trends in Oost-Vlieland (2025)
Peak Season (October, August, July)
- Revenue averages $3,563 per month
- Occupancy rates average 65.9%
- Daily rates average $147
Shoulder Season
- Revenue averages $2,519 per month
- Occupancy maintains around 49.4%
- Daily rates hold near $147
Low Season (February, April, December)
- Revenue drops to average $1,731 per month
- Occupancy decreases to average 35.5%
- Daily rates adjust to average $148
Seasonality Insights for Oost-Vlieland
- The Airbnb seasonality in Oost-Vlieland shows highly seasonal trends requiring careful strategy. While the sections above show seasonal averages, it's also insightful to look at the extremes:
- During the high season, the absolute peak month showcases Oost-Vlieland's highest earning potential, with monthly revenues capable of climbing to $3,797, occupancy reaching a high of 70.7%, and ADRs peaking at $155.
- Conversely, the slowest single month of the year, typically falling within the low season, marks the market's lowest point. In this month, revenue might dip to $1,435, occupancy could drop to 29.0%, and ADRs may adjust down to $140.
- Understanding both the seasonal averages and these monthly peaks and troughs in revenue, occupancy, and ADR is crucial for maximizing your Airbnb profit potential in Oost-Vlieland.
Seasonal Strategies for Maximizing Profit
- Peak Season: Maximize revenue through premium pricing and potentially longer minimum stays. Ensure high availability.
- Low Season: Offer competitive pricing, special promotions (e.g., extended stay discounts), and flexible cancellation policies. Target off-season travelers like remote workers or budget-conscious guests.
- Shoulder Seasons: Implement dynamic pricing that balances peak and low rates. Target weekend travelers or specific events. Offer slightly more flexible terms than peak season.
- Regularly analyze your own performance against these Oost-Vlieland seasonality benchmarks and adjust your pricing and availability strategy accordingly.
Best Areas for Airbnb Investment in Oost-Vlieland (2025)
Exploring the top neighborhoods for short-term rentals in Oost-Vlieland? This section highlights key areas, outlining why they are attractive for hosts and guests, along with notable local attractions. Consider these locations based on your target guest profile and investment strategy.
| Neighborhood / Area | Why Host Here? (Target Guests & Appeal) | Key Attractions & Landmarks |
|---|---|---|
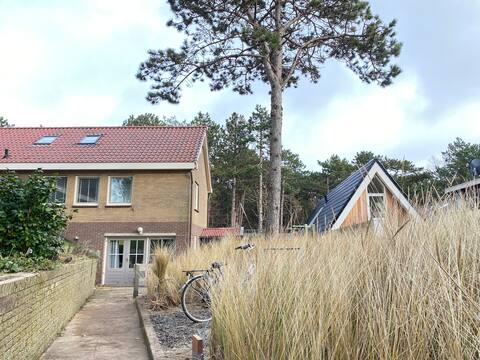
| West Frisian Beach | A serene beach area perfect for relaxation and water activities. Known for its natural beauty and tranquility, attracting tourists seeking a peaceful getaway. | Oost-Vlieland Beach, Oerol Festival, Nature reserve 'The Klarenbeek', Vlieland’s Lighthouse, Wadden Sea |
| Village Center | The charming heart of Oost-Vlieland with shops, restaurants, and local culture. A great spot for visitors who want to experience local life and enjoy amenities within walking distance. | Local shops, Restaurants, Museum Tromp's Huys, Island museum, St. Willibrordus Church |
| Nature Reserves | Beautiful natural landscapes ideal for hiking and cycling. Attracts nature lovers and those who seek outdoor adventures and pristine environments. | De Manteling Nature Reserve, Bird watching areas, Cycling routes, Hiking trails, Waddensea UNESCO World Heritage Site |
| Harbor Area | A picturesque harbor perfect for yachts and boats. Offers beautiful views and a lively atmosphere with restaurants and cafes along the water. | Vlieland Harbor, Boat tours, Fishing opportunities, Dining with a view, Harbor events |
| Dunes Area | Stunning dunes and nature landscapes, popular for hiking and exploring the outdoors. It attracts visitors looking for adventure and breathtaking views. | Dune trails, Sunset walks, Wildlife observation, Photography spots, Beach activities |
| Bunthorst National Park | A massive area of protected nature that offers a unique habitat for various flora and fauna. Perfect for eco-tourism and nature-based stays. | Bunthorst hiking trails, Guided nature tours, Wildflower parks, Educational centers, Bird watching |
| Family-friendly Areas | Sections of the island that cater to families with children, featuring safe beaches and kid-friendly amenities. Ideal for family vacations. | Kids' playgrounds, Family-oriented beaches, Cafes with kid menus, Outdoor sports facilities, Family events |
| Cultural Sites | Spot for cultural experiences including historical sites and local events. Visitors looking for cultural immersion will find this area appealing. | Local festivals, Cultural workshops, Historical landmarks, Art exhibitions, Culinary events |
Understanding Airbnb License Requirements & STR Laws in Oost-Vlieland (2025)
While Oost-Vlieland, Frisia, Netherlands currently shows low STR regulations, specific Airbnb license requirements might still exist or change. Always verify the latest short term rental regulations and Airbnb license requirements directly with local government authorities for Oost-Vlieland to ensure full compliance before hosting.
(Source: AirROI data, 2025, finding no licensed listings among those analyzed)
Top Performing Airbnb Properties in Oost-Vlieland (2025)
Benchmark your potential! Explore examples of top-performing Airbnb properties in Oost-Vlielandbased on Trailing Twelve Month (TTM) revenue. Analyze their characteristics, revenue, occupancy rate, and ADR to understand what drives success in this market.

Luxury seaside house with sauna on Vlieland
Entire Place • 6 bedrooms

Wonderful 8p holiday home Vlieland!
Entire Place • 4 bedrooms

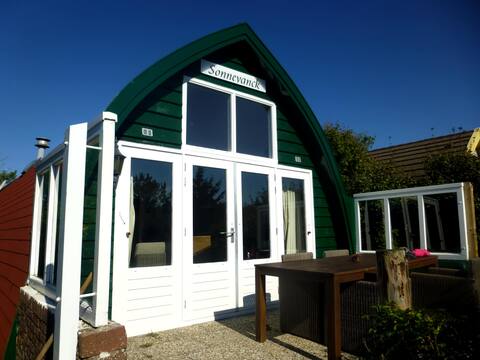
Beach cottage on Vlieland, 100 meters from the beach
Entire Place • 2 bedrooms
View of Forest 4 person (Downstairs)
Entire Place • 3 bedrooms
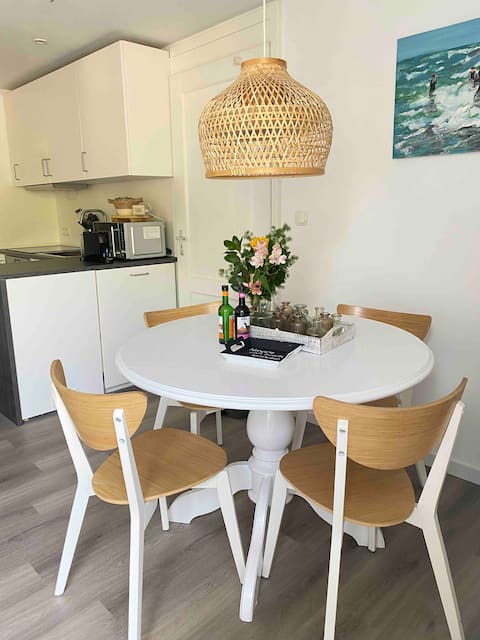
Apartment de OudeKooi
Entire Place • 1 bedroom
Unique house nearby sea and forest
Entire Place • 2 bedrooms
Note: Performance varies based on location, size, amenities, seasonality, and management quality. Data reflects the past 12 months.
Top Performing Airbnb Hosts in Oost-Vlieland (2025)
Learn from the best! This table showcases top-performing Airbnb hosts in Oost-Vlieland based on the number of properties managed and estimated total revenue over the past year. Analyze their scale and performance metrics.
| Host Name | Properties | Grossing Revenue | Stay Reviews | Avg Rating |
|---|---|---|---|---|
| Reineke | 1 | $133,187 | 4 | 5.00/5.0 |
| Maria & Harry | 4 | $124,979 | 659 | 4.75/5.0 |
| Lieke | 1 | $56,638 | 46 | 4.85/5.0 |
| Joke-Jiers | 1 | $48,811 | 143 | 4.70/5.0 |
| Marc | 1 | $29,661 | 57 | 4.44/5.0 |
| Rigtje | 1 | $24,578 | 20 | 4.75/5.0 |
| Jelle | 1 | $22,281 | 45 | 4.67/5.0 |
| Harke Gerrit | 1 | $22,141 | 140 | 4.54/5.0 |
| Jody D | 1 | $21,996 | 23 | 4.74/5.0 |
| Esther | 1 | $19,626 | 26 | 4.92/5.0 |
Analyzing the strategies of top hosts, such as their property selection, pricing, and guest communication, can offer valuable lessons for optimizing your own Airbnb operations in Oost-Vlieland.
Dive Deeper: Advanced Oost-Vlieland STR Market Data (2025)
Ready to unlock more insights? AirROI provides access to advanced metrics and comprehensive Airbnb data for Oost-Vlieland. Explore detailed analytics beyond this report to refine your investment strategy, optimize pricing, and maximize your vacation rental profits.
Explore Advanced MetricsOost-Vlieland Short-Term Rental Market Composition (2025): Property & Room Types
Room Type Distribution
Property Type Distribution
Market Composition Insights for Oost-Vlieland
- The Oost-Vlieland Airbnb market composition is heavily skewed towards Entire Home/Apt listings, which make up 100% of the 29 active rentals. This indicates strong guest preference for privacy and space.
- Looking at the property type distribution in Oost-Vlieland, Outdoor/Unique properties are the most common (55.2%), reflecting the local real estate landscape.
- Houses represent a significant 31% portion, catering likely to families or larger groups.
Oost-Vlieland Airbnb Room Capacity Analysis (2025): Bedroom Distribution
Distribution of Listings by Number of Bedrooms
Room Capacity Insights for Oost-Vlieland
- The dominant room capacity in Oost-Vlieland is 1 bedroom listings, making up 37.9% of the market. This suggests a strong demand for properties suitable for couples or solo travelers.
- Together, 1 bedroom and 2 bedrooms properties represent 68.9% of the active Airbnb listings in Oost-Vlieland, indicating a high concentration in these sizes.
- A significant 27.5% of listings offer 3+ bedrooms, catering to larger groups and families seeking more space in Oost-Vlieland.
Oost-Vlieland Vacation Rental Guest Capacity Trends (2025)
Distribution of Listings by Guest Capacity
Guest Capacity Insights for Oost-Vlieland
- The most common guest capacity trend in Oost-Vlieland vacation rentals is listings accommodating 4 guests (41.4%). This suggests the primary traveler segment is likely small families or groups.
- Properties designed for 4 guests and 2 guests dominate the Oost-Vlieland STR market, accounting for 69.0% of listings.
- 24.1% of properties accommodate 6+ guests, serving the market segment for larger families or group travel in Oost-Vlieland.
- On average, properties in Oost-Vlieland are equipped to host 4.3 guests.
Oost-Vlieland Airbnb Booking Patterns (2025): Available vs. Booked Days
Available Days Distribution
Booked Days Distribution
Booking Pattern Insights for Oost-Vlieland
- The most common availability pattern in Oost-Vlieland falls within the 271-366 days range, representing 34.5% of listings. This suggests many properties have significant open periods on their calendars.
- Approximately 65.5% of listings show high availability (181+ days open annually), indicating potential for increased bookings or specific owner usage patterns.
- For booked days, the 91-180 days range is most frequent in Oost-Vlieland (34.5%), reflecting common guest stay durations or potential owner blocking patterns.
- A notable 34.4% of properties secure long booking periods (181+ days booked per year), highlighting successful long-term rental strategies or significant owner usage.
Oost-Vlieland Airbnb Minimum Stay Requirements Analysis
Distribution of Listings by Minimum Night Requirement
1 Night
7 listings
25.9% of total
2 Nights
9 listings
33.3% of total
3 Nights
6 listings
22.2% of total
4-6 Nights
4 listings
14.8% of total
30+ Nights
1 listings
3.7% of total
Key Insights
- The most prevalent minimum stay requirement in Oost-Vlieland is 2 Nights, adopted by 33.3% of listings. This highlights the market's preference for shorter, flexible bookings.
Recommendations
- Align with the market by considering a 2 Nights minimum stay, as 33.3% of Oost-Vlieland hosts use this setting.
- If feasible, allowing 1-night stays, especially midweek or during low season, could capture last-minute bookings, as only 25.9% currently do.
- Adjust minimum nights based on seasonality – potentially shorter during low season and longer during peak demand periods in Oost-Vlieland.
Oost-Vlieland Airbnb Cancellation Policy Trends Analysis (2025)
Flexible
3 listings
11.1% of total
Moderate
8 listings
29.6% of total
Firm
5 listings
18.5% of total
Strict
11 listings
40.7% of total
Cancellation Policy Insights for Oost-Vlieland
- The prevailing Airbnb cancellation policy trend in Oost-Vlieland is Strict, used by 40.7% of listings.
- A majority (59.2%) of hosts in Oost-Vlieland utilize Firm or Strict policies, indicating a market where hosts prioritize booking security.
Recommendations for Hosts
- Consider adopting a Strict policy to align with the 40.7% market standard in Oost-Vlieland.
- With 40.7% using Strict terms, this is a viable option in Oost-Vlieland, particularly for high-value properties or during peak demand periods.
- Regularly review your cancellation policy against competitors and market demand shifts in Oost-Vlieland.
Oost-Vlieland STR Booking Lead Time Analysis (2025)
Average Booking Lead Time by Month
Booking Lead Time Insights for Oost-Vlieland
- The overall average booking lead time for vacation rentals in Oost-Vlieland is 89 days.
- Guests book furthest in advance for stays during August (average 128 days), likely coinciding with peak travel demand or local events.
- The shortest booking windows occur for stays in January (average 43 days), indicating more last-minute travel plans during this time.
- Seasonally, Summer (111 days avg.) sees the longest lead times, while Winter (61 days avg.) has the shortest, reflecting typical travel planning cycles.
Recommendations for Hosts
- Use the overall average lead time (89 days) as a baseline for your pricing and availability strategy in Oost-Vlieland.
- For August stays, consider implementing length-of-stay discounts or slightly higher rates for bookings made less than 128 days out to capitalize on advance planning.
- Target marketing efforts for the Summer season well in advance (at least 111 days) to capture early planners.
- Monitor your own booking lead times against these Oost-Vlieland averages to identify opportunities for dynamic pricing adjustments.
Popular & Essential Airbnb Amenities in Oost-Vlieland (2025)
Amenity Prevalence
Amenity Insights for Oost-Vlieland
- Essential amenities in Oost-Vlieland that guests expect include: Kitchen. Lacking these (this) could significantly impact bookings.
- Popular amenities like Wifi, Washer, Dishes and silverware are common but not universal. Offering these can provide a competitive edge.
- Warning: Wifi is not universally provided but is considered essential globally. Ensure reliable Wifi is offered.
Recommendations for Hosts
- Ensure your listing includes all essential amenities for Oost-Vlieland: Kitchen.
- Prioritize adding missing essentials: Kitchen.
- Consider adding popular differentiators like Wifi or Washer to increase appeal.
- Highlight unique or less common amenities you offer (e.g., hot tub, dedicated workspace, EV charger) in your listing description and photos.
- Regularly check competitor amenities in Oost-Vlieland to stay competitive.
Oost-Vlieland Airbnb Guest Demographics & Profile Analysis (2025)
Guest Profile Summary for Oost-Vlieland
- The typical guest profile for Airbnb in Oost-Vlieland consists of primarily domestic travelers (89%), often arriving from nearby Amsterdam, typically belonging to the Post-2000s (Gen Z/Alpha) group (50%), primarily speaking English or Dutch.
- Domestic travelers account for 89.1% of guests.
- Key international markets include Netherlands (89.1%) and Germany (6.3%).
- Top languages spoken are English (35.1%) followed by Dutch (30.5%).
- A significant demographic segment is the Post-2000s (Gen Z/Alpha) group, representing 50% of guests.
Recommendations for Hosts
- Target domestic marketing efforts towards travelers from Amsterdam and Utrecht.
- Tailor amenities and listing descriptions to appeal to the dominant Post-2000s (Gen Z/Alpha) demographic (e.g., highlight fast WiFi, smart home features, local guides).
- Highlight unique local experiences or amenities relevant to the primary guest profile.
- Consider seasonal promotions aligned with peak travel times for key origin markets.
Nearby Short-Term Rental Market Comparison
How does the Oost-Vlieland Airbnb market stack up against its neighbors? Compare key performance metrics like average monthly revenue, ADR, and occupancy rates in surrounding areas to understand the broader regional STR landscape.
| Market | Active Properties | Monthly Revenue | Daily Rate | Avg. Occupancy |
|---|---|---|---|---|
| Bentveld | 13 | $4,798 | $443.61 | 54% |
| Halfweg | 17 | $4,307 | $231.13 | 55% |
| Aerdenhout | 17 | $4,288 | $694.02 | 53% |
| Oud Ade | 17 | $3,779 | $277.47 | 51% |
| Rijs | 27 | $3,772 | $356.97 | 45% |
| Zwanenburg | 24 | $3,720 | $240.77 | 66% |
| Kortenhoef | 15 | $3,495 | $255.48 | 53% |
| Ouderkerk aan de Amstel | 28 | $3,433 | $231.63 | 57% |
| Amsterdam | 4,967 | $3,368 | $295.90 | 52% |
| Kockengen | 12 | $7,560 | $396.31 | 61% |