Offingawier Airbnb Market Analysis 2025: Short Term Rental Data & Vacation Rental Statistics in Frisia, Netherlands
Is Airbnb profitable in Offingawier in 2025? Explore comprehensive Airbnb analytics for Offingawier, Frisia, Netherlands to uncover income potential. This 2025 STR market report for Offingawier, based on AirROI data from April 2024 to March 2025, reveals key trends in the niche market of 29 active listings.
Whether you're considering an Airbnb investment in Offingawier, optimizing your existing vacation rental, or exploring rental arbitrage opportunities, understanding the Offingawier Airbnb data is crucial. Leveraging the low regulation environment is key to maximizing your short term rental income potential. Let's dive into the specifics.
Key Offingawier Airbnb Performance Metrics Overview
Monthly Airbnb Revenue Variations & Income Potential in Offingawier (2025)
Understanding the monthly revenue variations for Airbnb listings in Offingawier is key to maximizing your short term rental income potential. Seasonality significantly impacts earnings. Our analysis, based on data from the past 12 months, shows that the peak revenue month for STRs in Offingawier is typically June, while February often presents the lowest earnings, highlighting opportunities for strategic pricing adjustments during shoulder and low seasons. Explore the typical Airbnb income in Offingawier across different performance tiers:
- Best-in-class properties (Top 10%) achieve $4,117+ monthly, often utilizing dynamic pricing and superior guest experiences.
- Strong performing properties (Top 25%) earn $2,845 or more, indicating effective management and desirable locations/amenities.
- Typical properties (Median) generate around $1,605 per month, representing the average market performance.
- Entry-level properties (Bottom 25%) see earnings around $1,024, often with potential for optimization.
Average Monthly Airbnb Earnings Trend in Offingawier
Offingawier Airbnb Occupancy Rate Trends (2025)
Maximize your bookings by understanding the Offingawier STR occupancy trends. Seasonal demand shifts significantly influence how often properties are booked. Typically, Augustsees the highest demand (peak season occupancy), while February experiences the lowest (low season). Effective strategies, like adjusting minimum stays or offering promotions, can boost occupancy during slower periods. Here's how different property tiers perform in Offingawier:
- Best-in-class properties (Top 10%) achieve 55%+ occupancy, indicating high desirability and potentially optimized availability.
- Strong performing properties (Top 25%) maintain 41% or higher occupancy, suggesting good market fit and guest satisfaction.
- Typical properties (Median) have an occupancy rate around 25%.
- Entry-level properties (Bottom 25%) average 13% occupancy, potentially facing higher vacancy.
Average Monthly Occupancy Rate Trend in Offingawier
Average Daily Rate (ADR) Airbnb Trends in Offingawier (2025)
Effective short term rental pricing strategy in Offingawier involves understanding monthly ADR fluctuations. The Average Daily Rate (ADR) for Airbnb in Offingawier typically peaks in August and dips lowest during March. Leveraging Airbnb dynamic pricing tools or strategies based on this seasonality can significantly boost revenue. Here's a look at the typical nightly rates achieved:
- Best-in-class properties (Top 10%) command rates of $394+ per night, often due to premium features or locations.
- Strong performing properties (Top 25%) achieve nightly rates of $276 or more.
- Typical properties (Median) charge around $194 per night.
- Entry-level properties (Bottom 25%) earn around $135 per night.
Average Daily Rate (ADR) Trend by Month in Offingawier
Get Live Offingawier Market Intelligence 👇

Explore Real-time Analytics
Airbnb Seasonality Analysis & Trends in Offingawier (2025)
Peak Season (June, April, May)
- Revenue averages $4,103 per month
- Occupancy rates average 39.0%
- Daily rates average $230
Shoulder Season
- Revenue averages $2,158 per month
- Occupancy maintains around 34.3%
- Daily rates hold near $233
Low Season (January, February, March)
- Revenue drops to average $590 per month
- Occupancy decreases to average 11.5%
- Daily rates adjust to average $197
Seasonality Insights for Offingawier
- The Airbnb seasonality in Offingawier shows highly seasonal trends requiring careful strategy. While the sections above show seasonal averages, it's also insightful to look at the extremes:
- During the high season, the absolute peak month showcases Offingawier's highest earning potential, with monthly revenues capable of climbing to $4,230, occupancy reaching a high of 54.1%, and ADRs peaking at $267.
- Conversely, the slowest single month of the year, typically falling within the low season, marks the market's lowest point. In this month, revenue might dip to $294, occupancy could drop to 10.0%, and ADRs may adjust down to $196.
- Understanding both the seasonal averages and these monthly peaks and troughs in revenue, occupancy, and ADR is crucial for maximizing your Airbnb profit potential in Offingawier.
Seasonal Strategies for Maximizing Profit
- Peak Season: Maximize revenue through premium pricing and potentially longer minimum stays. Ensure high availability.
- Low Season: Offer competitive pricing, special promotions (e.g., extended stay discounts), and flexible cancellation policies. Target off-season travelers like remote workers or budget-conscious guests.
- Shoulder Seasons: Implement dynamic pricing that balances peak and low rates. Target weekend travelers or specific events. Offer slightly more flexible terms than peak season.
- Regularly analyze your own performance against these Offingawier seasonality benchmarks and adjust your pricing and availability strategy accordingly.
Best Areas for Airbnb Investment in Offingawier (2025)
Exploring the top neighborhoods for short-term rentals in Offingawier? This section highlights key areas, outlining why they are attractive for hosts and guests, along with notable local attractions. Consider these locations based on your target guest profile and investment strategy.
| Neighborhood / Area | Why Host Here? (Target Guests & Appeal) | Key Attractions & Landmarks |
|---|---|---|
| Friesland Waterland | A picturesque area known for its lakes and waterways, perfect for water sports and relaxation. Attracts families and nature enthusiasts looking for a peaceful getaway. | Sneekermeer, Slotermeer, Alde Feanen National Park, Water sports activities, Cycling routes |
| Leeuwarden | The vibrant capital of Friesland with a rich cultural heritage, museums, and a lively dining scene. Ideal for tourists exploring the history and art of the region. | Fries Museum, Oldehove Tower, Blokhuispoort, De Oldehove, Historical walking tours |
| Terschelling | A beautiful island known for its stunning beaches and nature reserves, appealing to eco-tourists and beach lovers. Offers a unique island experience. | Boschplaat nature reserve, Zanddijk, Oerol Festival, Beaches, Biking and hiking trails |
| Ameland | Another idyllic Frisian island famous for its natural beauty and tranquility. Perfect for those seeking a serene holiday experience by the sea. | Ameland beach, Wadden Sea UNESCO World Heritage site, Nature center, Biking routes, Breathtaking sunsets |
| Harlingen | A charming harbor town with maritime history and culture, attractive for both seaside tourists and those exploring the Frisian landscape. | Harlingen harbor, Frisian sea museum, Beach, Watersport activities, Cycle routes |
| Dokkum | A historic town with Old Dutch charm, famous for its canals and fortifications. Great for guests interested in Dutch history and local culture. | Dokkum canals, Historic buildings, Northern Frisia, Biking paths, Annual events |
| Schiermonnikoog | A small, tranquil island known for its natural parks and wildlife, appealing to nature lovers and those looking for peace and solitude. | National Park Schiermonnikoog, Beaches, Bird watching, Nature trails, Secluded spots |
| Joure | A town with a strong woodworking and dairy tradition, offering a mix of culture, history, and nature, appealing to those interested in authentic rural experiences. | Museum Joure, Historical buildings, Nature routes, Cultural events, Local markets |
Understanding Airbnb License Requirements & STR Laws in Offingawier (2025)
While Offingawier, Frisia, Netherlands currently shows low STR regulations, specific Airbnb license requirements might still exist or change. Always verify the latest short term rental regulations and Airbnb license requirements directly with local government authorities for Offingawier to ensure full compliance before hosting.
(Source: AirROI data, 2025, finding no licensed listings among those analyzed)
Top Performing Airbnb Properties in Offingawier (2025)
Benchmark your potential! Explore examples of top-performing Airbnb properties in Offingawierbased on Trailing Twelve Month (TTM) revenue. Analyze their characteristics, revenue, occupancy rate, and ADR to understand what drives success in this market.

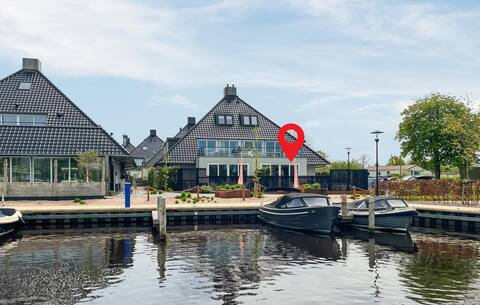
Spacious holiday home with harbor view
Entire Place • 4 bedrooms
SneekermeerZicht 8-7
Entire Place • 3 bedrooms
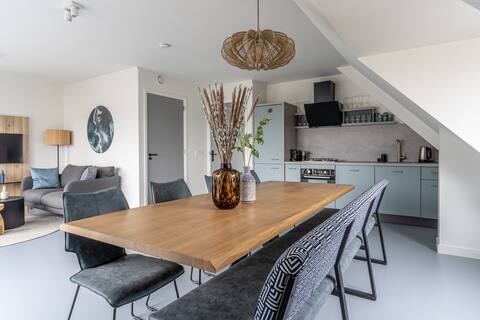
4 bedroom awesome apartment in Offingawier
Entire Place • 4 bedrooms
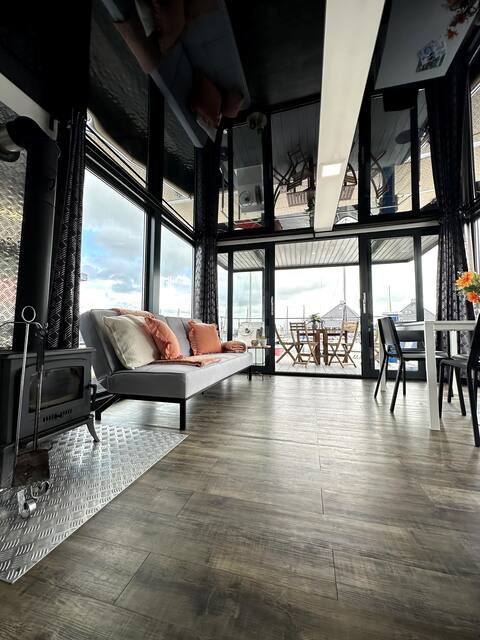
Houseboat orange Sneekermeer
Entire Place • 1 bedroom
SneekermeerZicht 8-6
Entire Place • 2 bedrooms
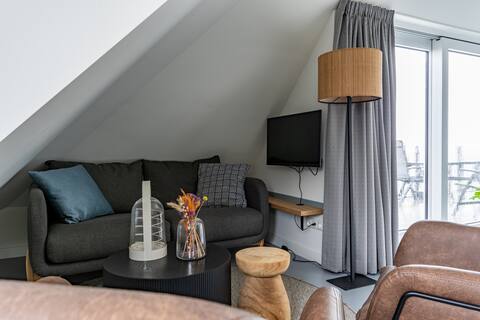
Holiday apartment with garden on Lake Sneeker
Entire Place • 2 bedrooms
Note: Performance varies based on location, size, amenities, seasonality, and management quality. Data reflects the past 12 months.
Top Performing Airbnb Hosts in Offingawier (2025)
Learn from the best! This table showcases top-performing Airbnb hosts in Offingawier based on the number of properties managed and estimated total revenue over the past year. Analyze their scale and performance metrics.
| Host Name | Properties | Grossing Revenue | Stay Reviews | Avg Rating |
|---|---|---|---|---|
| Maarten | 6 | $109,564 | 28 | 3.83/5.0 |
| Tamara - BELVILLA | 3 | $58,684 | 9 | 2.78/5.0 |
| Tim Golden Stay Com | 3 | $47,955 | 11 | 2.89/5.0 |
| Host #153915616 | 1 | $41,166 | 0 | 0.00/5.0 |
| Egbert | 2 | $37,780 | 73 | 4.53/5.0 |
| Familie | 1 | $26,218 | 12 | 4.75/5.0 |
| Brechje | 1 | $25,886 | 8 | 4.75/5.0 |
| Sjoerd-Jan | 1 | $25,676 | 41 | 4.68/5.0 |
| Marijke | 1 | $23,467 | 74 | 4.86/5.0 |
| Jan-Warner | 1 | $20,686 | 63 | 4.81/5.0 |
Analyzing the strategies of top hosts, such as their property selection, pricing, and guest communication, can offer valuable lessons for optimizing your own Airbnb operations in Offingawier.
Dive Deeper: Advanced Offingawier STR Market Data (2025)
Ready to unlock more insights? AirROI provides access to advanced metrics and comprehensive Airbnb data for Offingawier. Explore detailed analytics beyond this report to refine your investment strategy, optimize pricing, and maximize your vacation rental profits.
Explore Advanced MetricsOffingawier Short-Term Rental Market Composition (2025): Property & Room Types
Room Type Distribution
Property Type Distribution
Market Composition Insights for Offingawier
- The Offingawier Airbnb market composition is heavily skewed towards Entire Home/Apt listings, which make up 96.6% of the 29 active rentals. This indicates strong guest preference for privacy and space.
- Looking at the property type distribution in Offingawier, Apartment/Condo properties are the most common (55.2%), reflecting the local real estate landscape.
Offingawier Airbnb Room Capacity Analysis (2025): Bedroom Distribution
Distribution of Listings by Number of Bedrooms
Room Capacity Insights for Offingawier
- The dominant room capacity in Offingawier is 1 bedroom listings, making up 44.8% of the market. This suggests a strong demand for properties suitable for couples or solo travelers.
- Together, 1 bedroom and 2 bedrooms properties represent 68.9% of the active Airbnb listings in Offingawier, indicating a high concentration in these sizes.
- A significant 27.5% of listings offer 3+ bedrooms, catering to larger groups and families seeking more space in Offingawier.
Offingawier Vacation Rental Guest Capacity Trends (2025)
Distribution of Listings by Guest Capacity
Guest Capacity Insights for Offingawier
- The most common guest capacity trend in Offingawier vacation rentals is listings accommodating 4 guests (31%). This suggests the primary traveler segment is likely small families or groups.
- Properties designed for 4 guests and 2 guests dominate the Offingawier STR market, accounting for 55.1% of listings.
- 27.6% of properties accommodate 6+ guests, serving the market segment for larger families or group travel in Offingawier.
- On average, properties in Offingawier are equipped to host 4.4 guests.
Offingawier Airbnb Booking Patterns (2025): Available vs. Booked Days
Available Days Distribution
Booked Days Distribution
Booking Pattern Insights for Offingawier
- The most common availability pattern in Offingawier falls within the 271-366 days range, representing 58.6% of listings. This suggests many properties have significant open periods on their calendars.
- Approximately 93.1% of listings show high availability (181+ days open annually), indicating potential for increased bookings or specific owner usage patterns.
- For booked days, the 91-180 days range is most frequent in Offingawier (37.9%), reflecting common guest stay durations or potential owner blocking patterns.
- A notable 10.3% of properties secure long booking periods (181+ days booked per year), highlighting successful long-term rental strategies or significant owner usage.
Offingawier Airbnb Minimum Stay Requirements Analysis
Distribution of Listings by Minimum Night Requirement
1 Night
7 listings
25.9% of total
2 Nights
9 listings
33.3% of total
3 Nights
9 listings
33.3% of total
7-29 Nights
1 listings
3.7% of total
30+ Nights
1 listings
3.7% of total
Key Insights
- The most prevalent minimum stay requirement in Offingawier is 2 Nights, adopted by 33.3% of listings. This highlights the market's preference for shorter, flexible bookings.
Recommendations
- Align with the market by considering a 2 Nights minimum stay, as 33.3% of Offingawier hosts use this setting.
- If feasible, allowing 1-night stays, especially midweek or during low season, could capture last-minute bookings, as only 25.9% currently do.
- Adjust minimum nights based on seasonality – potentially shorter during low season and longer during peak demand periods in Offingawier.
Offingawier Airbnb Cancellation Policy Trends Analysis (2025)
Flexible
4 listings
21.1% of total
Moderate
3 listings
15.8% of total
Firm
3 listings
15.8% of total
Strict
9 listings
47.4% of total
Cancellation Policy Insights for Offingawier
- The prevailing Airbnb cancellation policy trend in Offingawier is Strict, used by 47.4% of listings.
- A majority (63.2%) of hosts in Offingawier utilize Firm or Strict policies, indicating a market where hosts prioritize booking security.
Recommendations for Hosts
- Consider adopting a Strict policy to align with the 47.4% market standard in Offingawier.
- With 47.4% using Strict terms, this is a viable option in Offingawier, particularly for high-value properties or during peak demand periods.
- Regularly review your cancellation policy against competitors and market demand shifts in Offingawier.
Offingawier STR Booking Lead Time Analysis (2025)
Average Booking Lead Time by Month
Booking Lead Time Insights for Offingawier
- The overall average booking lead time for vacation rentals in Offingawier is 45 days.
- Guests book furthest in advance for stays during June (average 123 days), likely coinciding with peak travel demand or local events.
- The shortest booking windows occur for stays in February (average 17 days), indicating more last-minute travel plans during this time.
- Seasonally, Summer (108 days avg.) sees the longest lead times, while Winter (30 days avg.) has the shortest, reflecting typical travel planning cycles.
Recommendations for Hosts
- Use the overall average lead time (45 days) as a baseline for your pricing and availability strategy in Offingawier.
- For June stays, consider implementing length-of-stay discounts or slightly higher rates for bookings made less than 123 days out to capitalize on advance planning.
- Target marketing efforts for the Summer season well in advance (at least 108 days) to capture early planners.
- Monitor your own booking lead times against these Offingawier averages to identify opportunities for dynamic pricing adjustments.
Popular & Essential Airbnb Amenities in Offingawier (2025)
Amenity Prevalence
Amenity Insights for Offingawier
- Essential amenities in Offingawier that guests expect include: Kitchen, Heating, Smoke alarm. Lacking these (any) could significantly impact bookings.
- Popular amenities like Wifi, TV, Essentials are common but not universal. Offering these can provide a competitive edge.
- Warning: Wifi is not universally provided but is considered essential globally. Ensure reliable Wifi is offered.
Recommendations for Hosts
- Ensure your listing includes all essential amenities for Offingawier: Kitchen, Heating, Smoke alarm.
- Prioritize adding missing essentials: Heating, Smoke alarm.
- Consider adding popular differentiators like Wifi or TV to increase appeal.
- Highlight unique or less common amenities you offer (e.g., hot tub, dedicated workspace, EV charger) in your listing description and photos.
- Regularly check competitor amenities in Offingawier to stay competitive.
Offingawier Airbnb Guest Demographics & Profile Analysis (2025)
Guest Profile Summary for Offingawier
- The typical guest profile for Airbnb in Offingawier consists of a mix of domestic (39%) and international guests, with top international origins including Netherlands, typically belonging to the Post-2000s (Gen Z/Alpha) group (50%), primarily speaking English or German.
- Domestic travelers account for 39.1% of guests.
- Key international markets include Germany (44.6%) and Netherlands (39.1%).
- Top languages spoken are English (40%) followed by German (29.2%).
- A significant demographic segment is the Post-2000s (Gen Z/Alpha) group, representing 50% of guests.
Recommendations for Hosts
- Focus marketing internationally, particularly towards travelers from Netherlands.
- Tailor amenities and listing descriptions to appeal to the dominant Post-2000s (Gen Z/Alpha) demographic (e.g., highlight fast WiFi, smart home features, local guides).
- Highlight unique local experiences or amenities relevant to the primary guest profile.
- Consider seasonal promotions aligned with peak travel times for key origin markets.
Nearby Short-Term Rental Market Comparison
How does the Offingawier Airbnb market stack up against its neighbors? Compare key performance metrics like average monthly revenue, ADR, and occupancy rates in surrounding areas to understand the broader regional STR landscape.
| Market | Active Properties | Monthly Revenue | Daily Rate | Avg. Occupancy |
|---|---|---|---|---|
| Kockengen | 12 | $7,560 | $396.31 | 61% |
| Bentveld | 13 | $4,798 | $443.61 | 54% |
| Halfweg | 17 | $4,307 | $231.13 | 55% |
| Aerdenhout | 17 | $4,288 | $694.02 | 53% |
| Oud Ade | 17 | $3,779 | $277.47 | 51% |
| Rijs | 27 | $3,772 | $356.97 | 45% |
| Zwanenburg | 24 | $3,720 | $240.77 | 66% |
| Kortenhoef | 15 | $3,495 | $255.48 | 53% |
| Ouderkerk aan de Amstel | 28 | $3,433 | $231.63 | 57% |
| Amsterdam | 4,967 | $3,368 | $295.90 | 52% |