Midsland Airbnb Market Analysis 2025: Short Term Rental Data & Vacation Rental Statistics in Frisia, Netherlands
Is Airbnb profitable in Midsland in 2025? Explore comprehensive Airbnb analytics for Midsland, Frisia, Netherlands to uncover income potential. This 2025 STR market report for Midsland, based on AirROI data from April 2024 to March 2025, reveals key trends in the niche market of 35 active listings.
Whether you're considering an Airbnb investment in Midsland, optimizing your existing vacation rental, or exploring rental arbitrage opportunities, understanding the Midsland Airbnb data is crucial. Leveraging the low regulation environment is key to maximizing your short term rental income potential. Let's dive into the specifics.
Key Midsland Airbnb Performance Metrics Overview
Monthly Airbnb Revenue Variations & Income Potential in Midsland (2025)
Understanding the monthly revenue variations for Airbnb listings in Midsland is key to maximizing your short term rental income potential. Seasonality significantly impacts earnings. Our analysis, based on data from the past 12 months, shows that the peak revenue month for STRs in Midsland is typically August, while January often presents the lowest earnings, highlighting opportunities for strategic pricing adjustments during shoulder and low seasons. Explore the typical Airbnb income in Midsland across different performance tiers:
- Best-in-class properties (Top 10%) achieve $4,933+ monthly, often utilizing dynamic pricing and superior guest experiences.
- Strong performing properties (Top 25%) earn $3,657 or more, indicating effective management and desirable locations/amenities.
- Typical properties (Median) generate around $2,595 per month, representing the average market performance.
- Entry-level properties (Bottom 25%) see earnings around $1,587, often with potential for optimization.
Average Monthly Airbnb Earnings Trend in Midsland
Midsland Airbnb Occupancy Rate Trends (2025)
Maximize your bookings by understanding the Midsland STR occupancy trends. Seasonal demand shifts significantly influence how often properties are booked. Typically, Augustsees the highest demand (peak season occupancy), while March experiences the lowest (low season). Effective strategies, like adjusting minimum stays or offering promotions, can boost occupancy during slower periods. Here's how different property tiers perform in Midsland:
- Best-in-class properties (Top 10%) achieve 88%+ occupancy, indicating high desirability and potentially optimized availability.
- Strong performing properties (Top 25%) maintain 77% or higher occupancy, suggesting good market fit and guest satisfaction.
- Typical properties (Median) have an occupancy rate around 59%.
- Entry-level properties (Bottom 25%) average 36% occupancy, potentially facing higher vacancy.
Average Monthly Occupancy Rate Trend in Midsland
Average Daily Rate (ADR) Airbnb Trends in Midsland (2025)
Effective short term rental pricing strategy in Midsland involves understanding monthly ADR fluctuations. The Average Daily Rate (ADR) for Airbnb in Midsland typically peaks in August and dips lowest during January. Leveraging Airbnb dynamic pricing tools or strategies based on this seasonality can significantly boost revenue. Here's a look at the typical nightly rates achieved:
- Best-in-class properties (Top 10%) command rates of $204+ per night, often due to premium features or locations.
- Strong performing properties (Top 25%) achieve nightly rates of $175 or more.
- Typical properties (Median) charge around $139 per night.
- Entry-level properties (Bottom 25%) earn around $112 per night.
Average Daily Rate (ADR) Trend by Month in Midsland
Get Live Midsland Market Intelligence 👇

Explore Real-time Analytics
Airbnb Seasonality Analysis & Trends in Midsland (2025)
Peak Season (August, July, June)
- Revenue averages $3,852 per month
- Occupancy rates average 71.8%
- Daily rates average $159
Shoulder Season
- Revenue averages $2,691 per month
- Occupancy maintains around 57.4%
- Daily rates hold near $148
Low Season (January, February, March)
- Revenue drops to average $1,713 per month
- Occupancy decreases to average 39.1%
- Daily rates adjust to average $141
Seasonality Insights for Midsland
- The Airbnb seasonality in Midsland shows highly seasonal trends requiring careful strategy. While the sections above show seasonal averages, it's also insightful to look at the extremes:
- During the high season, the absolute peak month showcases Midsland's highest earning potential, with monthly revenues capable of climbing to $4,309, occupancy reaching a high of 81.5%, and ADRs peaking at $160.
- Conversely, the slowest single month of the year, typically falling within the low season, marks the market's lowest point. In this month, revenue might dip to $1,614, occupancy could drop to 36.6%, and ADRs may adjust down to $138.
- Understanding both the seasonal averages and these monthly peaks and troughs in revenue, occupancy, and ADR is crucial for maximizing your Airbnb profit potential in Midsland.
Seasonal Strategies for Maximizing Profit
- Peak Season: Maximize revenue through premium pricing and potentially longer minimum stays. Ensure high availability.
- Low Season: Offer competitive pricing, special promotions (e.g., extended stay discounts), and flexible cancellation policies. Target off-season travelers like remote workers or budget-conscious guests.
- Shoulder Seasons: Implement dynamic pricing that balances peak and low rates. Target weekend travelers or specific events. Offer slightly more flexible terms than peak season.
- Regularly analyze your own performance against these Midsland seasonality benchmarks and adjust your pricing and availability strategy accordingly.
Best Areas for Airbnb Investment in Midsland (2025)
Exploring the top neighborhoods for short-term rentals in Midsland? This section highlights key areas, outlining why they are attractive for hosts and guests, along with notable local attractions. Consider these locations based on your target guest profile and investment strategy.
| Neighborhood / Area | Why Host Here? (Target Guests & Appeal) | Key Attractions & Landmarks |
|---|---|---|
| Midsland Village | The charming heart of Terschelling, known for its picturesque streets and proximity to natural parks, making it appealing to tourists seeking a tranquil getaway. | Borkum ferry terminal, Brandaris Lighthouse, Terschelling nature park, Wagejot beach, Nature Museum Terschelling |
| West Terschelling | A lively harbor town with a maritime atmosphere, offering easy access to the beach and various cycling routes which attract both families and nature enthusiasts. | Sailing trips, Terschelling Maritime Museum, De Walvisvaarders, Strandpaviljoen de Walvis, Lighthouse of Terschelling |
| Oerol Festival Area | Home to the famous Oerol Festival, which attracts thousands of visitors for its cultural events, making it a hotspot for short-term rentals during the festival season. | Oerol Festival, Theater performances, Outdoor art installations, Music stages, Local markets |
| Boschplaat Nature Reserve | A stunning nature area perfect for eco-tourists and bird watchers, providing a peaceful retreat for guests looking to connect with nature. | Birdwatching, Hiking trails, Natural biodiversity, Mudflat hiking, Scenic views |
| Midsland Noord | A quiet neighborhood close to the beach and surrounded by nature, ideal for families and those seeking relaxation away from the crowds. | Midsland beach, Nature trails, Local cafes, Cycling routes, Dunes |
| Terschelling National Park | A protected area that attracts outdoor enthusiasts and offers unique ecological experiences, perfect for those looking to immerse in nature. | Nature excursions, Guided walks, Unique wildlife, Port of Oerol, Biking paths |
| Oerol Festival Infrastructure | Key logistics for accessing the Oerol Festival events; this area is very sought after during the festival timeframe for Airbnb rentals. | Festival locations, Camping areas, Concession booths, Art displays, Cultural workshops |
| Scherpenhof | A small seaside area close to Midsland, known for its tranquillity and beautiful landscapes, often frequented by tourists for weekend getaways. | Beach access, Vibrant sunsets, Scenic views, Quiet walks, Local dining options |
Understanding Airbnb License Requirements & STR Laws in Midsland (2025)
While Midsland, Frisia, Netherlands currently shows low STR regulations, specific Airbnb license requirements might still exist or change. Always verify the latest short term rental regulations and Airbnb license requirements directly with local government authorities for Midsland to ensure full compliance before hosting.
(Source: AirROI data, 2025, finding no licensed listings among those analyzed)
Top Performing Airbnb Properties in Midsland (2025)
Benchmark your potential! Explore examples of top-performing Airbnb properties in Midslandbased on Trailing Twelve Month (TTM) revenue. Analyze their characteristics, revenue, occupancy rate, and ADR to understand what drives success in this market.
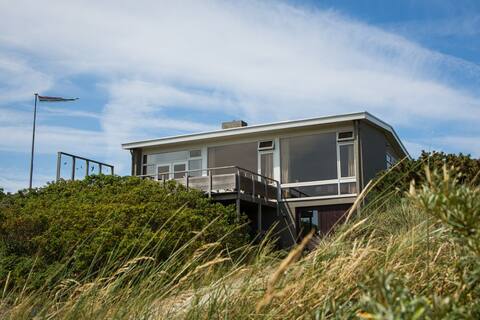
Duinbungalow Tergare
Entire Place • 2 bedrooms
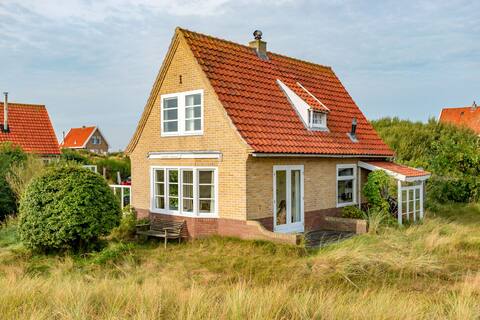
Detached holiday home within walking distance of the sea
Entire Place • 4 bedrooms

Artsy front house with terrace
Entire Place • 2 bedrooms

Wonderful and cozy cottage, close to the beach
Entire Place • 2 bedrooms
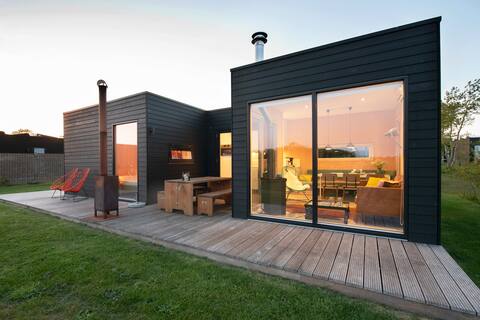
Design summer home on the island of Terschelling
Entire Place • 2 bedrooms
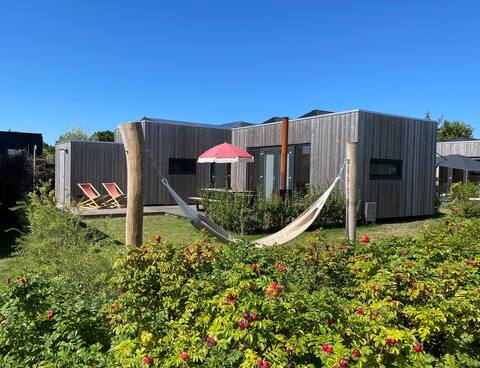
WAD NOU Terschelling wonderfully sustainable chalet!
Entire Place • 2 bedrooms
Note: Performance varies based on location, size, amenities, seasonality, and management quality. Data reflects the past 12 months.
Top Performing Airbnb Hosts in Midsland (2025)
Learn from the best! This table showcases top-performing Airbnb hosts in Midsland based on the number of properties managed and estimated total revenue over the past year. Analyze their scale and performance metrics.
| Host Name | Properties | Grossing Revenue | Stay Reviews | Avg Rating |
|---|---|---|---|---|
| Jacob En Fettsje | 4 | $108,378 | 325 | 4.76/5.0 |
| Kitty | 2 | $74,663 | 346 | 4.72/5.0 |
| Wietse En Nicole | 2 | $68,400 | 553 | 4.67/5.0 |
| Hans | 1 | $56,514 | 5 | 4.80/5.0 |
| Stan | 1 | $51,839 | 35 | 4.66/5.0 |
| Loes | 1 | $50,304 | 92 | 4.88/5.0 |
| Franny | 1 | $43,043 | 58 | 4.81/5.0 |
| Bungalow | 3 | $42,474 | 5 | 1.56/5.0 |
| Wesley | 1 | $42,170 | 51 | 4.90/5.0 |
| Lara | 1 | $41,312 | 29 | 4.69/5.0 |
Analyzing the strategies of top hosts, such as their property selection, pricing, and guest communication, can offer valuable lessons for optimizing your own Airbnb operations in Midsland.
Dive Deeper: Advanced Midsland STR Market Data (2025)
Ready to unlock more insights? AirROI provides access to advanced metrics and comprehensive Airbnb data for Midsland. Explore detailed analytics beyond this report to refine your investment strategy, optimize pricing, and maximize your vacation rental profits.
Explore Advanced MetricsMidsland Short-Term Rental Market Composition (2025): Property & Room Types
Room Type Distribution
Property Type Distribution
Market Composition Insights for Midsland
- The Midsland Airbnb market composition is heavily skewed towards Entire Home/Apt listings, which make up 100% of the 35 active rentals. This indicates strong guest preference for privacy and space.
- Looking at the property type distribution in Midsland, House properties are the most common (80%), reflecting the local real estate landscape.
- Houses represent a significant 80% portion, catering likely to families or larger groups.
- Smaller segments like hotel/boutique (combined 2.9%) offer potential for unique stay experiences.
Midsland Airbnb Room Capacity Analysis (2025): Bedroom Distribution
Distribution of Listings by Number of Bedrooms
Room Capacity Insights for Midsland
- The dominant room capacity in Midsland is 2 bedrooms listings, making up 65.7% of the market. This suggests a strong demand for properties suitable for couples or solo travelers.
- Together, 2 bedrooms and 3 bedrooms properties represent 82.8% of the active Airbnb listings in Midsland, indicating a high concentration in these sizes.
- A significant 22.8% of listings offer 3+ bedrooms, catering to larger groups and families seeking more space in Midsland.
Midsland Vacation Rental Guest Capacity Trends (2025)
Distribution of Listings by Guest Capacity
Guest Capacity Insights for Midsland
- The most common guest capacity trend in Midsland vacation rentals is listings accommodating 4 guests (45.7%). This suggests the primary traveler segment is likely small families or groups.
- Properties designed for 4 guests and 5 guests dominate the Midsland STR market, accounting for 65.7% of listings.
- 17.2% of properties accommodate 6+ guests, serving the market segment for larger families or group travel in Midsland.
- On average, properties in Midsland are equipped to host 4.3 guests.
Midsland Airbnb Booking Patterns (2025): Available vs. Booked Days
Available Days Distribution
Booked Days Distribution
Booking Pattern Insights for Midsland
- The most common availability pattern in Midsland falls within the 91-180 days range, representing 31.4% of listings. This suggests many properties have significant open periods on their calendars.
- Approximately 48.5% of listings show high availability (181+ days open annually), indicating potential for increased bookings or specific owner usage patterns.
- For booked days, the 181-270 days range is most frequent in Midsland (31.4%), reflecting common guest stay durations or potential owner blocking patterns.
- A notable 54.3% of properties secure long booking periods (181+ days booked per year), highlighting successful long-term rental strategies or significant owner usage.
Midsland Airbnb Minimum Stay Requirements Analysis
Distribution of Listings by Minimum Night Requirement
2 Nights
12 listings
34.3% of total
3 Nights
17 listings
48.6% of total
4-6 Nights
2 listings
5.7% of total
7-29 Nights
1 listings
2.9% of total
30+ Nights
3 listings
8.6% of total
Key Insights
- The most prevalent minimum stay requirement in Midsland is 3 Nights, adopted by 48.6% of listings. This highlights the market's preference for longer commitments.
Recommendations
- Align with the market by considering a 3 Nights minimum stay, as 48.6% of Midsland hosts use this setting.
- A 2-night minimum appears standard (34.3%). Consider this for weekends or peak periods.
- Explore offering discounts for stays of 30+ nights to attract the 8.6% of the market seeking extended stays.
- Adjust minimum nights based on seasonality – potentially shorter during low season and longer during peak demand periods in Midsland.
Midsland Airbnb Cancellation Policy Trends Analysis (2025)
Super Strict 30 Days
1 listings
3.1% of total
Moderate
7 listings
21.9% of total
Firm
2 listings
6.3% of total
Strict
22 listings
68.8% of total
Cancellation Policy Insights for Midsland
- The prevailing Airbnb cancellation policy trend in Midsland is Strict, used by 68.8% of listings.
- A majority (75.1%) of hosts in Midsland utilize Firm or Strict policies, indicating a market where hosts prioritize booking security.
Recommendations for Hosts
- Consider adopting a Strict policy to align with the 68.8% market standard in Midsland.
- With 68.8% using Strict terms, this is a viable option in Midsland, particularly for high-value properties or during peak demand periods.
- Regularly review your cancellation policy against competitors and market demand shifts in Midsland.
Midsland STR Booking Lead Time Analysis (2025)
Average Booking Lead Time by Month
Booking Lead Time Insights for Midsland
- The overall average booking lead time for vacation rentals in Midsland is 85 days.
- Guests book furthest in advance for stays during August (average 145 days), likely coinciding with peak travel demand or local events.
- The shortest booking windows occur for stays in February (average 45 days), indicating more last-minute travel plans during this time.
- Seasonally, Summer (142 days avg.) sees the longest lead times, while Winter (64 days avg.) has the shortest, reflecting typical travel planning cycles.
Recommendations for Hosts
- Use the overall average lead time (85 days) as a baseline for your pricing and availability strategy in Midsland.
- For August stays, consider implementing length-of-stay discounts or slightly higher rates for bookings made less than 145 days out to capitalize on advance planning.
- Target marketing efforts for the Summer season well in advance (at least 142 days) to capture early planners.
- Monitor your own booking lead times against these Midsland averages to identify opportunities for dynamic pricing adjustments.
Popular & Essential Airbnb Amenities in Midsland (2025)
Amenity Prevalence
Amenity Insights for Midsland
- Essential amenities in Midsland that guests expect include: Kitchen, Wifi, Free parking on premises, Heating, TV. Lacking these (any) could significantly impact bookings.
- Popular amenities like Coffee maker, Hot water, Backyard are common but not universal. Offering these can provide a competitive edge.
Recommendations for Hosts
- Ensure your listing includes all essential amenities for Midsland: Kitchen, Wifi, Free parking on premises, Heating, TV.
- Prioritize adding missing essentials: Heating, TV.
- Consider adding popular differentiators like Coffee maker or Hot water to increase appeal.
- Highlight unique or less common amenities you offer (e.g., hot tub, dedicated workspace, EV charger) in your listing description and photos.
- Regularly check competitor amenities in Midsland to stay competitive.
Midsland Airbnb Guest Demographics & Profile Analysis (2025)
Guest Profile Summary for Midsland
- The typical guest profile for Airbnb in Midsland consists of primarily domestic travelers (78%), often arriving from nearby Utrecht, typically belonging to the Post-2000s (Gen Z/Alpha) group (50%), primarily speaking English or Dutch.
- Domestic travelers account for 78.3% of guests.
- Key international markets include Netherlands (78.3%) and Germany (12.1%).
- Top languages spoken are English (35.6%) followed by Dutch (28.2%).
- A significant demographic segment is the Post-2000s (Gen Z/Alpha) group, representing 50% of guests.
Recommendations for Hosts
- Target domestic marketing efforts towards travelers from Utrecht and Amsterdam.
- Tailor amenities and listing descriptions to appeal to the dominant Post-2000s (Gen Z/Alpha) demographic (e.g., highlight fast WiFi, smart home features, local guides).
- Highlight unique local experiences or amenities relevant to the primary guest profile.
- Consider seasonal promotions aligned with peak travel times for key origin markets.
Nearby Short-Term Rental Market Comparison
How does the Midsland Airbnb market stack up against its neighbors? Compare key performance metrics like average monthly revenue, ADR, and occupancy rates in surrounding areas to understand the broader regional STR landscape.
| Market | Active Properties | Monthly Revenue | Daily Rate | Avg. Occupancy |
|---|---|---|---|---|
| Kockengen | 12 | $7,560 | $396.31 | 61% |
| Bentveld | 13 | $4,798 | $443.61 | 54% |
| Halfweg | 17 | $4,307 | $231.13 | 55% |
| Aerdenhout | 17 | $4,288 | $694.02 | 53% |
| Oud Ade | 17 | $3,779 | $277.47 | 51% |
| Rijs | 27 | $3,772 | $356.97 | 45% |
| Zwanenburg | 24 | $3,720 | $240.77 | 66% |
| Kortenhoef | 15 | $3,495 | $255.48 | 53% |
| Ouderkerk aan de Amstel | 28 | $3,433 | $231.63 | 57% |
| Amsterdam | 4,967 | $3,368 | $295.90 | 52% |