Harlingen Airbnb Market Analysis 2025: Short Term Rental Data & Vacation Rental Statistics in Frisia, Netherlands
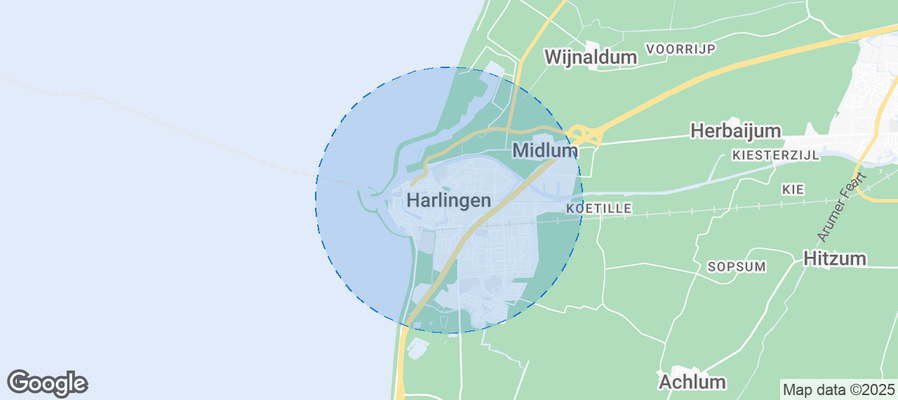
Is Airbnb profitable in Harlingen in 2025? Explore comprehensive Airbnb analytics for Harlingen, Frisia, Netherlands to uncover income potential. This 2025 STR market report for Harlingen, based on AirROI data from April 2024 to March 2025, reveals key trends in the niche market of 34 active listings.
Whether you're considering an Airbnb investment in Harlingen, optimizing your existing vacation rental, or exploring rental arbitrage opportunities, understanding the Harlingen Airbnb data is crucial. Leveraging the low regulation environment is key to maximizing your short term rental income potential. Let's dive into the specifics.
Key Harlingen Airbnb Performance Metrics Overview
Monthly Airbnb Revenue Variations & Income Potential in Harlingen (2025)
Understanding the monthly revenue variations for Airbnb listings in Harlingen is key to maximizing your short term rental income potential. Seasonality significantly impacts earnings. Our analysis, based on data from the past 12 months, shows that the peak revenue month for STRs in Harlingen is typically July, while January often presents the lowest earnings, highlighting opportunities for strategic pricing adjustments during shoulder and low seasons. Explore the typical Airbnb income in Harlingen across different performance tiers:
- Best-in-class properties (Top 10%) achieve $3,781+ monthly, often utilizing dynamic pricing and superior guest experiences.
- Strong performing properties (Top 25%) earn $2,634 or more, indicating effective management and desirable locations/amenities.
- Typical properties (Median) generate around $1,611 per month, representing the average market performance.
- Entry-level properties (Bottom 25%) see earnings around $1,089, often with potential for optimization.
Average Monthly Airbnb Earnings Trend in Harlingen
Harlingen Airbnb Occupancy Rate Trends (2025)
Maximize your bookings by understanding the Harlingen STR occupancy trends. Seasonal demand shifts significantly influence how often properties are booked. Typically, Augustsees the highest demand (peak season occupancy), while January experiences the lowest (low season). Effective strategies, like adjusting minimum stays or offering promotions, can boost occupancy during slower periods. Here's how different property tiers perform in Harlingen:
- Best-in-class properties (Top 10%) achieve 78%+ occupancy, indicating high desirability and potentially optimized availability.
- Strong performing properties (Top 25%) maintain 68% or higher occupancy, suggesting good market fit and guest satisfaction.
- Typical properties (Median) have an occupancy rate around 48%.
- Entry-level properties (Bottom 25%) average 35% occupancy, potentially facing higher vacancy.
Average Monthly Occupancy Rate Trend in Harlingen
Average Daily Rate (ADR) Airbnb Trends in Harlingen (2025)
Effective short term rental pricing strategy in Harlingen involves understanding monthly ADR fluctuations. The Average Daily Rate (ADR) for Airbnb in Harlingen typically peaks in October and dips lowest during February. Leveraging Airbnb dynamic pricing tools or strategies based on this seasonality can significantly boost revenue. Here's a look at the typical nightly rates achieved:
- Best-in-class properties (Top 10%) command rates of $349+ per night, often due to premium features or locations.
- Strong performing properties (Top 25%) achieve nightly rates of $140 or more.
- Typical properties (Median) charge around $107 per night.
- Entry-level properties (Bottom 25%) earn around $78 per night.
Average Daily Rate (ADR) Trend by Month in Harlingen
Get Live Harlingen Market Intelligence 👇
Explore Real-time Analytics
Airbnb Seasonality Analysis & Trends in Harlingen (2025)
Peak Season (July, August, June)
- Revenue averages $3,205 per month
- Occupancy rates average 76.3%
- Daily rates average $203
Shoulder Season
- Revenue averages $2,010 per month
- Occupancy maintains around 47.8%
- Daily rates hold near $184
Low Season (January, February, November)
- Revenue drops to average $1,199 per month
- Occupancy decreases to average 28.6%
- Daily rates adjust to average $144
Seasonality Insights for Harlingen
- The Airbnb seasonality in Harlingen shows highly seasonal trends requiring careful strategy. While the sections above show seasonal averages, it's also insightful to look at the extremes:
- During the high season, the absolute peak month showcases Harlingen's highest earning potential, with monthly revenues capable of climbing to $3,411, occupancy reaching a high of 85.7%, and ADRs peaking at $206.
- Conversely, the slowest single month of the year, typically falling within the low season, marks the market's lowest point. In this month, revenue might dip to $1,013, occupancy could drop to 24.3%, and ADRs may adjust down to $141.
- Understanding both the seasonal averages and these monthly peaks and troughs in revenue, occupancy, and ADR is crucial for maximizing your Airbnb profit potential in Harlingen.
Seasonal Strategies for Maximizing Profit
- Peak Season: Maximize revenue through premium pricing and potentially longer minimum stays. Ensure high availability.
- Low Season: Offer competitive pricing, special promotions (e.g., extended stay discounts), and flexible cancellation policies. Target off-season travelers like remote workers or budget-conscious guests.
- Shoulder Seasons: Implement dynamic pricing that balances peak and low rates. Target weekend travelers or specific events. Offer slightly more flexible terms than peak season.
- Regularly analyze your own performance against these Harlingen seasonality benchmarks and adjust your pricing and availability strategy accordingly.
Best Areas for Airbnb Investment in Harlingen (2025)
Exploring the top neighborhoods for short-term rentals in Harlingen? This section highlights key areas, outlining why they are attractive for hosts and guests, along with notable local attractions. Consider these locations based on your target guest profile and investment strategy.
| Neighborhood / Area | Why Host Here? (Target Guests & Appeal) | Key Attractions & Landmarks |
|---|---|---|
| Valkeniersplein | A vibrant city square in the heart of Harlingen, popular for its surrounding cafes and shops. Ideal for tourists looking to experience local culture and nightlife. | Harlingen Port, Cafe de Jong, Local boutiques, Harlingen City Museum, Street festivals |
| Oude Haven | The old harbor area filled with historical significance and picturesque views of the water. Beautiful for those wishing to enjoy marina life and local seafood cuisine. | Eindhap, Fishing port, Harlingen Lighthouse, Harlingen Hazebrouck, Breezand beach |
| Zeezicht | A coastal area known for its scenic views and proximity to beaches, attracting families and travelers looking to relax by the sea. | Harlingen Beach, Water sports activities, Coastal walking paths, Beautiful sunset views, Beachfront restaurants |
| Willemshaven | A charming waterfront area noted for its historical buildings and maritime atmosphere, perfect for history buffs and boating enthusiasts. | Maritime Museum, Historic ships, Local eateries, Scenic boat trips, Cultural events |
| Dijkstraat | A lively street near the center with shops and cafes, favored by locals and visitors for its accessibility and vibrancy. | Shops and boutiques, Cafes, Local markets, Cultural performances, Street art |
| Noorderhaven | A tranquil part of Harlingen with beautiful views, ideal for those looking to escape the hustle and bustle and enjoy nature. | Quiet walking paths, Nature reserves nearby, Relaxing parks, Scenic waterfront, Bird watching opportunities |
| Stadspark | A central park offering recreation, green space, and activities for families and nature lovers alike, great for guests of all ages. | Playgrounds, Walking trails, Green spaces, Seasonal events, Picnic areas |
| Noorderhavenkade | Known for its waterfront location and cozy atmosphere, this area provides a relaxed vibe with access to dining and leisure activities. | Waterfront dining, Fishing spots, Canoeing, Relaxing views, Community events |
Understanding Airbnb License Requirements & STR Laws in Harlingen (2025)
While Harlingen, Frisia, Netherlands currently shows low STR regulations, specific Airbnb license requirements might still exist or change. Always verify the latest short term rental regulations and Airbnb license requirements directly with local government authorities for Harlingen to ensure full compliance before hosting.
(Source: AirROI data, 2025, finding no licensed listings among those analyzed)
Top Performing Airbnb Properties in Harlingen (2025)
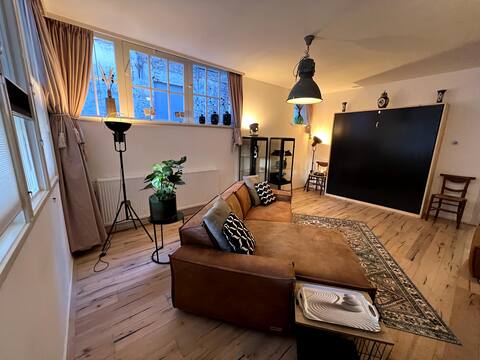
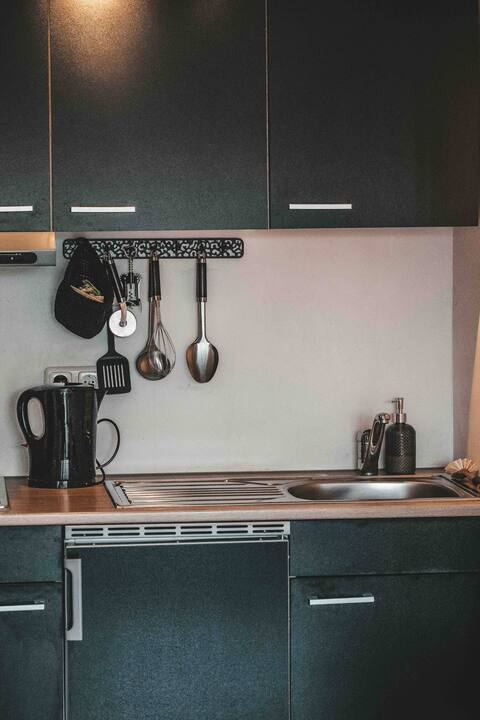
Benchmark your potential! Explore examples of top-performing Airbnb properties in Harlingenbased on Trailing Twelve Month (TTM) revenue. Analyze their characteristics, revenue, occupancy rate, and ADR to understand what drives success in this market.

Luxury suite overlooking the Wadden Sea, Harlingen
Entire Place • 1 bedroom

Grand Canal House in Harlingen
Entire Place • 3 bedrooms

RIJKSMONUMENT CENTRUM HARLINGEN - DESIGN INTERIEUR
Entire Place • 2 bedrooms

Cozy house near the center of Harlingen
Entire Place • 3 bedrooms
B&B in the Olde place
Entire Place • 1 bedroom
The Tinyhouse of Matjene
Entire Place • 1 bedroom
Note: Performance varies based on location, size, amenities, seasonality, and management quality. Data reflects the past 12 months.
Top Performing Airbnb Hosts in Harlingen (2025)
Learn from the best! This table showcases top-performing Airbnb hosts in Harlingen based on the number of properties managed and estimated total revenue over the past year. Analyze their scale and performance metrics.
| Host Name | Properties | Grossing Revenue | Stay Reviews | Avg Rating |
|---|---|---|---|---|
| Jeroen | 1 | $95,892 | 162 | 4.99/5.0 |
| Rients | 1 | $61,511 | 31 | 4.81/5.0 |
| Gerritjan | 4 | $51,740 | 48 | 4.58/5.0 |
| Nikolien | 1 | $32,740 | 10 | 5.00/5.0 |
| Tineke | 1 | $32,485 | 35 | 4.91/5.0 |
| Michiel | 1 | $28,532 | 57 | 4.96/5.0 |
| Matjene | 1 | $26,612 | 190 | 4.79/5.0 |
| Menno | 1 | $23,905 | 24 | 4.79/5.0 |
| Louis | 1 | $23,269 | 152 | 4.94/5.0 |
| Willianne En Frank | 1 | $22,455 | 59 | 4.80/5.0 |
Analyzing the strategies of top hosts, such as their property selection, pricing, and guest communication, can offer valuable lessons for optimizing your own Airbnb operations in Harlingen.
Dive Deeper: Advanced Harlingen STR Market Data (2025)
Ready to unlock more insights? AirROI provides access to advanced metrics and comprehensive Airbnb data for Harlingen. Explore detailed analytics beyond this report to refine your investment strategy, optimize pricing, and maximize your vacation rental profits.
Explore Advanced MetricsHarlingen Short-Term Rental Market Composition (2025): Property & Room Types
Room Type Distribution
Property Type Distribution
Market Composition Insights for Harlingen
- The Harlingen Airbnb market composition is heavily skewed towards Entire Home/Apt listings, which make up 73.5% of the 34 active rentals. This indicates strong guest preference for privacy and space.
- Looking at the property type distribution in Harlingen, House properties are the most common (52.9%), reflecting the local real estate landscape.
- Houses represent a significant 52.9% portion, catering likely to families or larger groups.
- The presence of 11.8% Hotel/Boutique listings indicates integration with traditional hospitality.
- Smaller segments like unique stays (combined 2.9%) offer potential for unique stay experiences.
Harlingen Airbnb Room Capacity Analysis (2025): Bedroom Distribution
Distribution of Listings by Number of Bedrooms
Room Capacity Insights for Harlingen
- The dominant room capacity in Harlingen is 1 bedroom listings, making up 41.2% of the market. This suggests a strong demand for properties suitable for couples or solo travelers.
- Together, 1 bedroom and 3 bedrooms properties represent 61.8% of the active Airbnb listings in Harlingen, indicating a high concentration in these sizes.
- A significant 26.5% of listings offer 3+ bedrooms, catering to larger groups and families seeking more space in Harlingen.
Harlingen Vacation Rental Guest Capacity Trends (2025)
Distribution of Listings by Guest Capacity
Guest Capacity Insights for Harlingen
- The most common guest capacity trend in Harlingen vacation rentals is listings accommodating 4 guests (29.4%). This suggests the primary traveler segment is likely small families or groups.
- Properties designed for 4 guests and 2 guests dominate the Harlingen STR market, accounting for 50.0% of listings.
- 17.7% of properties accommodate 6+ guests, serving the market segment for larger families or group travel in Harlingen.
- On average, properties in Harlingen are equipped to host 3.4 guests.
Harlingen Airbnb Booking Patterns (2025): Available vs. Booked Days
Available Days Distribution
Booked Days Distribution
Booking Pattern Insights for Harlingen
- The most common availability pattern in Harlingen falls within the 181-270 days range, representing 44.1% of listings. This suggests many properties have significant open periods on their calendars.
- Approximately 70.6% of listings show high availability (181+ days open annually), indicating potential for increased bookings or specific owner usage patterns.
- For booked days, the 91-180 days range is most frequent in Harlingen (41.2%), reflecting common guest stay durations or potential owner blocking patterns.
- A notable 32.4% of properties secure long booking periods (181+ days booked per year), highlighting successful long-term rental strategies or significant owner usage.
Harlingen Airbnb Minimum Stay Requirements Analysis
Distribution of Listings by Minimum Night Requirement
1 Night
11 listings
35.5% of total
2 Nights
9 listings
29% of total
3 Nights
5 listings
16.1% of total
4-6 Nights
2 listings
6.5% of total
7-29 Nights
2 listings
6.5% of total
30+ Nights
2 listings
6.5% of total
Key Insights
- The most prevalent minimum stay requirement in Harlingen is 1 Night, adopted by 35.5% of listings. This highlights the market's preference for shorter, flexible bookings.
- A strong majority (64.5%) of the Harlingen Airbnb data shows acceptance of very short stays (1-2 nights), indicating a dynamic, high-turnover market.
Recommendations
- Align with the market by considering a 1 Night minimum stay, as 35.5% of Harlingen hosts use this setting.
- Explore offering discounts for stays of 30+ nights to attract the 6.5% of the market seeking extended stays.
- Adjust minimum nights based on seasonality – potentially shorter during low season and longer during peak demand periods in Harlingen.
Harlingen Airbnb Cancellation Policy Trends Analysis (2025)
Flexible
4 listings
13.3% of total
Moderate
12 listings
40% of total
Firm
8 listings
26.7% of total
Strict
6 listings
20% of total
Cancellation Policy Insights for Harlingen
- The prevailing Airbnb cancellation policy trend in Harlingen is Moderate, used by 40% of listings.
- There's a relatively balanced mix between guest-friendly (53.3%) and stricter (46.7%) policies, offering choices for different guest needs.
Recommendations for Hosts
- Consider adopting a Moderate policy to align with the 40% market standard in Harlingen.
- Regularly review your cancellation policy against competitors and market demand shifts in Harlingen.
Harlingen STR Booking Lead Time Analysis (2025)
Average Booking Lead Time by Month
Booking Lead Time Insights for Harlingen
- The overall average booking lead time for vacation rentals in Harlingen is 74 days.
- Guests book furthest in advance for stays during August (average 121 days), likely coinciding with peak travel demand or local events.
- The shortest booking windows occur for stays in February (average 39 days), indicating more last-minute travel plans during this time.
- Seasonally, Summer (113 days avg.) sees the longest lead times, while Winter (54 days avg.) has the shortest, reflecting typical travel planning cycles.
Recommendations for Hosts
- Use the overall average lead time (74 days) as a baseline for your pricing and availability strategy in Harlingen.
- For August stays, consider implementing length-of-stay discounts or slightly higher rates for bookings made less than 121 days out to capitalize on advance planning.
- Target marketing efforts for the Summer season well in advance (at least 113 days) to capture early planners.
- Monitor your own booking lead times against these Harlingen averages to identify opportunities for dynamic pricing adjustments.
Popular & Essential Airbnb Amenities in Harlingen (2025)
Amenity Prevalence
Amenity Insights for Harlingen
- Essential amenities in Harlingen that guests expect include: Wifi, Heating, Essentials. Lacking these (any) could significantly impact bookings.
- Popular amenities like Coffee maker, Smoke alarm, Hot water are common but not universal. Offering these can provide a competitive edge.
Recommendations for Hosts
- Ensure your listing includes all essential amenities for Harlingen: Wifi, Heating, Essentials.
- Prioritize adding missing essentials: Essentials.
- Consider adding popular differentiators like Coffee maker or Smoke alarm to increase appeal.
- Highlight unique or less common amenities you offer (e.g., hot tub, dedicated workspace, EV charger) in your listing description and photos.
- Regularly check competitor amenities in Harlingen to stay competitive.
Harlingen Airbnb Guest Demographics & Profile Analysis (2025)
Guest Profile Summary for Harlingen
- The typical guest profile for Airbnb in Harlingen consists of predominantly international visitors (69%), with top international origins including Netherlands, typically belonging to the Post-2000s (Gen Z/Alpha) group (50%), primarily speaking English or German.
- Domestic travelers account for 31.0% of guests.
- Key international markets include Germany (44.5%) and Netherlands (31%).
- Top languages spoken are English (41.1%) followed by German (28.4%).
- A significant demographic segment is the Post-2000s (Gen Z/Alpha) group, representing 50% of guests.
Recommendations for Hosts
- Focus marketing internationally, particularly towards travelers from Netherlands.
- Tailor amenities and listing descriptions to appeal to the dominant Post-2000s (Gen Z/Alpha) demographic (e.g., highlight fast WiFi, smart home features, local guides).
- Highlight unique local experiences or amenities relevant to the primary guest profile.
- Consider seasonal promotions aligned with peak travel times for key origin markets.
Nearby Short-Term Rental Market Comparison
How does the Harlingen Airbnb market stack up against its neighbors? Compare key performance metrics like average monthly revenue, ADR, and occupancy rates in surrounding areas to understand the broader regional STR landscape.
| Market | Active Properties | Monthly Revenue | Daily Rate | Avg. Occupancy |
|---|---|---|---|---|
| Kockengen | 12 | $7,560 | $396.31 | 61% |
| Bentveld | 13 | $4,798 | $443.61 | 54% |
| Halfweg | 17 | $4,307 | $231.13 | 55% |
| Aerdenhout | 17 | $4,288 | $694.02 | 53% |
| Oud Ade | 17 | $3,779 | $277.47 | 51% |
| Rijs | 27 | $3,772 | $356.97 | 45% |
| Zwanenburg | 24 | $3,720 | $240.77 | 66% |
| Kortenhoef | 15 | $3,495 | $255.48 | 53% |
| Ouderkerk aan de Amstel | 28 | $3,433 | $231.63 | 57% |
| Amsterdam | 4,967 | $3,368 | $295.90 | 52% |