Echtenerbrug Airbnb Market Analysis 2025: Short Term Rental Data & Vacation Rental Statistics in Frisia, Netherlands
Is Airbnb profitable in Echtenerbrug in 2025? Explore comprehensive Airbnb analytics for Echtenerbrug, Frisia, Netherlands to uncover income potential. This 2025 STR market report for Echtenerbrug, based on AirROI data from April 2024 to March 2025, reveals key trends in the niche market of 17 active listings.
Whether you're considering an Airbnb investment in Echtenerbrug, optimizing your existing vacation rental, or exploring rental arbitrage opportunities, understanding the Echtenerbrug Airbnb data is crucial. Leveraging the low regulation environment is key to maximizing your short term rental income potential. Let's dive into the specifics.
Key Echtenerbrug Airbnb Performance Metrics Overview
Monthly Airbnb Revenue Variations & Income Potential in Echtenerbrug (2025)
Understanding the monthly revenue variations for Airbnb listings in Echtenerbrug is key to maximizing your short term rental income potential. Seasonality significantly impacts earnings. Our analysis, based on data from the past 12 months, shows that the peak revenue month for STRs in Echtenerbrug is typically January, while April often presents the lowest earnings, highlighting opportunities for strategic pricing adjustments during shoulder and low seasons. Explore the typical Airbnb income in Echtenerbrug across different performance tiers:
- Best-in-class properties (Top 10%) achieve $2,868+ monthly, often utilizing dynamic pricing and superior guest experiences.
- Strong performing properties (Top 25%) earn $2,025 or more, indicating effective management and desirable locations/amenities.
- Typical properties (Median) generate around $1,082 per month, representing the average market performance.
- Entry-level properties (Bottom 25%) see earnings around $714, often with potential for optimization.
Average Monthly Airbnb Earnings Trend in Echtenerbrug
Echtenerbrug Airbnb Occupancy Rate Trends (2025)
Maximize your bookings by understanding the Echtenerbrug STR occupancy trends. Seasonal demand shifts significantly influence how often properties are booked. Typically, Januarysees the highest demand (peak season occupancy), while April experiences the lowest (low season). Effective strategies, like adjusting minimum stays or offering promotions, can boost occupancy during slower periods. Here's how different property tiers perform in Echtenerbrug:
- Best-in-class properties (Top 10%) achieve 54%+ occupancy, indicating high desirability and potentially optimized availability.
- Strong performing properties (Top 25%) maintain 41% or higher occupancy, suggesting good market fit and guest satisfaction.
- Typical properties (Median) have an occupancy rate around 27%.
- Entry-level properties (Bottom 25%) average 18% occupancy, potentially facing higher vacancy.
Average Monthly Occupancy Rate Trend in Echtenerbrug
Average Daily Rate (ADR) Airbnb Trends in Echtenerbrug (2025)
Effective short term rental pricing strategy in Echtenerbrug involves understanding monthly ADR fluctuations. The Average Daily Rate (ADR) for Airbnb in Echtenerbrug typically peaks in July and dips lowest during January. Leveraging Airbnb dynamic pricing tools or strategies based on this seasonality can significantly boost revenue. Here's a look at the typical nightly rates achieved:
- Best-in-class properties (Top 10%) command rates of $183+ per night, often due to premium features or locations.
- Strong performing properties (Top 25%) achieve nightly rates of $163 or more.
- Typical properties (Median) charge around $99 per night.
- Entry-level properties (Bottom 25%) earn around $87 per night.
Average Daily Rate (ADR) Trend by Month in Echtenerbrug
Get Live Echtenerbrug Market Intelligence 👇

Explore Real-time Analytics
Airbnb Seasonality Analysis & Trends in Echtenerbrug (2025)
Peak Season (January, August, July)
- Revenue averages $2,080 per month
- Occupancy rates average 48.0%
- Daily rates average $128
Shoulder Season
- Revenue averages $1,461 per month
- Occupancy maintains around 29.7%
- Daily rates hold near $127
Low Season (March, April, September)
- Revenue drops to average $725 per month
- Occupancy decreases to average 16.8%
- Daily rates adjust to average $126
Seasonality Insights for Echtenerbrug
- The Airbnb seasonality in Echtenerbrug shows highly seasonal trends requiring careful strategy. While the sections above show seasonal averages, it's also insightful to look at the extremes:
- During the high season, the absolute peak month showcases Echtenerbrug's highest earning potential, with monthly revenues capable of climbing to $2,118, occupancy reaching a high of 49.0%, and ADRs peaking at $135.
- Conversely, the slowest single month of the year, typically falling within the low season, marks the market's lowest point. In this month, revenue might dip to $379, occupancy could drop to 13.0%, and ADRs may adjust down to $117.
- Understanding both the seasonal averages and these monthly peaks and troughs in revenue, occupancy, and ADR is crucial for maximizing your Airbnb profit potential in Echtenerbrug.
Seasonal Strategies for Maximizing Profit
- Peak Season: Maximize revenue through premium pricing and potentially longer minimum stays. Ensure high availability.
- Low Season: Offer competitive pricing, special promotions (e.g., extended stay discounts), and flexible cancellation policies. Target off-season travelers like remote workers or budget-conscious guests.
- Shoulder Seasons: Implement dynamic pricing that balances peak and low rates. Target weekend travelers or specific events. Offer slightly more flexible terms than peak season.
- Regularly analyze your own performance against these Echtenerbrug seasonality benchmarks and adjust your pricing and availability strategy accordingly.
Best Areas for Airbnb Investment in Echtenerbrug (2025)
Exploring the top neighborhoods for short-term rentals in Echtenerbrug? This section highlights key areas, outlining why they are attractive for hosts and guests, along with notable local attractions. Consider these locations based on your target guest profile and investment strategy.
| Neighborhood / Area | Why Host Here? (Target Guests & Appeal) | Key Attractions & Landmarks |
|---|---|---|
| Echtenerbrug Canal | Picturesque village with stunning canal views, ideal for water-based recreation and leisure activities. Perfect location for guests looking for a serene getaway close to nature. | Echtenerbrug Canal, local biking trails, nature reserves, water sports, village markets |
| De Haan | Charming beach town atmosphere, popular with families and beach lovers. Hosts summer events and is close to lovely beaches, making it a great family destination. | De Haan Beach, Molenbeek Nature Reserve, festivals, local seafood restaurants |
| Giethoorn | Famous for its picturesque canals and 'Venice of the North' reputation, it attracts tourists interested in boat tours and tranquility. A must-visit place rich with nature and culture. | Giethoorn canals, boat rentals, historical museums, nature walks |
| Friesland Museum | Cultural historical hub attracting visitors interested in the rich history of Friesland. Close to various festivals and events throughout the year. | Friesland Museum, local art galleries, annual cultural events |
| Oldeberkoop | Quiet village offering a taste of traditional Dutch rural life. Perfect for guests wanting to escape the hustle and bustle of city life and enjoy nature walks. | nature walks, local farms, traditional Dutch architecture |
| Langweer | Known for the beautiful lakes and its proximity to hiking trails, it’s popular for watersports and nature activities, drawing in those who love the outdoors. | Langweer Lake, hiking trails, boating, nature parks |
| Bovenmeer | Scenic area near the lake, offers a relaxing environment perfect for nature lovers and fishing enthusiasts. Access to water activities makes it appealing for staycations. | Bovenmeer Lake, fishing spots, walking trails |
| Sneek | Known for its historical significance and vibrant city life, Sneek features a picturesque harbor and various shops, making it ideal for urban tourists and locals alike. | Sneek Watergate, Historic city center, Sneekermeer, festivals and markets |
Understanding Airbnb License Requirements & STR Laws in Echtenerbrug (2025)
While Echtenerbrug, Frisia, Netherlands currently shows low STR regulations, specific Airbnb license requirements might still exist or change. Always verify the latest short term rental regulations and Airbnb license requirements directly with local government authorities for Echtenerbrug to ensure full compliance before hosting.
(Source: AirROI data, 2025, finding no licensed listings among those analyzed)
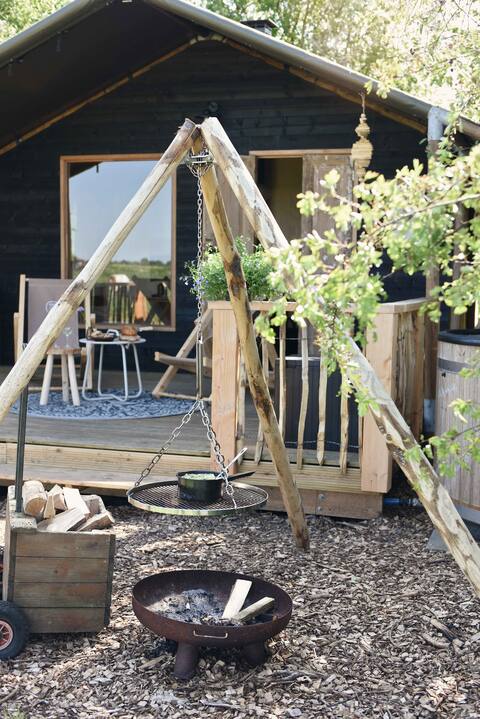
Top Performing Airbnb Properties in Echtenerbrug (2025)
Benchmark your potential! Explore examples of top-performing Airbnb properties in Echtenerbrugbased on Trailing Twelve Month (TTM) revenue. Analyze their characteristics, revenue, occupancy rate, and ADR to understand what drives success in this market.
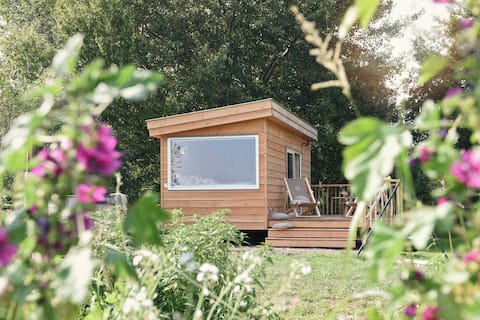
Smûk Tiny
Entire Place • 1 bedroom
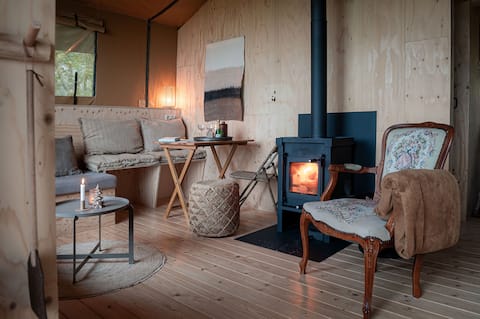
Smûk Thuske with wood stove
Entire Place • 1 bedroom
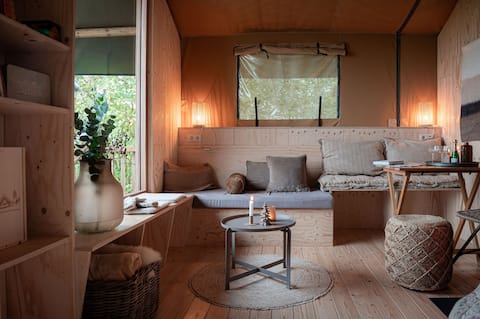
Smûk Thuske with wood stove
Entire Place • 1 bedroom
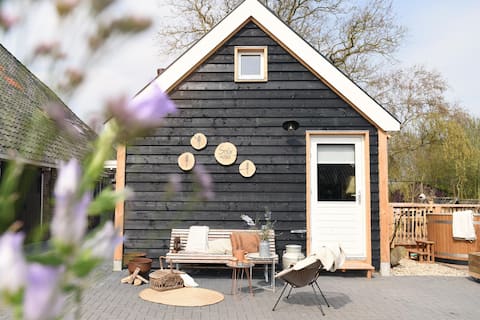
Smûk Huske
Entire Place • 1 bedroom
Smûk Tent Huske
Private Room • 1 bedroom
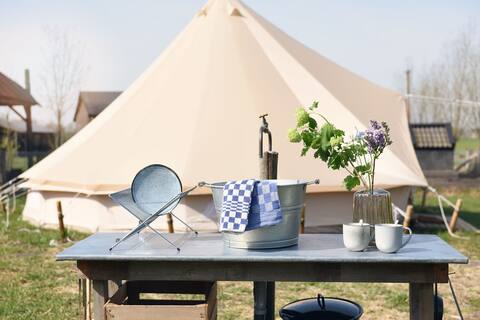
Smûk Grutte Bell Tent
Entire Place • 2 bedrooms
Note: Performance varies based on location, size, amenities, seasonality, and management quality. Data reflects the past 12 months.
Top Performing Airbnb Hosts in Echtenerbrug (2025)
Learn from the best! This table showcases top-performing Airbnb hosts in Echtenerbrug based on the number of properties managed and estimated total revenue over the past year. Analyze their scale and performance metrics.
| Host Name | Properties | Grossing Revenue | Stay Reviews | Avg Rating |
|---|---|---|---|---|
| Crista | 12 | $154,511 | 193 | 3.69/5.0 |
| J | 3 | $10,664 | 321 | 4.51/5.0 |
| Gijs En Sophie | 1 | $8,840 | 53 | 4.92/5.0 |
| Tess - BELVILLA | 1 | $6,089 | 20 | 4.75/5.0 |
Analyzing the strategies of top hosts, such as their property selection, pricing, and guest communication, can offer valuable lessons for optimizing your own Airbnb operations in Echtenerbrug.
Dive Deeper: Advanced Echtenerbrug STR Market Data (2025)
Ready to unlock more insights? AirROI provides access to advanced metrics and comprehensive Airbnb data for Echtenerbrug. Explore detailed analytics beyond this report to refine your investment strategy, optimize pricing, and maximize your vacation rental profits.
Explore Advanced MetricsEchtenerbrug Short-Term Rental Market Composition (2025): Property & Room Types
Room Type Distribution
Property Type Distribution
Market Composition Insights for Echtenerbrug
- The Echtenerbrug Airbnb market composition is heavily skewed towards Entire Home/Apt listings, which make up 82.4% of the 17 active rentals. This indicates strong guest preference for privacy and space.
- Looking at the property type distribution in Echtenerbrug, Outdoor/Unique properties are the most common (52.9%), reflecting the local real estate landscape.
- Houses represent a significant 35.3% portion, catering likely to families or larger groups.
Echtenerbrug Airbnb Room Capacity Analysis (2025): Bedroom Distribution
Distribution of Listings by Number of Bedrooms
Room Capacity Insights for Echtenerbrug
- The dominant room capacity in Echtenerbrug is 1 bedroom listings, making up 70.6% of the market. This suggests a strong demand for properties suitable for couples or solo travelers.
- Together, 1 bedroom and 2 bedrooms properties represent 88.2% of the active Airbnb listings in Echtenerbrug, indicating a high concentration in these sizes.
- With over half the market (70.6%) consisting of studios or 1-bedroom units, Echtenerbrug is particularly well-suited for individuals or couples.
- Listings with 3+ bedrooms (5.9%) represent a smaller niche, potentially indicating an underserved market for larger group accommodations in Echtenerbrug.
Echtenerbrug Vacation Rental Guest Capacity Trends (2025)
Distribution of Listings by Guest Capacity
Guest Capacity Insights for Echtenerbrug
- The most common guest capacity trend in Echtenerbrug vacation rentals is listings accommodating 4 guests (41.2%). This suggests the primary traveler segment is likely small families or groups.
- Properties designed for 4 guests and 2 guests dominate the Echtenerbrug STR market, accounting for 82.4% of listings.
- A significant 41.2% of listings cater specifically to 1-2 guests, highlighting strong demand from couples and solo travelers in Echtenerbrug.
- On average, properties in Echtenerbrug are equipped to host 2.9 guests.
Echtenerbrug Airbnb Booking Patterns (2025): Available vs. Booked Days
Available Days Distribution
Booked Days Distribution
Booking Pattern Insights for Echtenerbrug
- The most common availability pattern in Echtenerbrug falls within the 271-366 days range, representing 70.6% of listings. This suggests many properties have significant open periods on their calendars.
- Approximately 100.0% of listings show high availability (181+ days open annually), indicating potential for increased bookings or specific owner usage patterns.
- For booked days, the 31-90 days range is most frequent in Echtenerbrug (47.1%), reflecting common guest stay durations or potential owner blocking patterns.
- A notable 5.9% of properties secure long booking periods (181+ days booked per year), highlighting successful long-term rental strategies or significant owner usage.
Echtenerbrug Airbnb Minimum Stay Requirements Analysis
Distribution of Listings by Minimum Night Requirement
1 Night
5 listings
29.4% of total
2 Nights
9 listings
52.9% of total
30+ Nights
3 listings
17.6% of total
Key Insights
- The most prevalent minimum stay requirement in Echtenerbrug is 2 Nights, adopted by 52.9% of listings. This highlights the market's preference for shorter, flexible bookings.
- A strong majority (82.3%) of the Echtenerbrug Airbnb data shows acceptance of very short stays (1-2 nights), indicating a dynamic, high-turnover market.
- A significant segment (17.6%) caters to monthly stays (30+ nights) in Echtenerbrug, pointing to opportunities in the extended-stay market.
Recommendations
- Align with the market by considering a 2 Nights minimum stay, as 52.9% of Echtenerbrug hosts use this setting.
- If feasible, allowing 1-night stays, especially midweek or during low season, could capture last-minute bookings, as only 29.4% currently do.
- Explore offering discounts for stays of 30+ nights to attract the 17.6% of the market seeking extended stays.
- Adjust minimum nights based on seasonality – potentially shorter during low season and longer during peak demand periods in Echtenerbrug.
Echtenerbrug Airbnb Cancellation Policy Trends Analysis (2025)
Flexible
4 listings
28.6% of total
Moderate
8 listings
57.1% of total
Strict
2 listings
14.3% of total
Cancellation Policy Insights for Echtenerbrug
- The prevailing Airbnb cancellation policy trend in Echtenerbrug is Moderate, used by 57.1% of listings.
- The market strongly favors guest-friendly terms, with 85.7% of listings offering Flexible or Moderate policies. This suggests guests in Echtenerbrug may expect booking flexibility.
Recommendations for Hosts
- Consider adopting a Moderate policy to align with the 57.1% market standard in Echtenerbrug.
- Using a Strict policy might deter some guests, as only 14.3% of listings use it. Evaluate if potential revenue protection outweighs possible lower booking rates.
- Regularly review your cancellation policy against competitors and market demand shifts in Echtenerbrug.
Echtenerbrug STR Booking Lead Time Analysis (2025)
Average Booking Lead Time by Month
Booking Lead Time Insights for Echtenerbrug
- The overall average booking lead time for vacation rentals in Echtenerbrug is 58 days.
- Guests book furthest in advance for stays during June (average 119 days), likely coinciding with peak travel demand or local events.
- The shortest booking windows occur for stays in December (average 15 days), indicating more last-minute travel plans during this time.
- Seasonally, Summer (88 days avg.) sees the longest lead times, while Winter (19 days avg.) has the shortest, reflecting typical travel planning cycles.
Recommendations for Hosts
- Use the overall average lead time (58 days) as a baseline for your pricing and availability strategy in Echtenerbrug.
- For June stays, consider implementing length-of-stay discounts or slightly higher rates for bookings made less than 119 days out to capitalize on advance planning.
- Target marketing efforts for the Summer season well in advance (at least 88 days) to capture early planners.
- Monitor your own booking lead times against these Echtenerbrug averages to identify opportunities for dynamic pricing adjustments.
Popular & Essential Airbnb Amenities in Echtenerbrug (2025)
Amenity Prevalence
Amenity Insights for Echtenerbrug
- Essential amenities in Echtenerbrug that guests expect include: Coffee maker. Lacking these (this) could significantly impact bookings.
- Popular amenities like Hot water, Bed linens, Hangers are common but not universal. Offering these can provide a competitive edge.
Recommendations for Hosts
- Ensure your listing includes all essential amenities for Echtenerbrug: Coffee maker.
- Consider adding popular differentiators like Hot water or Bed linens to increase appeal.
- Highlight unique or less common amenities you offer (e.g., hot tub, dedicated workspace, EV charger) in your listing description and photos.
- Regularly check competitor amenities in Echtenerbrug to stay competitive.
Echtenerbrug Airbnb Guest Demographics & Profile Analysis (2025)
Guest Profile Summary for Echtenerbrug
- The typical guest profile for Airbnb in Echtenerbrug consists of a mix of domestic (44%) and international guests, with top international origins including Germany, typically belonging to the Post-2000s (Gen Z/Alpha) group (50%), primarily speaking English or German.
- Domestic travelers account for 44.3% of guests.
- Key international markets include Netherlands (44.3%) and Germany (42.9%).
- Top languages spoken are English (39.8%) followed by German (25.2%).
- A significant demographic segment is the Post-2000s (Gen Z/Alpha) group, representing 50% of guests.
Recommendations for Hosts
- Balance marketing efforts between domestic and international channels based on the guest mix.
- Tailor amenities and listing descriptions to appeal to the dominant Post-2000s (Gen Z/Alpha) demographic (e.g., highlight fast WiFi, smart home features, local guides).
- Highlight unique local experiences or amenities relevant to the primary guest profile.
- Consider seasonal promotions aligned with peak travel times for key origin markets.
Nearby Short-Term Rental Market Comparison
How does the Echtenerbrug Airbnb market stack up against its neighbors? Compare key performance metrics like average monthly revenue, ADR, and occupancy rates in surrounding areas to understand the broader regional STR landscape.
| Market | Active Properties | Monthly Revenue | Daily Rate | Avg. Occupancy |
|---|---|---|---|---|
| Kockengen | 12 | $7,560 | $396.31 | 61% |
| Baarlo | 18 | $5,602 | $313.73 | 60% |
| Bentveld | 13 | $4,798 | $443.61 | 54% |
| Halfweg | 17 | $4,307 | $231.13 | 55% |
| Aerdenhout | 17 | $4,288 | $694.02 | 53% |
| Merksplas | 10 | $3,885 | $256.59 | 44% |
| Oud Ade | 17 | $3,779 | $277.47 | 51% |
| Rijs | 27 | $3,772 | $356.97 | 45% |
| Zwanenburg | 24 | $3,720 | $240.77 | 66% |
| Kerkdriel | 25 | $3,607 | $323.16 | 40% |