Almere Airbnb Market Analysis 2025: Short Term Rental Data & Vacation Rental Statistics in Flevoland, Netherlands
Is Airbnb profitable in Almere in 2025? Explore comprehensive Airbnb analytics for Almere, Flevoland, Netherlands to uncover income potential. This 2025 STR market report for Almere, based on AirROI data from April 2024 to March 2025, reveals key trends in the niche market of 139 active listings.
Whether you're considering an Airbnb investment in Almere, optimizing your existing vacation rental, or exploring rental arbitrage opportunities, understanding the Almere Airbnb data is crucial. Leveraging the low regulation environment is key to maximizing your short term rental income potential. Let's dive into the specifics.
Key Almere Airbnb Performance Metrics Overview
Monthly Airbnb Revenue Variations & Income Potential in Almere (2025)
Understanding the monthly revenue variations for Airbnb listings in Almere is key to maximizing your short term rental income potential. Seasonality significantly impacts earnings. Our analysis, based on data from the past 12 months, shows that the peak revenue month for STRs in Almere is typically July, while March often presents the lowest earnings, highlighting opportunities for strategic pricing adjustments during shoulder and low seasons. Explore the typical Airbnb income in Almere across different performance tiers:
- Best-in-class properties (Top 10%) achieve $4,970+ monthly, often utilizing dynamic pricing and superior guest experiences.
- Strong performing properties (Top 25%) earn $2,943 or more, indicating effective management and desirable locations/amenities.
- Typical properties (Median) generate around $1,746 per month, representing the average market performance.
- Entry-level properties (Bottom 25%) see earnings around $879, often with potential for optimization.
Average Monthly Airbnb Earnings Trend in Almere
Almere Airbnb Occupancy Rate Trends (2025)
Maximize your bookings by understanding the Almere STR occupancy trends. Seasonal demand shifts significantly influence how often properties are booked. Typically, Julysees the highest demand (peak season occupancy), while March experiences the lowest (low season). Effective strategies, like adjusting minimum stays or offering promotions, can boost occupancy during slower periods. Here's how different property tiers perform in Almere:
- Best-in-class properties (Top 10%) achieve 86%+ occupancy, indicating high desirability and potentially optimized availability.
- Strong performing properties (Top 25%) maintain 72% or higher occupancy, suggesting good market fit and guest satisfaction.
- Typical properties (Median) have an occupancy rate around 49%.
- Entry-level properties (Bottom 25%) average 25% occupancy, potentially facing higher vacancy.
Average Monthly Occupancy Rate Trend in Almere
Average Daily Rate (ADR) Airbnb Trends in Almere (2025)
Effective short term rental pricing strategy in Almere involves understanding monthly ADR fluctuations. The Average Daily Rate (ADR) for Airbnb in Almere typically peaks in December and dips lowest during April. Leveraging Airbnb dynamic pricing tools or strategies based on this seasonality can significantly boost revenue. Here's a look at the typical nightly rates achieved:
- Best-in-class properties (Top 10%) command rates of $248+ per night, often due to premium features or locations.
- Strong performing properties (Top 25%) achieve nightly rates of $190 or more.
- Typical properties (Median) charge around $112 per night.
- Entry-level properties (Bottom 25%) earn around $76 per night.
Average Daily Rate (ADR) Trend by Month in Almere
Get Live Almere Market Intelligence 👇

Explore Real-time Analytics
Airbnb Seasonality Analysis & Trends in Almere (2025)
Peak Season (July, May, June)
- Revenue averages $2,995 per month
- Occupancy rates average 59.1%
- Daily rates average $141
Shoulder Season
- Revenue averages $2,326 per month
- Occupancy maintains around 52.1%
- Daily rates hold near $143
Low Season (January, February, March)
- Revenue drops to average $1,367 per month
- Occupancy decreases to average 33.2%
- Daily rates adjust to average $146
Seasonality Insights for Almere
- The Airbnb seasonality in Almere shows highly seasonal trends requiring careful strategy. While the sections above show seasonal averages, it's also insightful to look at the extremes:
- During the high season, the absolute peak month showcases Almere's highest earning potential, with monthly revenues capable of climbing to $3,033, occupancy reaching a high of 65.3%, and ADRs peaking at $150.
- Conversely, the slowest single month of the year, typically falling within the low season, marks the market's lowest point. In this month, revenue might dip to $1,166, occupancy could drop to 25.8%, and ADRs may adjust down to $139.
- Understanding both the seasonal averages and these monthly peaks and troughs in revenue, occupancy, and ADR is crucial for maximizing your Airbnb profit potential in Almere.
Seasonal Strategies for Maximizing Profit
- Peak Season: Maximize revenue through premium pricing and potentially longer minimum stays. Ensure high availability.
- Low Season: Offer competitive pricing, special promotions (e.g., extended stay discounts), and flexible cancellation policies. Target off-season travelers like remote workers or budget-conscious guests.
- Shoulder Seasons: Implement dynamic pricing that balances peak and low rates. Target weekend travelers or specific events. Offer slightly more flexible terms than peak season.
- Regularly analyze your own performance against these Almere seasonality benchmarks and adjust your pricing and availability strategy accordingly.
Best Areas for Airbnb Investment in Almere (2025)
Exploring the top neighborhoods for short-term rentals in Almere? This section highlights key areas, outlining why they are attractive for hosts and guests, along with notable local attractions. Consider these locations based on your target guest profile and investment strategy.
| Neighborhood / Area | Why Host Here? (Target Guests & Appeal) | Key Attractions & Landmarks |
|---|---|---|
| Almere Haven | Scenic waterfront area known for its charming harbor and beautiful views. Perfect for tourists looking for a relaxing atmosphere with access to boat trips and the beach. | Almere Haven Harbor, Beatrixpark, Almeerderstrand, Museum Almere, Oostvaardersplassen Nature Reserve |
| Almere Stad | The city center of Almere, lively and modern with a variety of shops, restaurants, and cultural venues. Ideal for urban travelers seeking convenience and entertainment. | Stadshart Almere, Kunstlinie Almere Flevoland, De Kemphaan, Almere City Theater, Shopping Center Almere |
| Almere Poort | A rapidly developing district known for its contemporary architecture and proximity to the beach. Attracts families and those looking for a modern living experience. | Almeerderstrand, Theatre Almere Poort, Landgoed Natuur & Milieu, Polderpark Flevopolder, IKEA Almere |
| Oostvaardersplassen | Famous nature reserve known for its wildlife and scenic landscapes. Perfect for nature lovers looking to escape the city and enjoy outdoor activities. | Oostvaardersplassen Nature Reserve, Visitor Center De Oostvaarders, Bird watching, Hiking trails, Biking paths |
| Almere Buiten | Residential area with green spaces and family-friendly environment. Ideal for longer stays or vacations with children, as it offers parks and recreational facilities. | Almere Buiten Shopping Centre, De Vaart, Hockey Club Almere, Park Oosterwold, Recreational activities |
| Pampus | A historical area with a fortress and nearby nature. Attracts history buffs and tourists interested in exploring the heritage of the region. | Fort Pampus, Markermeer, Landschapspark Polder C, Sailing activities, Historical tours |
| Almere Forest | A serene area surrounded by nature and forests, suitable for those looking for tranquility and escape from urban life. | Almere Forest, Nature walks, Hiking trails, Cycling routes, Picnic areas |
| Lelystad | Nearby city with additional opportunities and attractions, expanding the reach for potential Airbnb guests. Offers unique culturally relevant experiences. | Batavia Stad Fashion Outlet, Aviodrome Aviation Theme Park, Luchtvaartmuseum, Marker Wadden, Tulip Festival in Spring |
Understanding Airbnb License Requirements & STR Laws in Almere (2025)
While Almere, Flevoland, Netherlands currently shows low STR regulations, specific Airbnb license requirements might still exist or change. Always verify the latest short term rental regulations and Airbnb license requirements directly with local government authorities for Almere to ensure full compliance before hosting.
(Source: AirROI data, 2025, finding no licensed listings among those analyzed)
Top Performing Airbnb Properties in Almere (2025)
Benchmark your potential! Explore examples of top-performing Airbnb properties in Almerebased on Trailing Twelve Month (TTM) revenue. Analyze their characteristics, revenue, occupancy rate, and ADR to understand what drives success in this market.

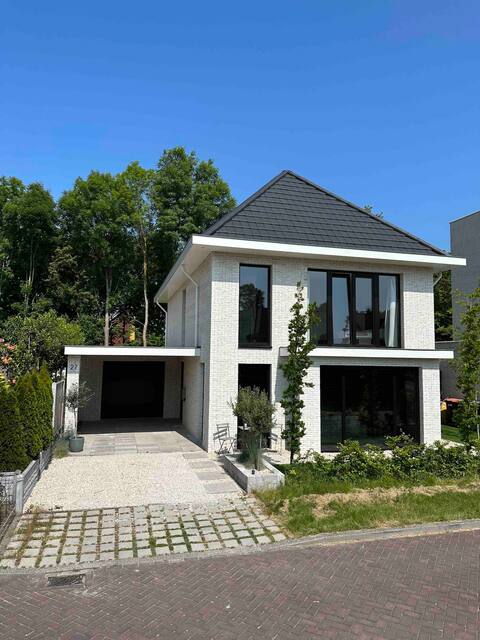
Detached villa super views
Entire Place • 4 bedrooms
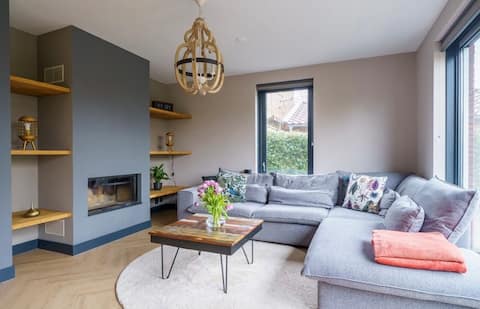
The villa to Amsterdam
Entire Place • 3 bedrooms
Entire house na bij amsterdam
Entire Place • 3 bedrooms
Only 20 minutes away from Amsterdam. Beautiful neighborhood!
Entire Place • 3 bedrooms

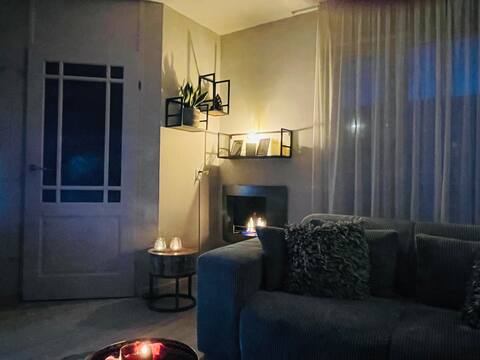
Modern, stylish apartment in the city center
Entire Place • 2 bedrooms
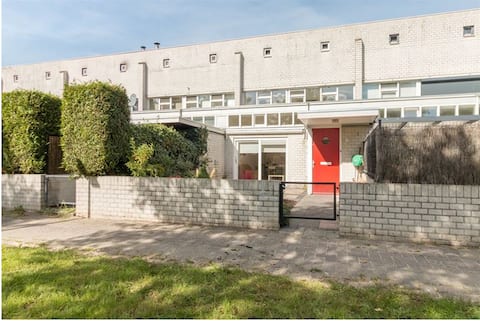
Lovely house near train to Amsterdam and Schiphol
Entire Place • 3 bedrooms
Note: Performance varies based on location, size, amenities, seasonality, and management quality. Data reflects the past 12 months.
Top Performing Airbnb Hosts in Almere (2025)
Learn from the best! This table showcases top-performing Airbnb hosts in Almere based on the number of properties managed and estimated total revenue over the past year. Analyze their scale and performance metrics.
| Host Name | Properties | Grossing Revenue | Stay Reviews | Avg Rating |
|---|---|---|---|---|
| Jessie | 9 | $139,687 | 49 | 3.20/5.0 |
| Elisa | 1 | $101,720 | 22 | 4.86/5.0 |
| Host #311955001 | 1 | $87,865 | 49 | 4.90/5.0 |
| Dolf | 2 | $82,038 | 190 | 4.54/5.0 |
| Amir | 6 | $78,528 | 95 | 4.85/5.0 |
| Moniek | 2 | $78,032 | 59 | 2.42/5.0 |
| Andre | 1 | $70,348 | 89 | 4.33/5.0 |
| Shirley | 3 | $68,022 | 317 | 4.96/5.0 |
| Michel | 1 | $67,722 | 6 | 5.00/5.0 |
| Joyce | 2 | $67,399 | 351 | 4.96/5.0 |
Analyzing the strategies of top hosts, such as their property selection, pricing, and guest communication, can offer valuable lessons for optimizing your own Airbnb operations in Almere.
Dive Deeper: Advanced Almere STR Market Data (2025)
Ready to unlock more insights? AirROI provides access to advanced metrics and comprehensive Airbnb data for Almere. Explore detailed analytics beyond this report to refine your investment strategy, optimize pricing, and maximize your vacation rental profits.
Explore Advanced MetricsAlmere Short-Term Rental Market Composition (2025): Property & Room Types
Room Type Distribution
Property Type Distribution
Market Composition Insights for Almere
- The Almere Airbnb market composition is heavily skewed towards Entire Home/Apt listings, which make up 66.2% of the 139 active rentals. This indicates strong guest preference for privacy and space.
- However, a notable 33.8% share for Private Rooms suggests opportunities for budget-conscious travelers or hosts renting out spare rooms.
- Looking at the property type distribution in Almere, House properties are the most common (63.3%), reflecting the local real estate landscape.
- Houses represent a significant 63.3% portion, catering likely to families or larger groups.
- The presence of 10.8% Hotel/Boutique listings indicates integration with traditional hospitality.
- Smaller segments like unique stays (combined 0.7%) offer potential for unique stay experiences.
Almere Airbnb Room Capacity Analysis (2025): Bedroom Distribution
Distribution of Listings by Number of Bedrooms
Room Capacity Insights for Almere
- The dominant room capacity in Almere is 1 bedroom listings, making up 30.2% of the market. This suggests a strong demand for properties suitable for couples or solo travelers.
- Together, 1 bedroom and 2 bedrooms properties represent 45.3% of the active Airbnb listings in Almere, indicating a high concentration in these sizes.
- A significant 23.7% of listings offer 3+ bedrooms, catering to larger groups and families seeking more space in Almere.
Almere Vacation Rental Guest Capacity Trends (2025)
Distribution of Listings by Guest Capacity
Guest Capacity Insights for Almere
- The most common guest capacity trend in Almere vacation rentals is listings accommodating 2 guests (24.5%). This suggests the primary traveler segment is likely couples or solo travelers.
- Properties designed for 2 guests and 4 guests dominate the Almere STR market, accounting for 38.2% of listings.
- 20.1% of properties accommodate 6+ guests, serving the market segment for larger families or group travel in Almere.
- On average, properties in Almere are equipped to host 2.9 guests.
Almere Airbnb Booking Patterns (2025): Available vs. Booked Days
Available Days Distribution
Booked Days Distribution
Booking Pattern Insights for Almere
- The most common availability pattern in Almere falls within the 181-270 days range, representing 36% of listings. This suggests many properties have significant open periods on their calendars.
- Approximately 64.1% of listings show high availability (181+ days open annually), indicating potential for increased bookings or specific owner usage patterns.
- For booked days, the 91-180 days range is most frequent in Almere (36.7%), reflecting common guest stay durations or potential owner blocking patterns.
- A notable 35.9% of properties secure long booking periods (181+ days booked per year), highlighting successful long-term rental strategies or significant owner usage.
Almere Airbnb Minimum Stay Requirements Analysis
Distribution of Listings by Minimum Night Requirement
1 Night
47 listings
35.1% of total
2 Nights
34 listings
25.4% of total
3 Nights
14 listings
10.4% of total
4-6 Nights
12 listings
9% of total
7-29 Nights
16 listings
11.9% of total
30+ Nights
11 listings
8.2% of total
Key Insights
- The most prevalent minimum stay requirement in Almere is 1 Night, adopted by 35.1% of listings. This highlights the market's preference for shorter, flexible bookings.
- A strong majority (60.5%) of the Almere Airbnb data shows acceptance of very short stays (1-2 nights), indicating a dynamic, high-turnover market.
Recommendations
- Align with the market by considering a 1 Night minimum stay, as 35.1% of Almere hosts use this setting.
- Explore offering discounts for stays of 30+ nights to attract the 8.2% of the market seeking extended stays.
- Adjust minimum nights based on seasonality – potentially shorter during low season and longer during peak demand periods in Almere.
Almere Airbnb Cancellation Policy Trends Analysis (2025)
Super Strict 60 Days
8 listings
6.7% of total
Flexible
23 listings
19.3% of total
Moderate
48 listings
40.3% of total
Firm
17 listings
14.3% of total
Strict
23 listings
19.3% of total
Cancellation Policy Insights for Almere
- The prevailing Airbnb cancellation policy trend in Almere is Moderate, used by 40.3% of listings.
- There's a relatively balanced mix between guest-friendly (59.6%) and stricter (33.6%) policies, offering choices for different guest needs.
Recommendations for Hosts
- Consider adopting a Moderate policy to align with the 40.3% market standard in Almere.
- Regularly review your cancellation policy against competitors and market demand shifts in Almere.
Almere STR Booking Lead Time Analysis (2025)
Average Booking Lead Time by Month
Booking Lead Time Insights for Almere
- The overall average booking lead time for vacation rentals in Almere is 52 days.
- Guests book furthest in advance for stays during June (average 83 days), likely coinciding with peak travel demand or local events.
- The shortest booking windows occur for stays in February (average 34 days), indicating more last-minute travel plans during this time.
- Seasonally, Summer (73 days avg.) sees the longest lead times, while Winter (44 days avg.) has the shortest, reflecting typical travel planning cycles.
Recommendations for Hosts
- Use the overall average lead time (52 days) as a baseline for your pricing and availability strategy in Almere.
- For June stays, consider implementing length-of-stay discounts or slightly higher rates for bookings made less than 83 days out to capitalize on advance planning.
- Target marketing efforts for the Summer season well in advance (at least 73 days) to capture early planners.
- Monitor your own booking lead times against these Almere averages to identify opportunities for dynamic pricing adjustments.
Popular & Essential Airbnb Amenities in Almere (2025)
Amenity Prevalence
Amenity Insights for Almere
- Popular amenities like Wifi, Heating, Smoke alarm are common but not universal. Offering these can provide a competitive edge.
- Warning: Wifi is not universally provided but is considered essential globally. Ensure reliable Wifi is offered.
Recommendations for Hosts
- Consider adding popular differentiators like Wifi or Heating to increase appeal.
- Highlight unique or less common amenities you offer (e.g., hot tub, dedicated workspace, EV charger) in your listing description and photos.
- Regularly check competitor amenities in Almere to stay competitive.
Almere Airbnb Guest Demographics & Profile Analysis (2025)
Guest Profile Summary for Almere
- The typical guest profile for Airbnb in Almere consists of predominantly international visitors (92%), with top international origins including France, typically belonging to the Post-2000s (Gen Z/Alpha) group (50%), primarily speaking English or German.
- Domestic travelers account for 8.1% of guests.
- Key international markets include Germany (26.4%) and France (13.4%).
- Top languages spoken are English (41.8%) followed by German (14.9%).
- A significant demographic segment is the Post-2000s (Gen Z/Alpha) group, representing 50% of guests.
Recommendations for Hosts
- Focus marketing internationally, particularly towards travelers from France.
- Tailor amenities and listing descriptions to appeal to the dominant Post-2000s (Gen Z/Alpha) demographic (e.g., highlight fast WiFi, smart home features, local guides).
- Highlight unique local experiences or amenities relevant to the primary guest profile.
- Consider seasonal promotions aligned with peak travel times for key origin markets.
Nearby Short-Term Rental Market Comparison
How does the Almere Airbnb market stack up against its neighbors? Compare key performance metrics like average monthly revenue, ADR, and occupancy rates in surrounding areas to understand the broader regional STR landscape.
| Market | Active Properties | Monthly Revenue | Daily Rate | Avg. Occupancy |
|---|---|---|---|---|
| Kockengen | 12 | $7,560 | $396.31 | 61% |
| Baarlo | 18 | $5,602 | $313.73 | 60% |
| Bentveld | 13 | $4,798 | $443.61 | 54% |
| Halfweg | 17 | $4,307 | $231.13 | 55% |
| Aerdenhout | 17 | $4,288 | $694.02 | 53% |
| Merksplas | 10 | $3,885 | $256.59 | 44% |
| Oud Ade | 17 | $3,779 | $277.47 | 51% |
| Rijs | 27 | $3,772 | $356.97 | 45% |
| Zwanenburg | 24 | $3,720 | $240.77 | 66% |
| Kerkdriel | 25 | $3,607 | $323.16 | 40% |