Anloo Airbnb Market Analysis 2025: Short Term Rental Data & Vacation Rental Statistics in Drenthe, Netherlands
Is Airbnb profitable in Anloo in 2025? Explore comprehensive Airbnb analytics for Anloo, Drenthe, Netherlands to uncover income potential. This 2025 STR market report for Anloo, based on AirROI data from April 2024 to March 2025, reveals key trends in the niche market of 17 active listings.
Whether you're considering an Airbnb investment in Anloo, optimizing your existing vacation rental, or exploring rental arbitrage opportunities, understanding the Anloo Airbnb data is crucial. Leveraging the low regulation environment is key to maximizing your short term rental income potential. Let's dive into the specifics.
Key Anloo Airbnb Performance Metrics Overview
Monthly Airbnb Revenue Variations & Income Potential in Anloo (2025)
Understanding the monthly revenue variations for Airbnb listings in Anloo is key to maximizing your short term rental income potential. Seasonality significantly impacts earnings. Our analysis, based on data from the past 12 months, shows that the peak revenue month for STRs in Anloo is typically June, while March often presents the lowest earnings, highlighting opportunities for strategic pricing adjustments during shoulder and low seasons. Explore the typical Airbnb income in Anloo across different performance tiers:
- Best-in-class properties (Top 10%) achieve $2,191+ monthly, often utilizing dynamic pricing and superior guest experiences.
- Strong performing properties (Top 25%) earn $1,924 or more, indicating effective management and desirable locations/amenities.
- Typical properties (Median) generate around $1,444 per month, representing the average market performance.
- Entry-level properties (Bottom 25%) see earnings around $840, often with potential for optimization.
Average Monthly Airbnb Earnings Trend in Anloo
Anloo Airbnb Occupancy Rate Trends (2025)
Maximize your bookings by understanding the Anloo STR occupancy trends. Seasonal demand shifts significantly influence how often properties are booked. Typically, Julysees the highest demand (peak season occupancy), while April experiences the lowest (low season). Effective strategies, like adjusting minimum stays or offering promotions, can boost occupancy during slower periods. Here's how different property tiers perform in Anloo:
- Best-in-class properties (Top 10%) achieve 76%+ occupancy, indicating high desirability and potentially optimized availability.
- Strong performing properties (Top 25%) maintain 61% or higher occupancy, suggesting good market fit and guest satisfaction.
- Typical properties (Median) have an occupancy rate around 41%.
- Entry-level properties (Bottom 25%) average 26% occupancy, potentially facing higher vacancy.
Average Monthly Occupancy Rate Trend in Anloo
Average Daily Rate (ADR) Airbnb Trends in Anloo (2025)
Effective short term rental pricing strategy in Anloo involves understanding monthly ADR fluctuations. The Average Daily Rate (ADR) for Airbnb in Anloo typically peaks in July and dips lowest during March. Leveraging Airbnb dynamic pricing tools or strategies based on this seasonality can significantly boost revenue. Here's a look at the typical nightly rates achieved:
- Best-in-class properties (Top 10%) command rates of $113+ per night, often due to premium features or locations.
- Strong performing properties (Top 25%) achieve nightly rates of $93 or more.
- Typical properties (Median) charge around $84 per night.
- Entry-level properties (Bottom 25%) earn around $77 per night.
Average Daily Rate (ADR) Trend by Month in Anloo
Get Live Anloo Market Intelligence 👇

Explore Real-time Analytics
Airbnb Seasonality Analysis & Trends in Anloo (2025)
Peak Season (June, May, April)
- Revenue averages $1,960 per month
- Occupancy rates average 39.1%
- Daily rates average $90
Shoulder Season
- Revenue averages $1,491 per month
- Occupancy maintains around 52.7%
- Daily rates hold near $90
Low Season (February, March, December)
- Revenue drops to average $806 per month
- Occupancy decreases to average 30.5%
- Daily rates adjust to average $86
Seasonality Insights for Anloo
- The Airbnb seasonality in Anloo shows highly seasonal trends requiring careful strategy. While the sections above show seasonal averages, it's also insightful to look at the extremes:
- During the high season, the absolute peak month showcases Anloo's highest earning potential, with monthly revenues capable of climbing to $2,012, occupancy reaching a high of 64.0%, and ADRs peaking at $93.
- Conversely, the slowest single month of the year, typically falling within the low season, marks the market's lowest point. In this month, revenue might dip to $616, occupancy could drop to 24.7%, and ADRs may adjust down to $85.
- Understanding both the seasonal averages and these monthly peaks and troughs in revenue, occupancy, and ADR is crucial for maximizing your Airbnb profit potential in Anloo.
Seasonal Strategies for Maximizing Profit
- Peak Season: Maximize revenue through premium pricing and potentially longer minimum stays. Ensure high availability.
- Low Season: Offer competitive pricing, special promotions (e.g., extended stay discounts), and flexible cancellation policies. Target off-season travelers like remote workers or budget-conscious guests.
- Shoulder Seasons: Implement dynamic pricing that balances peak and low rates. Target weekend travelers or specific events. Offer slightly more flexible terms than peak season.
- Regularly analyze your own performance against these Anloo seasonality benchmarks and adjust your pricing and availability strategy accordingly.
Best Areas for Airbnb Investment in Anloo (2025)
Exploring the top neighborhoods for short-term rentals in Anloo? This section highlights key areas, outlining why they are attractive for hosts and guests, along with notable local attractions. Consider these locations based on your target guest profile and investment strategy.
| Neighborhood / Area | Why Host Here? (Target Guests & Appeal) | Key Attractions & Landmarks |
|---|---|---|
| Anloo Centre | Charming village center with historic buildings and local shops. A great spot for visitors wanting an authentic Dutch countryside experience, with proximity to nature and hiking trails. | Local shops, Anloo church, Historical buildings, Nature trails, Nearby hiking spots |
| Hondsrug Geological Park | Unique geological area with beautiful landscapes and opportunities for outdoor activities. Popular for hiking, biking, and nature exploration, making it a prime spot for adventure travelers. | Hiking trails, Biking routes, Scenic nature views |
| Drentsche Aa National Park | Stunning national park featuring lush landscapes and rich wildlife. Perfect for nature lovers and those seeking tranquility away from urban life, attracting eco-tourists. | Nature trails, Wildlife spotting, Picnic areas, Historical sites |
| Borkum Hill | Popular viewpoint that offers panoramic views of the surrounding countryside. An ideal place for nature photography enthusiasts and those seeking serenity. | Viewpoint, Nature observation, Photography spots |
| Grollo | A small village nearby known for its peaceful atmosphere and beautiful nature. Attractive to families and travelers looking for a quaint escape. | Local parks, Tranquil environment, Cultural sites |
| Zuidlaren Lake | Beautiful lake area offering various outdoor activities such as swimming and boating. A great attraction for families and visitors looking for relaxation in nature. | Swimming, Boating, Picnic spots, Walking trails |
| Wildhub Nature Reserve | A protected nature reserve that allows visitors to connect with nature while enjoying bird watching and guided tours. Ideal for educational tourism and nature enthusiasts. | Bird watching, Guided nature tours, Ecological education |
| Anloo Woods | Enchanting forest area ideal for hiking and cycling. Appeals to those looking to immerse themselves in nature while staying close to Anloo village. | Hiking trails, Cycling routes, Natural beauty |
Understanding Airbnb License Requirements & STR Laws in Anloo (2025)
While Anloo, Drenthe, Netherlands currently shows low STR regulations, specific Airbnb license requirements might still exist or change. Always verify the latest short term rental regulations and Airbnb license requirements directly with local government authorities for Anloo to ensure full compliance before hosting.
(Source: AirROI data, 2025, finding no licensed listings among those analyzed)
Top Performing Airbnb Properties in Anloo (2025)
Benchmark your potential! Explore examples of top-performing Airbnb properties in Anloobased on Trailing Twelve Month (TTM) revenue. Analyze their characteristics, revenue, occupancy rate, and ADR to understand what drives success in this market.
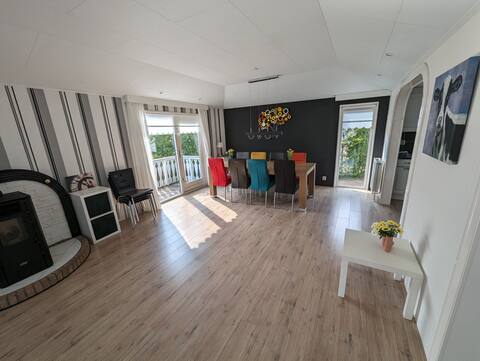
Chalet Anloo, welcome to welcome you.
Entire Place • 3 bedrooms
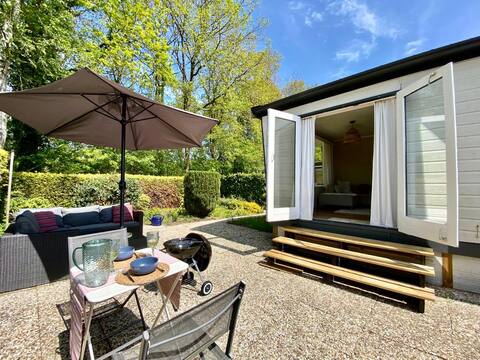
“Woodz” At the Bosrand!
Entire Place • 1 bedroom
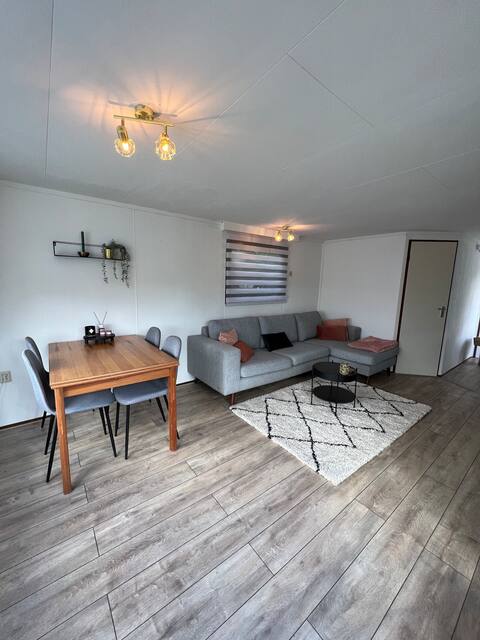
Chalet Linée in wooded area Anloo
Entire Place • 2 bedrooms

Frescovino
Entire Place • 2 bedrooms
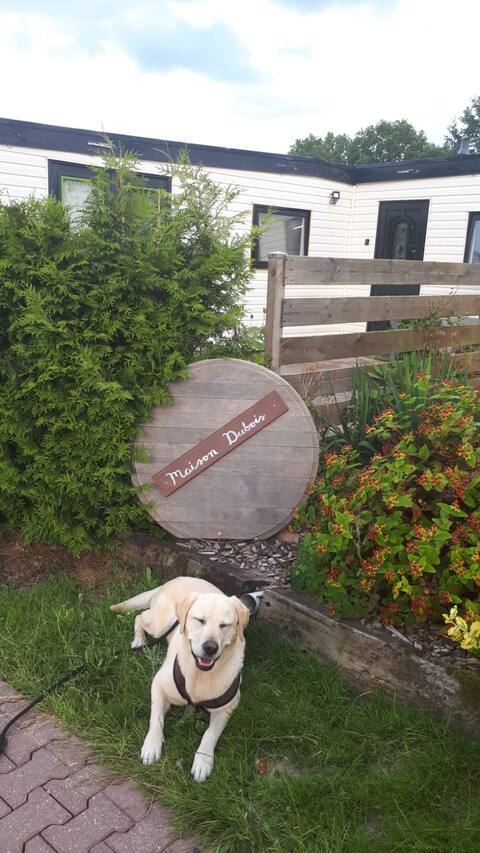
Chalet “maison Dubois”
Entire Place • 2 bedrooms

Chalet Quattro
Entire Place • 1 bedroom
Note: Performance varies based on location, size, amenities, seasonality, and management quality. Data reflects the past 12 months.
Top Performing Airbnb Hosts in Anloo (2025)
Learn from the best! This table showcases top-performing Airbnb hosts in Anloo based on the number of properties managed and estimated total revenue over the past year. Analyze their scale and performance metrics.
| Host Name | Properties | Grossing Revenue | Stay Reviews | Avg Rating |
|---|---|---|---|---|
| Eline | 2 | $34,724 | 17 | 4.59/5.0 |
| Bart | 1 | $27,791 | 3 | 5.00/5.0 |
| Britt | 1 | $20,045 | 55 | 4.65/5.0 |
| Lourens | 1 | $17,527 | 29 | 4.83/5.0 |
| Johan | 1 | $17,072 | 42 | 4.52/5.0 |
| Ester | 1 | $16,807 | 8 | 4.63/5.0 |
| Host #491555078 | 1 | $13,879 | 19 | 4.74/5.0 |
| Egbert | 1 | $13,838 | 13 | 4.85/5.0 |
| Shanne | 1 | $13,623 | 28 | 4.46/5.0 |
| Martin En Klaudia | 1 | $11,319 | 316 | 4.81/5.0 |
Analyzing the strategies of top hosts, such as their property selection, pricing, and guest communication, can offer valuable lessons for optimizing your own Airbnb operations in Anloo.
Dive Deeper: Advanced Anloo STR Market Data (2025)
Ready to unlock more insights? AirROI provides access to advanced metrics and comprehensive Airbnb data for Anloo. Explore detailed analytics beyond this report to refine your investment strategy, optimize pricing, and maximize your vacation rental profits.
Explore Advanced MetricsAnloo Short-Term Rental Market Composition (2025): Property & Room Types
Room Type Distribution
Property Type Distribution
Market Composition Insights for Anloo
- The Anloo Airbnb market composition is heavily skewed towards Entire Home/Apt listings, which make up 100% of the 17 active rentals. This indicates strong guest preference for privacy and space.
- Looking at the property type distribution in Anloo, House properties are the most common (52.9%), reflecting the local real estate landscape.
- Houses represent a significant 52.9% portion, catering likely to families or larger groups.
- The presence of 5.9% Hotel/Boutique listings indicates integration with traditional hospitality.
Anloo Airbnb Room Capacity Analysis (2025): Bedroom Distribution
Distribution of Listings by Number of Bedrooms
Room Capacity Insights for Anloo
- The dominant room capacity in Anloo is 2 bedrooms listings, making up 58.8% of the market. This suggests a strong demand for properties suitable for couples or solo travelers.
- Together, 2 bedrooms and 1 bedroom properties represent 94.1% of the active Airbnb listings in Anloo, indicating a high concentration in these sizes.
- Listings with 3+ bedrooms (5.9%) represent a smaller niche, potentially indicating an underserved market for larger group accommodations in Anloo.
Anloo Vacation Rental Guest Capacity Trends (2025)
Distribution of Listings by Guest Capacity
Guest Capacity Insights for Anloo
- The most common guest capacity trend in Anloo vacation rentals is listings accommodating 4 guests (64.7%). This suggests the primary traveler segment is likely small families or groups.
- Properties designed for 4 guests and 2 guests dominate the Anloo STR market, accounting for 94.1% of listings.
- On average, properties in Anloo are equipped to host 3.6 guests.
Anloo Airbnb Booking Patterns (2025): Available vs. Booked Days
Available Days Distribution
Booked Days Distribution
Booking Pattern Insights for Anloo
- The most common availability pattern in Anloo falls within the 91-180 days range, representing 41.2% of listings. This suggests many properties have significant open periods on their calendars.
- Approximately 58.8% of listings show high availability (181+ days open annually), indicating potential for increased bookings or specific owner usage patterns.
- For booked days, the 91-180 days range is most frequent in Anloo (41.2%), reflecting common guest stay durations or potential owner blocking patterns.
- A notable 41.2% of properties secure long booking periods (181+ days booked per year), highlighting successful long-term rental strategies or significant owner usage.
Anloo Airbnb Minimum Stay Requirements Analysis
Distribution of Listings by Minimum Night Requirement
1 Night
1 listings
6.7% of total
2 Nights
8 listings
53.3% of total
3 Nights
4 listings
26.7% of total
7-29 Nights
2 listings
13.3% of total
Key Insights
- The most prevalent minimum stay requirement in Anloo is 2 Nights, adopted by 53.3% of listings. This highlights the market's preference for shorter, flexible bookings.
Recommendations
- Align with the market by considering a 2 Nights minimum stay, as 53.3% of Anloo hosts use this setting.
- If feasible, allowing 1-night stays, especially midweek or during low season, could capture last-minute bookings, as only 6.7% currently do.
- A 2-night minimum appears standard (53.3%). Consider this for weekends or peak periods.
- Adjust minimum nights based on seasonality – potentially shorter during low season and longer during peak demand periods in Anloo.
Anloo Airbnb Cancellation Policy Trends Analysis (2025)
Flexible
7 listings
46.7% of total
Moderate
6 listings
40% of total
Firm
1 listings
6.7% of total
Strict
1 listings
6.7% of total
Cancellation Policy Insights for Anloo
- The prevailing Airbnb cancellation policy trend in Anloo is Flexible, used by 46.7% of listings.
- The market strongly favors guest-friendly terms, with 86.7% of listings offering Flexible or Moderate policies. This suggests guests in Anloo may expect booking flexibility.
- Strict cancellation policies are quite rare (6.7%), potentially making listings with this policy less competitive unless justified by high demand or property type.
Recommendations for Hosts
- Consider adopting a Flexible policy to align with the 46.7% market standard in Anloo.
- Using a Strict policy might deter some guests, as only 6.7% of listings use it. Evaluate if potential revenue protection outweighs possible lower booking rates.
- Regularly review your cancellation policy against competitors and market demand shifts in Anloo.
Anloo STR Booking Lead Time Analysis (2025)
Average Booking Lead Time by Month
Booking Lead Time Insights for Anloo
- The overall average booking lead time for vacation rentals in Anloo is 28 days.
- Guests book furthest in advance for stays during June (average 78 days), likely coinciding with peak travel demand or local events.
- The shortest booking windows occur for stays in August (average 19 days), indicating more last-minute travel plans during this time.
- Seasonally, Summer (56 days avg.) sees the longest lead times, while Fall (23 days avg.) has the shortest, reflecting typical travel planning cycles.
Recommendations for Hosts
- Use the overall average lead time (28 days) as a baseline for your pricing and availability strategy in Anloo.
- For June stays, consider implementing length-of-stay discounts or slightly higher rates for bookings made less than 78 days out to capitalize on advance planning.
- Target marketing efforts for the Summer season well in advance (at least 56 days) to capture early planners.
- Monitor your own booking lead times against these Anloo averages to identify opportunities for dynamic pricing adjustments.
Popular & Essential Airbnb Amenities in Anloo (2025)
Amenity Prevalence
Amenity Insights for Anloo
- Essential amenities in Anloo that guests expect include: Heating, Wifi, Hot water, Dishes and silverware, Refrigerator, TV, Kitchen, Free parking on premises, Smoke alarm. Lacking these (any) could significantly impact bookings.
- Popular amenities like Bed linens are common but not universal. Offering these can provide a competitive edge.
Recommendations for Hosts
- Ensure your listing includes all essential amenities for Anloo: Heating, Wifi, Hot water, Dishes and silverware, Refrigerator, TV, Kitchen, Free parking on premises, Smoke alarm.
- Consider adding popular differentiators like Bed linens to increase appeal.
- Highlight unique or less common amenities you offer (e.g., hot tub, dedicated workspace, EV charger) in your listing description and photos.
- Regularly check competitor amenities in Anloo to stay competitive.
Anloo Airbnb Guest Demographics & Profile Analysis (2025)
Guest Profile Summary for Anloo
- The typical guest profile for Airbnb in Anloo consists of a mix of domestic (55%) and international guests, often arriving from nearby Groningen, typically belonging to the Post-2000s (Gen Z/Alpha) group (50%), primarily speaking English or German.
- Domestic travelers account for 55.2% of guests.
- Key international markets include Netherlands (55.2%) and Germany (24.8%).
- Top languages spoken are English (39.6%) followed by German (20.8%).
- A significant demographic segment is the Post-2000s (Gen Z/Alpha) group, representing 50% of guests.
Recommendations for Hosts
- Balance marketing efforts between domestic and international channels based on the guest mix.
- Tailor amenities and listing descriptions to appeal to the dominant Post-2000s (Gen Z/Alpha) demographic (e.g., highlight fast WiFi, smart home features, local guides).
- Highlight unique local experiences or amenities relevant to the primary guest profile.
- Consider seasonal promotions aligned with peak travel times for key origin markets.
Nearby Short-Term Rental Market Comparison
How does the Anloo Airbnb market stack up against its neighbors? Compare key performance metrics like average monthly revenue, ADR, and occupancy rates in surrounding areas to understand the broader regional STR landscape.
| Market | Active Properties | Monthly Revenue | Daily Rate | Avg. Occupancy |
|---|---|---|---|---|
| Rijs | 27 | $3,772 | $356.97 | 45% |
| Kortenhoef | 15 | $3,495 | $255.48 | 53% |
| Muiden | 29 | $3,226 | $291.72 | 48% |
| Vierhouten | 15 | $3,026 | $196.88 | 52% |
| Bant | 10 | $2,983 | $538.44 | 25% |
| Uitdam | 34 | $2,907 | $425.90 | 30% |
| Soest | 49 | $2,884 | $225.80 | 50% |
| Kollumerpomp | 10 | $2,829 | $325.26 | 34% |
| Zeewolde | 163 | $2,799 | $303.22 | 35% |
| Nigtevecht | 11 | $2,797 | $174.65 | 53% |