Sint Willibrordus Airbnb Market Analysis 2025: Short Term Rental Data & Vacation Rental Statistics in Curacao, Netherlands
Is Airbnb profitable in Sint Willibrordus in 2025? Explore comprehensive Airbnb analytics for Sint Willibrordus, Curacao, Netherlands to uncover income potential. This 2025 STR market report for Sint Willibrordus, based on AirROI data from April 2024 to March 2025, reveals key trends in the niche market of 38 active listings.
Whether you're considering an Airbnb investment in Sint Willibrordus, optimizing your existing vacation rental, or exploring rental arbitrage opportunities, understanding the Sint Willibrordus Airbnb data is crucial. Leveraging the low regulation environment is key to maximizing your short term rental income potential. Let's dive into the specifics.
Key Sint Willibrordus Airbnb Performance Metrics Overview
Monthly Airbnb Revenue Variations & Income Potential in Sint Willibrordus (2025)
Understanding the monthly revenue variations for Airbnb listings in Sint Willibrordus is key to maximizing your short term rental income potential. Seasonality significantly impacts earnings. Our analysis, based on data from the past 12 months, shows that the peak revenue month for STRs in Sint Willibrordus is typically January, while September often presents the lowest earnings, highlighting opportunities for strategic pricing adjustments during shoulder and low seasons. Explore the typical Airbnb income in Sint Willibrordus across different performance tiers:
- Best-in-class properties (Top 10%) achieve $6,176+ monthly, often utilizing dynamic pricing and superior guest experiences.
- Strong performing properties (Top 25%) earn $3,994 or more, indicating effective management and desirable locations/amenities.
- Typical properties (Median) generate around $2,102 per month, representing the average market performance.
- Entry-level properties (Bottom 25%) see earnings around $1,096, often with potential for optimization.
Average Monthly Airbnb Earnings Trend in Sint Willibrordus
Sint Willibrordus Airbnb Occupancy Rate Trends (2025)
Maximize your bookings by understanding the Sint Willibrordus STR occupancy trends. Seasonal demand shifts significantly influence how often properties are booked. Typically, Januarysees the highest demand (peak season occupancy), while June experiences the lowest (low season). Effective strategies, like adjusting minimum stays or offering promotions, can boost occupancy during slower periods. Here's how different property tiers perform in Sint Willibrordus:
- Best-in-class properties (Top 10%) achieve 85%+ occupancy, indicating high desirability and potentially optimized availability.
- Strong performing properties (Top 25%) maintain 76% or higher occupancy, suggesting good market fit and guest satisfaction.
- Typical properties (Median) have an occupancy rate around 52%.
- Entry-level properties (Bottom 25%) average 24% occupancy, potentially facing higher vacancy.
Average Monthly Occupancy Rate Trend in Sint Willibrordus
Average Daily Rate (ADR) Airbnb Trends in Sint Willibrordus (2025)
Effective short term rental pricing strategy in Sint Willibrordus involves understanding monthly ADR fluctuations. The Average Daily Rate (ADR) for Airbnb in Sint Willibrordus typically peaks in April and dips lowest during March. Leveraging Airbnb dynamic pricing tools or strategies based on this seasonality can significantly boost revenue. Here's a look at the typical nightly rates achieved:
- Best-in-class properties (Top 10%) command rates of $434+ per night, often due to premium features or locations.
- Strong performing properties (Top 25%) achieve nightly rates of $270 or more.
- Typical properties (Median) charge around $172 per night.
- Entry-level properties (Bottom 25%) earn around $101 per night.
Average Daily Rate (ADR) Trend by Month in Sint Willibrordus
Get Live Sint Willibrordus Market Intelligence 👇

Explore Real-time Analytics
Airbnb Seasonality Analysis & Trends in Sint Willibrordus (2025)
Peak Season (January, July, November)
- Revenue averages $3,309 per month
- Occupancy rates average 59.0%
- Daily rates average $208
Shoulder Season
- Revenue averages $2,878 per month
- Occupancy maintains around 51.8%
- Daily rates hold near $208
Low Season (June, September, October)
- Revenue drops to average $2,215 per month
- Occupancy decreases to average 40.6%
- Daily rates adjust to average $211
Seasonality Insights for Sint Willibrordus
- The Airbnb seasonality in Sint Willibrordus shows moderate seasonality with distinct peak and low periods. While the sections above show seasonal averages, it's also insightful to look at the extremes:
- During the high season, the absolute peak month showcases Sint Willibrordus's highest earning potential, with monthly revenues capable of climbing to $3,604, occupancy reaching a high of 63.7%, and ADRs peaking at $220.
- Conversely, the slowest single month of the year, typically falling within the low season, marks the market's lowest point. In this month, revenue might dip to $2,033, occupancy could drop to 32.1%, and ADRs may adjust down to $199.
- Understanding both the seasonal averages and these monthly peaks and troughs in revenue, occupancy, and ADR is crucial for maximizing your Airbnb profit potential in Sint Willibrordus.
Seasonal Strategies for Maximizing Profit
- Peak Season: Maximize revenue through premium pricing and potentially longer minimum stays. Ensure high availability.
- Low Season: Offer competitive pricing, special promotions (e.g., extended stay discounts), and flexible cancellation policies. Target off-season travelers like remote workers or budget-conscious guests.
- Shoulder Seasons: Implement dynamic pricing that balances peak and low rates. Target weekend travelers or specific events. Offer slightly more flexible terms than peak season.
- Regularly analyze your own performance against these Sint Willibrordus seasonality benchmarks and adjust your pricing and availability strategy accordingly.
Best Areas for Airbnb Investment in Sint Willibrordus (2025)
Exploring the top neighborhoods for short-term rentals in Sint Willibrordus? This section highlights key areas, outlining why they are attractive for hosts and guests, along with notable local attractions. Consider these locations based on your target guest profile and investment strategy.
| Neighborhood / Area | Why Host Here? (Target Guests & Appeal) | Key Attractions & Landmarks |
|---|---|---|
| Blue Bay | A beautiful beach and golf resort area known for its stunning scenery and amenities. Ideal for families and vacationers looking for relaxation and outdoor activities. | Blue Bay Beach, Blue Bay Golf Course, Marine Park, snorkeling and diving opportunities, resorts and restaurants |
| Westpunt | A serene and secluded area known for its natural beauty, close to stunning beaches and scenic viewpoints. Perfect for those seeking tranquility and outdoor adventures. | Playa Kenepa Grandi, Playa Kalki, Christoffel National Park, scenic cliffs and views, snorkeling spots |
| Punda | The vibrant capital city area with rich history and colorful architecture, ideal for cultural and urban experiences. Attracts tourists looking to explore local culture and cuisine. | Historic Fort Amsterdam, Queen Emma Bridge, Mikve Israel-Emanuel Synagogue, local markets and shops, cafes and restaurants |
| Otrobanda | Known for its charming streets and local culture, Otrobanda offers a more authentic experience while being close to Punda. Great for those wanting to immerse themselves in local life. | Old Town architecture, local art galleries, historical museums, restaurants with local cuisine |
| Jan Thiel | A modern, upscale area popular with tourists due to its beach clubs and resort facilities. Offers a mix of relaxation and nightlife. | Jan Thiel Beach, Seaquarium Beach, Zanzibar Beach Club, nightlife options, water sports |
| Santa Barbara | An upscale resort area featuring a marina and beautiful beaches. Appealing to families and luxury travelers looking for premium accommodations and activities. | Santa Barbara Beach, Santa Barbara Resort, golf and water sports, marina activities |
| Willemstad | The capital of Curacao, known for its charming waterfront and colorful buildings. A hub for tourism with historical sites and vibrant nightlife. | Handelskade, Kura Hulanda Museum, local dining and shopping, vibrant nightlife scene |
| Lagoon Area | A picturesque area perfect for boating and water activities. Attractive to those seeking adventure and beautiful views. | Curacao Sea Aquarium, water sports rentals, waterfront dining, scenic views |
Understanding Airbnb License Requirements & STR Laws in Sint Willibrordus (2025)
While Sint Willibrordus, Curacao, Netherlands currently shows low STR regulations, specific Airbnb license requirements might still exist or change. Always verify the latest short term rental regulations and Airbnb license requirements directly with local government authorities for Sint Willibrordus to ensure full compliance before hosting.
(Source: AirROI data, 2025, finding no licensed listings among those analyzed)
Top Performing Airbnb Properties in Sint Willibrordus (2025)
Benchmark your potential! Explore examples of top-performing Airbnb properties in Sint Willibrordusbased on Trailing Twelve Month (TTM) revenue. Analyze their characteristics, revenue, occupancy rate, and ADR to understand what drives success in this market.
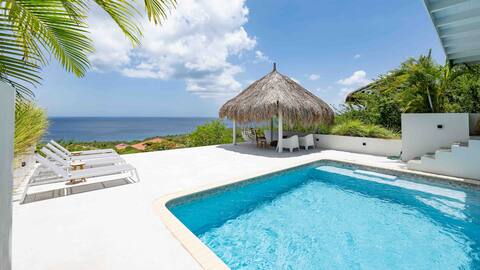
Luxury beach villa with pool and beautiful sea views
Entire Place • 4 bedrooms
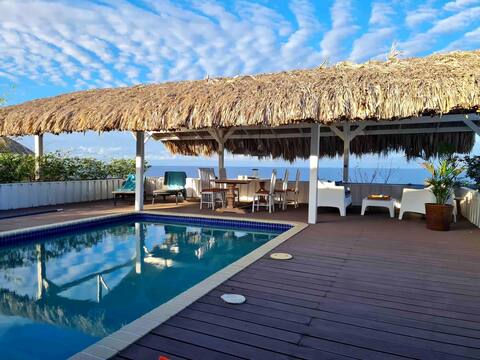
Villa Palapa view offers stunning ocean view
Entire Place • 3 bedrooms
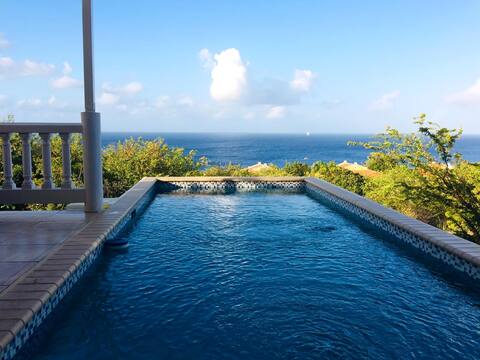
Villa Bianca with seaview
Entire Place • 3 bedrooms
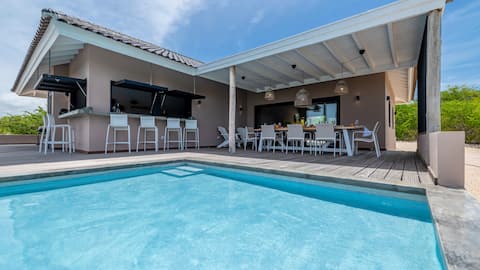
Villa Kas Sono with private pool - Coral Estate
Entire Place • 4 bedrooms
“Villa Blue Ocean”with spectacular panorama
Entire Place • 3 bedrooms
Villa Aqua Vista with stunning sea views & sunsets
Entire Place • 2 bedrooms
Note: Performance varies based on location, size, amenities, seasonality, and management quality. Data reflects the past 12 months.
Top Performing Airbnb Hosts in Sint Willibrordus (2025)
Learn from the best! This table showcases top-performing Airbnb hosts in Sint Willibrordus based on the number of properties managed and estimated total revenue over the past year. Analyze their scale and performance metrics.
| Host Name | Properties | Grossing Revenue | Stay Reviews | Avg Rating |
|---|---|---|---|---|
| Villas And More | 2 | $99,838 | 18 | 4.85/5.0 |
| Coral Estate Rentals | 3 | $78,781 | 11 | 3.03/5.0 |
| Karin | 1 | $78,175 | 31 | 4.94/5.0 |
| Norbert En Hanneke | 1 | $77,270 | 44 | 4.93/5.0 |
| Frederieke | 5 | $72,042 | 64 | 4.76/5.0 |
| Bianca | 1 | $54,776 | 114 | 4.95/5.0 |
| Ceba | 1 | $52,510 | 18 | 4.89/5.0 |
| Monika | 1 | $47,024 | 68 | 4.93/5.0 |
| Jeroen | 1 | $40,942 | 39 | 4.77/5.0 |
| Ans | 2 | $40,170 | 105 | 4.96/5.0 |
Analyzing the strategies of top hosts, such as their property selection, pricing, and guest communication, can offer valuable lessons for optimizing your own Airbnb operations in Sint Willibrordus.
Dive Deeper: Advanced Sint Willibrordus STR Market Data (2025)
Ready to unlock more insights? AirROI provides access to advanced metrics and comprehensive Airbnb data for Sint Willibrordus. Explore detailed analytics beyond this report to refine your investment strategy, optimize pricing, and maximize your vacation rental profits.
Explore Advanced MetricsSint Willibrordus Short-Term Rental Market Composition (2025): Property & Room Types
Room Type Distribution
Property Type Distribution
Market Composition Insights for Sint Willibrordus
- The Sint Willibrordus Airbnb market composition is heavily skewed towards Entire Home/Apt listings, which make up 100% of the 38 active rentals. This indicates strong guest preference for privacy and space.
- Looking at the property type distribution in Sint Willibrordus, House properties are the most common (55.3%), reflecting the local real estate landscape.
- Houses represent a significant 55.3% portion, catering likely to families or larger groups.
- Smaller segments like outdoor/unique, hotel/boutique (combined 5.2%) offer potential for unique stay experiences.
Sint Willibrordus Airbnb Room Capacity Analysis (2025): Bedroom Distribution
Distribution of Listings by Number of Bedrooms
Room Capacity Insights for Sint Willibrordus
- The dominant room capacity in Sint Willibrordus is 1 bedroom listings, making up 28.9% of the market. This suggests a strong demand for properties suitable for couples or solo travelers.
- Together, 1 bedroom and 2 bedrooms properties represent 50.0% of the active Airbnb listings in Sint Willibrordus, indicating a high concentration in these sizes.
- A significant 44.8% of listings offer 3+ bedrooms, catering to larger groups and families seeking more space in Sint Willibrordus.
Sint Willibrordus Vacation Rental Guest Capacity Trends (2025)
Distribution of Listings by Guest Capacity
Guest Capacity Insights for Sint Willibrordus
- The most common guest capacity trend in Sint Willibrordus vacation rentals is listings accommodating 2 guests (34.2%). This suggests the primary traveler segment is likely couples or solo travelers.
- Properties designed for 2 guests and 8+ guests dominate the Sint Willibrordus STR market, accounting for 57.9% of listings.
- 42.1% of properties accommodate 6+ guests, serving the market segment for larger families or group travel in Sint Willibrordus.
- On average, properties in Sint Willibrordus are equipped to host 4.7 guests.
Sint Willibrordus Airbnb Booking Patterns (2025): Available vs. Booked Days
Available Days Distribution
Booked Days Distribution
Booking Pattern Insights for Sint Willibrordus
- The most common availability pattern in Sint Willibrordus falls within the 271-366 days range, representing 47.4% of listings. This suggests many properties have significant open periods on their calendars.
- Approximately 60.6% of listings show high availability (181+ days open annually), indicating potential for increased bookings or specific owner usage patterns.
- For booked days, the 181-270 days range is most frequent in Sint Willibrordus (31.6%), reflecting common guest stay durations or potential owner blocking patterns.
- A notable 42.1% of properties secure long booking periods (181+ days booked per year), highlighting successful long-term rental strategies or significant owner usage.
Sint Willibrordus Airbnb Minimum Stay Requirements Analysis
Distribution of Listings by Minimum Night Requirement
2 Nights
3 listings
8.1% of total
3 Nights
9 listings
24.3% of total
4-6 Nights
22 listings
59.5% of total
7-29 Nights
2 listings
5.4% of total
30+ Nights
1 listings
2.7% of total
Key Insights
- The most prevalent minimum stay requirement in Sint Willibrordus is 4-6 Nights, adopted by 59.5% of listings. This highlights the market's preference for longer commitments.
- Very short stays (1-2 nights) are less common (8.1%), suggesting hosts prefer slightly longer bookings to optimize turnover.
- Dedicated monthly rentals (30+ nights) represent a small niche (2.7%), possibly an untapped area for hosts.
Recommendations
- Align with the market by considering a 4-6 Nights minimum stay, as 59.5% of Sint Willibrordus hosts use this setting.
- Adjust minimum nights based on seasonality – potentially shorter during low season and longer during peak demand periods in Sint Willibrordus.
Sint Willibrordus Airbnb Cancellation Policy Trends Analysis (2025)
Flexible
9 listings
25.7% of total
Moderate
5 listings
14.3% of total
Firm
5 listings
14.3% of total
Strict
16 listings
45.7% of total
Cancellation Policy Insights for Sint Willibrordus
- The prevailing Airbnb cancellation policy trend in Sint Willibrordus is Strict, used by 45.7% of listings.
- A majority (60.0%) of hosts in Sint Willibrordus utilize Firm or Strict policies, indicating a market where hosts prioritize booking security.
Recommendations for Hosts
- Consider adopting a Strict policy to align with the 45.7% market standard in Sint Willibrordus.
- With 45.7% using Strict terms, this is a viable option in Sint Willibrordus, particularly for high-value properties or during peak demand periods.
- Regularly review your cancellation policy against competitors and market demand shifts in Sint Willibrordus.
Sint Willibrordus STR Booking Lead Time Analysis (2025)
Average Booking Lead Time by Month
Booking Lead Time Insights for Sint Willibrordus
- The overall average booking lead time for vacation rentals in Sint Willibrordus is 109 days.
- Guests book furthest in advance for stays during February (average 158 days), likely coinciding with peak travel demand or local events.
- The shortest booking windows occur for stays in September (average 85 days), indicating more last-minute travel plans during this time.
- Seasonally, Spring (137 days avg.) sees the longest lead times, while Summer (99 days avg.) has the shortest, reflecting typical travel planning cycles.
Recommendations for Hosts
- Use the overall average lead time (109 days) as a baseline for your pricing and availability strategy in Sint Willibrordus.
- For February stays, consider implementing length-of-stay discounts or slightly higher rates for bookings made less than 158 days out to capitalize on advance planning.
- Target marketing efforts for the Spring season well in advance (at least 137 days) to capture early planners.
- Monitor your own booking lead times against these Sint Willibrordus averages to identify opportunities for dynamic pricing adjustments.
Popular & Essential Airbnb Amenities in Sint Willibrordus (2025)
Amenity Prevalence
Amenity Insights for Sint Willibrordus
- Essential amenities in Sint Willibrordus that guests expect include: Kitchen, Wifi, Patio or balcony, Free parking on premises. Lacking these (any) could significantly impact bookings.
- Popular amenities like Air conditioning, Coffee maker, Essentials are common but not universal. Offering these can provide a competitive edge.
- A pool is a highly desired but not standard amenity, making it a key feature for attracting guests seeking leisure in Sint Willibrordus.
Recommendations for Hosts
- Ensure your listing includes all essential amenities for Sint Willibrordus: Kitchen, Wifi, Patio or balcony, Free parking on premises.
- Prioritize adding missing essentials: Patio or balcony, Free parking on premises.
- Consider adding popular differentiators like Air conditioning or Coffee maker to increase appeal.
- Highlight unique or less common amenities you offer (e.g., hot tub, dedicated workspace, EV charger) in your listing description and photos.
- Regularly check competitor amenities in Sint Willibrordus to stay competitive.
Sint Willibrordus Airbnb Guest Demographics & Profile Analysis (2025)
Guest Profile Summary for Sint Willibrordus
- The typical guest profile for Airbnb in Sint Willibrordus consists of predominantly international visitors (82%), with top international origins including Netherlands, typically belonging to the Post-2000s (Gen Z/Alpha) group (50%), primarily speaking English or Spanish.
- Domestic travelers account for 18.3% of guests.
- Key international markets include United States (44.4%) and Netherlands (18.3%).
- Top languages spoken are English (43.5%) followed by Spanish (13.6%).
- A significant demographic segment is the Post-2000s (Gen Z/Alpha) group, representing 50% of guests.
Recommendations for Hosts
- Focus marketing internationally, particularly towards travelers from Netherlands.
- Tailor amenities and listing descriptions to appeal to the dominant Post-2000s (Gen Z/Alpha) demographic (e.g., highlight fast WiFi, smart home features, local guides).
- Highlight unique local experiences or amenities relevant to the primary guest profile.
- Consider seasonal promotions aligned with peak travel times for key origin markets.
Nearby Short-Term Rental Market Comparison
How does the Sint Willibrordus Airbnb market stack up against its neighbors? Compare key performance metrics like average monthly revenue, ADR, and occupancy rates in surrounding areas to understand the broader regional STR landscape.
| Market | Active Properties | Monthly Revenue | Daily Rate | Avg. Occupancy |
|---|---|---|---|---|
| Malmok Beach | 71 | $9,777 | $607.02 | 52% |
| Punta Brabo | 255 | $5,574 | $391.14 | 57% |
| Savaneta | 59 | $4,567 | $280.63 | 57% |
| Sint Willibrordus | 49 | $4,428 | $379.53 | 50% |
| Tierra Del Sol | 157 | $4,238 | $319.37 | 52% |
| Catiri | 45 | $4,237 | $250.25 | 58% |
| West Punt | 525 | $4,156 | $296.54 | 52% |
| Bubali | 630 | $3,995 | $287.04 | 55% |
| San Nicolaas | 50 | $3,968 | $221.72 | 52% |
| Westpunt | 11 | $3,829 | $349.16 | 44% |