Monteroni d'Arbia Airbnb Market Analysis 2025: Short Term Rental Data & Vacation Rental Statistics in Tuscany, Italy
Is Airbnb profitable in Monteroni d'Arbia in 2025? Explore comprehensive Airbnb analytics for Monteroni d'Arbia, Tuscany, Italy to uncover income potential. This 2025 STR market report for Monteroni d'Arbia, based on AirROI data from April 2024 to March 2025, reveals key trends in the niche market of 105 active listings.
Whether you're considering an Airbnb investment in Monteroni d'Arbia, optimizing your existing vacation rental, or exploring rental arbitrage opportunities, understanding the Monteroni d'Arbia Airbnb data is crucial. Navigating the high regulation landscape is key to maximizing your short term rental income potential. Let's dive into the specifics.
Key Monteroni d'Arbia Airbnb Performance Metrics Overview
Monthly Airbnb Revenue Variations & Income Potential in Monteroni d'Arbia (2025)
Understanding the monthly revenue variations for Airbnb listings in Monteroni d'Arbia is key to maximizing your short term rental income potential. Seasonality significantly impacts earnings. Our analysis, based on data from the past 12 months, shows that the peak revenue month for STRs in Monteroni d'Arbia is typically August, while January often presents the lowest earnings, highlighting opportunities for strategic pricing adjustments during shoulder and low seasons. Explore the typical Airbnb income in Monteroni d'Arbia across different performance tiers:
- Best-in-class properties (Top 10%) achieve $6,346+ monthly, often utilizing dynamic pricing and superior guest experiences.
- Strong performing properties (Top 25%) earn $3,256 or more, indicating effective management and desirable locations/amenities.
- Typical properties (Median) generate around $1,587 per month, representing the average market performance.
- Entry-level properties (Bottom 25%) see earnings around $773, often with potential for optimization.
Average Monthly Airbnb Earnings Trend in Monteroni d'Arbia
Monteroni d'Arbia Airbnb Occupancy Rate Trends (2025)
Maximize your bookings by understanding the Monteroni d'Arbia STR occupancy trends. Seasonal demand shifts significantly influence how often properties are booked. Typically, Augustsees the highest demand (peak season occupancy), while January experiences the lowest (low season). Effective strategies, like adjusting minimum stays or offering promotions, can boost occupancy during slower periods. Here's how different property tiers perform in Monteroni d'Arbia:
- Best-in-class properties (Top 10%) achieve 76%+ occupancy, indicating high desirability and potentially optimized availability.
- Strong performing properties (Top 25%) maintain 56% or higher occupancy, suggesting good market fit and guest satisfaction.
- Typical properties (Median) have an occupancy rate around 33%.
- Entry-level properties (Bottom 25%) average 17% occupancy, potentially facing higher vacancy.
Average Monthly Occupancy Rate Trend in Monteroni d'Arbia
Average Daily Rate (ADR) Airbnb Trends in Monteroni d'Arbia (2025)
Effective short term rental pricing strategy in Monteroni d'Arbia involves understanding monthly ADR fluctuations. The Average Daily Rate (ADR) for Airbnb in Monteroni d'Arbia typically peaks in July and dips lowest during February. Leveraging Airbnb dynamic pricing tools or strategies based on this seasonality can significantly boost revenue. Here's a look at the typical nightly rates achieved:
- Best-in-class properties (Top 10%) command rates of $788+ per night, often due to premium features or locations.
- Strong performing properties (Top 25%) achieve nightly rates of $259 or more.
- Typical properties (Median) charge around $159 per night.
- Entry-level properties (Bottom 25%) earn around $107 per night.
Average Daily Rate (ADR) Trend by Month in Monteroni d'Arbia
Get Live Monteroni d'Arbia Market Intelligence 👇

Explore Real-time Analytics
Airbnb Seasonality Analysis & Trends in Monteroni d'Arbia (2025)
Peak Season (August, July, September)
- Revenue averages $4,450 per month
- Occupancy rates average 54.9%
- Daily rates average $331
Shoulder Season
- Revenue averages $3,163 per month
- Occupancy maintains around 34.6%
- Daily rates hold near $312
Low Season (January, November, December)
- Revenue drops to average $2,038 per month
- Occupancy decreases to average 26.2%
- Daily rates adjust to average $288
Seasonality Insights for Monteroni d'Arbia
- The Airbnb seasonality in Monteroni d'Arbia shows highly seasonal trends requiring careful strategy. While the sections above show seasonal averages, it's also insightful to look at the extremes:
- During the high season, the absolute peak month showcases Monteroni d'Arbia's highest earning potential, with monthly revenues capable of climbing to $4,938, occupancy reaching a high of 60.1%, and ADRs peaking at $334.
- Conversely, the slowest single month of the year, typically falling within the low season, marks the market's lowest point. In this month, revenue might dip to $1,839, occupancy could drop to 18.3%, and ADRs may adjust down to $284.
- Understanding both the seasonal averages and these monthly peaks and troughs in revenue, occupancy, and ADR is crucial for maximizing your Airbnb profit potential in Monteroni d'Arbia.
Seasonal Strategies for Maximizing Profit
- Peak Season: Maximize revenue through premium pricing and potentially longer minimum stays. Ensure high availability.
- Low Season: Offer competitive pricing, special promotions (e.g., extended stay discounts), and flexible cancellation policies. Target off-season travelers like remote workers or budget-conscious guests.
- Shoulder Seasons: Implement dynamic pricing that balances peak and low rates. Target weekend travelers or specific events. Offer slightly more flexible terms than peak season.
- Regularly analyze your own performance against these Monteroni d'Arbia seasonality benchmarks and adjust your pricing and availability strategy accordingly.
Best Areas for Airbnb Investment in Monteroni d'Arbia (2025)
Exploring the top neighborhoods for short-term rentals in Monteroni d'Arbia? This section highlights key areas, outlining why they are attractive for hosts and guests, along with notable local attractions. Consider these locations based on your target guest profile and investment strategy.
| Neighborhood / Area | Why Host Here? (Target Guests & Appeal) | Key Attractions & Landmarks |
|---|---|---|
| Monteroni d'Arbia Historical Center | The historical center offers charming streets and ancient architecture, attracting visitors interested in culture and history. It serves as a great base for exploring Tuscany. | San Giovanni Battista Church, Piazza della Libertà, Historic Villas, Local markets, Nearby vineyards |
| Val d'Arbia | A scenic area surrounding Monteroni d'Arbia, known for its beautiful countryside and the potential for agritourism. It's ideal for guests wanting to experience rural Tuscany. | Agriturismi, Vineyards, Hiking trails, Local farms, Beautiful landscapes |
| Crete Senesi | Famous for its unique clay hills and beautiful landscapes, this area attracts nature lovers and photographers looking for picturesque settings for their stay. | Breathtaking viewpoints, Nature parks, Traditional farmhouses, Local cuisine, Outdoor activities |
| San Rocco a Pilli | A nearby village that offers a calm and authentic Tuscan experience, perfect for families and those who prefer staying in quieter locations. | Local restaurants, Parks, Traditional festivals, Cultural events, Friendly locals |
| Nearby wineries | Monteroni is close to several renowned wineries, making it a great spot for wine enthusiasts who want to enjoy tastings and vineyard tours. | Wine tastings, Vineyard tours, Cooking classes, Wine festivals, Local wine shops |
| Siena Highway Access | Proximity to major highways makes it convenient for travelers wishing to explore larger Tuscany such as Siena, Florence, and surrounding towns. | Easy access to Siena, Nearby attractions, Transport links for day trips, Scenic drives, Tourist information centers |
| Local Events Venues | Hosting events and gatherings, such as weddings and retreats, appeals to guests looking for a venue in a rustic, beautiful setting. | Event spaces, Booking services for events, Beautiful surroundings, Local catering, Weddings |
| Tuscany Cycling Routes | Known for its cycling paths, attracting outdoor enthusiasts and tourists looking for active vacations amidst beautiful landscapes. | Cycling paths, Bike rental shops, Scenic views, Cycling events, Communities of cyclists |
Understanding Airbnb License Requirements & STR Laws in Monteroni d'Arbia (2025)
Yes, Monteroni d'Arbia, Tuscany, Italy enforces high STR regulations. Obtaining a license and ensuring compliance is almost certainly required according to current 2025 STR laws. Always verify the latest short term rental regulations and Airbnb license requirements directly with local government authorities for Monteroni d'Arbia to ensure full compliance before hosting.
(Source: AirROI data, 2025, based on 70% licensed listings)
Top Performing Airbnb Properties in Monteroni d'Arbia (2025)
Benchmark your potential! Explore examples of top-performing Airbnb properties in Monteroni d'Arbiabased on Trailing Twelve Month (TTM) revenue. Analyze their characteristics, revenue, occupancy rate, and ADR to understand what drives success in this market.
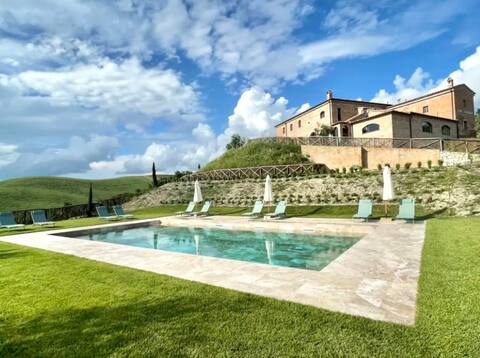
Beautiful 8 bedroom Tuscan villa with private pool
Entire Place • 8 bedrooms
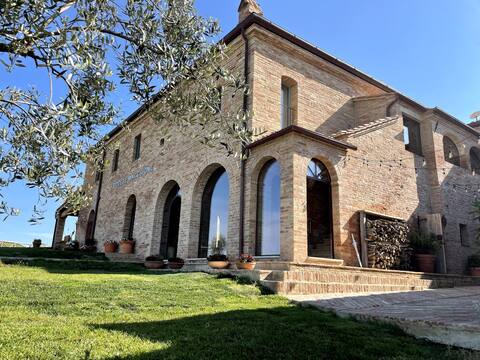
Beautiful 5 bedroom Tuscan Villa
Entire Place • 5 bedrooms
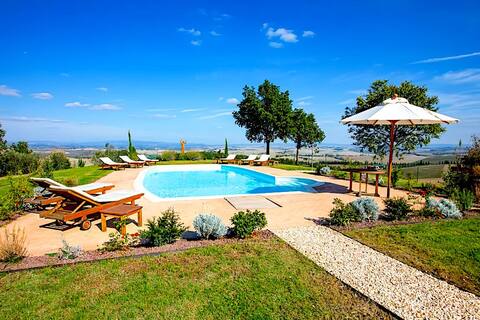
Private Villa near Siena - Exclusive Spa,Gym,Pool
Entire Place • 6 bedrooms
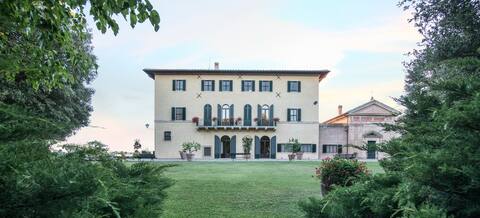
Villa Curiano
Entire Place • 7 bedrooms
Villa del XIII secolo
Entire Place • 5 bedrooms
San Giovanni in Poggio, villa Meriggio 95sqm
Entire Place • 2 bedrooms
Note: Performance varies based on location, size, amenities, seasonality, and management quality. Data reflects the past 12 months.
Top Performing Airbnb Hosts in Monteroni d'Arbia (2025)
Learn from the best! This table showcases top-performing Airbnb hosts in Monteroni d'Arbia based on the number of properties managed and estimated total revenue over the past year. Analyze their scale and performance metrics.
| Host Name | Properties | Grossing Revenue | Stay Reviews | Avg Rating |
|---|---|---|---|---|
| Caroline | 2 | $391,905 | 14 | 2.50/5.0 |
| San Giovanni In Poggio | 5 | $276,174 | 289 | 4.93/5.0 |
| Marta | 4 | $186,401 | 611 | 4.94/5.0 |
| Ugo | 1 | $134,227 | 37 | 4.81/5.0 |
| Benedetto | 7 | $120,994 | 317 | 4.85/5.0 |
| Isabella | 1 | $109,619 | 4 | 5.00/5.0 |
| Jacopo | 3 | $99,410 | 15 | 3.33/5.0 |
| Enrichetta | 7 | $95,512 | 194 | 4.74/5.0 |
| Host #494075778 | 1 | $87,792 | 7 | 4.86/5.0 |
| Host #169649113 | 2 | $78,159 | 0 | 0.00/5.0 |
Analyzing the strategies of top hosts, such as their property selection, pricing, and guest communication, can offer valuable lessons for optimizing your own Airbnb operations in Monteroni d'Arbia.
Dive Deeper: Advanced Monteroni d'Arbia STR Market Data (2025)
Ready to unlock more insights? AirROI provides access to advanced metrics and comprehensive Airbnb data for Monteroni d'Arbia. Explore detailed analytics beyond this report to refine your investment strategy, optimize pricing, and maximize your vacation rental profits.
Explore Advanced MetricsMonteroni d'Arbia Short-Term Rental Market Composition (2025): Property & Room Types
Room Type Distribution
Property Type Distribution
Market Composition Insights for Monteroni d'Arbia
- The Monteroni d'Arbia Airbnb market composition is heavily skewed towards Entire Home/Apt listings, which make up 82.9% of the 105 active rentals. This indicates strong guest preference for privacy and space.
- Looking at the property type distribution in Monteroni d'Arbia, Apartment/Condo properties are the most common (46.7%), reflecting the local real estate landscape.
- Houses represent a significant 33.3% portion, catering likely to families or larger groups.
- The presence of 5.7% Hotel/Boutique listings indicates integration with traditional hospitality.
- Smaller segments like unique stays (combined 3.8%) offer potential for unique stay experiences.
Monteroni d'Arbia Airbnb Room Capacity Analysis (2025): Bedroom Distribution
Distribution of Listings by Number of Bedrooms
Room Capacity Insights for Monteroni d'Arbia
- The dominant room capacity in Monteroni d'Arbia is 2 bedrooms listings, making up 35.2% of the market. This suggests a strong demand for properties suitable for couples or solo travelers.
- Together, 2 bedrooms and 1 bedroom properties represent 59.0% of the active Airbnb listings in Monteroni d'Arbia, indicating a high concentration in these sizes.
- A significant 27.7% of listings offer 3+ bedrooms, catering to larger groups and families seeking more space in Monteroni d'Arbia.
Monteroni d'Arbia Vacation Rental Guest Capacity Trends (2025)
Distribution of Listings by Guest Capacity
Guest Capacity Insights for Monteroni d'Arbia
- The most common guest capacity trend in Monteroni d'Arbia vacation rentals is listings accommodating 4 guests (22.9%). This suggests the primary traveler segment is likely small families or groups.
- Properties designed for 4 guests and 2 guests dominate the Monteroni d'Arbia STR market, accounting for 41.0% of listings.
- 30.5% of properties accommodate 6+ guests, serving the market segment for larger families or group travel in Monteroni d'Arbia.
- On average, properties in Monteroni d'Arbia are equipped to host 4.1 guests.
Monteroni d'Arbia Airbnb Booking Patterns (2025): Available vs. Booked Days
Available Days Distribution
Booked Days Distribution
Booking Pattern Insights for Monteroni d'Arbia
- The most common availability pattern in Monteroni d'Arbia falls within the 271-366 days range, representing 58.1% of listings. This suggests many properties have significant open periods on their calendars.
- Approximately 83.8% of listings show high availability (181+ days open annually), indicating potential for increased bookings or specific owner usage patterns.
- For booked days, the 31-90 days range is most frequent in Monteroni d'Arbia (32.4%), reflecting common guest stay durations or potential owner blocking patterns.
- A notable 16.2% of properties secure long booking periods (181+ days booked per year), highlighting successful long-term rental strategies or significant owner usage.
Monteroni d'Arbia Airbnb Minimum Stay Requirements Analysis
Distribution of Listings by Minimum Night Requirement
1 Night
12 listings
12.1% of total
2 Nights
21 listings
21.2% of total
3 Nights
20 listings
20.2% of total
4-6 Nights
16 listings
16.2% of total
7-29 Nights
9 listings
9.1% of total
30+ Nights
21 listings
21.2% of total
Key Insights
- The most prevalent minimum stay requirement in Monteroni d'Arbia is 2 Nights, adopted by 21.2% of listings. This highlights the market's preference for shorter, flexible bookings.
- A significant segment (21.2%) caters to monthly stays (30+ nights) in Monteroni d'Arbia, pointing to opportunities in the extended-stay market.
Recommendations
- Align with the market by considering a 2 Nights minimum stay, as 21.2% of Monteroni d'Arbia hosts use this setting.
- If feasible, allowing 1-night stays, especially midweek or during low season, could capture last-minute bookings, as only 12.1% currently do.
- Explore offering discounts for stays of 30+ nights to attract the 21.2% of the market seeking extended stays.
- Adjust minimum nights based on seasonality – potentially shorter during low season and longer during peak demand periods in Monteroni d'Arbia.
Monteroni d'Arbia Airbnb Cancellation Policy Trends Analysis (2025)
Super Strict 60 Days
4 listings
4.3% of total
Flexible
18 listings
19.4% of total
Moderate
47 listings
50.5% of total
Strict
24 listings
25.8% of total
Cancellation Policy Insights for Monteroni d'Arbia
- The prevailing Airbnb cancellation policy trend in Monteroni d'Arbia is Moderate, used by 50.5% of listings.
- There's a relatively balanced mix between guest-friendly (69.9%) and stricter (25.8%) policies, offering choices for different guest needs.
Recommendations for Hosts
- Consider adopting a Moderate policy to align with the 50.5% market standard in Monteroni d'Arbia.
- Regularly review your cancellation policy against competitors and market demand shifts in Monteroni d'Arbia.
Monteroni d'Arbia STR Booking Lead Time Analysis (2025)
Average Booking Lead Time by Month
Booking Lead Time Insights for Monteroni d'Arbia
- The overall average booking lead time for vacation rentals in Monteroni d'Arbia is 85 days.
- Guests book furthest in advance for stays during June (average 114 days), likely coinciding with peak travel demand or local events.
- The shortest booking windows occur for stays in January (average 38 days), indicating more last-minute travel plans during this time.
- Seasonally, Summer (103 days avg.) sees the longest lead times, while Winter (45 days avg.) has the shortest, reflecting typical travel planning cycles.
Recommendations for Hosts
- Use the overall average lead time (85 days) as a baseline for your pricing and availability strategy in Monteroni d'Arbia.
- For June stays, consider implementing length-of-stay discounts or slightly higher rates for bookings made less than 114 days out to capitalize on advance planning.
- Target marketing efforts for the Summer season well in advance (at least 103 days) to capture early planners.
- Monitor your own booking lead times against these Monteroni d'Arbia averages to identify opportunities for dynamic pricing adjustments.
Popular & Essential Airbnb Amenities in Monteroni d'Arbia (2025)
Amenity Prevalence
Amenity Insights for Monteroni d'Arbia
- Essential amenities in Monteroni d'Arbia that guests expect include: Wifi. Lacking these (this) could significantly impact bookings.
- Popular amenities like Free parking on premises, Heating, Essentials are common but not universal. Offering these can provide a competitive edge.
Recommendations for Hosts
- Ensure your listing includes all essential amenities for Monteroni d'Arbia: Wifi.
- Prioritize adding missing essentials: Wifi.
- Consider adding popular differentiators like Free parking on premises or Heating to increase appeal.
- Highlight unique or less common amenities you offer (e.g., hot tub, dedicated workspace, EV charger) in your listing description and photos.
- Regularly check competitor amenities in Monteroni d'Arbia to stay competitive.
Monteroni d'Arbia Airbnb Guest Demographics & Profile Analysis (2025)
Guest Profile Summary for Monteroni d'Arbia
- The typical guest profile for Airbnb in Monteroni d'Arbia consists of predominantly international visitors (92%), with top international origins including Germany, typically belonging to the Post-2000s (Gen Z/Alpha) group (50%), primarily speaking English or French.
- Domestic travelers account for 8.4% of guests.
- Key international markets include United States (24.5%) and Germany (10.8%).
- Top languages spoken are English (45%) followed by French (10.2%).
- A significant demographic segment is the Post-2000s (Gen Z/Alpha) group, representing 50% of guests.
Recommendations for Hosts
- Focus marketing internationally, particularly towards travelers from Germany.
- Tailor amenities and listing descriptions to appeal to the dominant Post-2000s (Gen Z/Alpha) demographic (e.g., highlight fast WiFi, smart home features, local guides).
- Highlight unique local experiences or amenities relevant to the primary guest profile.
- Consider seasonal promotions aligned with peak travel times for key origin markets.
Nearby Short-Term Rental Market Comparison
How does the Monteroni d'Arbia Airbnb market stack up against its neighbors? Compare key performance metrics like average monthly revenue, ADR, and occupancy rates in surrounding areas to understand the broader regional STR landscape.
| Market | Active Properties | Monthly Revenue | Daily Rate | Avg. Occupancy |
|---|---|---|---|---|
| Crespina | 16 | $3,526 | $493.64 | 48% |
| Tignano | 10 | $3,391 | $500.31 | 36% |
| Luni Mare | 11 | $3,102 | $169.59 | 40% |
| Buonconvento | 59 | $3,068 | $456.70 | 46% |
| Castelfranco di Sotto | 47 | $2,881 | $294.54 | 38% |
| Collazzone | 28 | $2,839 | $341.11 | 36% |
| Florence | 9,598 | $2,833 | $208.48 | 52% |
| Marcialla | 25 | $2,788 | $236.61 | 54% |
| Parrano | 18 | $2,762 | $329.95 | 34% |
| Impruneta | 131 | $2,761 | $237.93 | 45% |