Monforte d'Alba Airbnb Market Analysis 2025: Short Term Rental Data & Vacation Rental Statistics in Piedmont, Italy
Is Airbnb profitable in Monforte d'Alba in 2025? Explore comprehensive Airbnb analytics for Monforte d'Alba, Piedmont, Italy to uncover income potential. This 2025 STR market report for Monforte d'Alba, based on AirROI data from April 2024 to March 2025, reveals key trends in the niche market of 70 active listings.
Whether you're considering an Airbnb investment in Monforte d'Alba, optimizing your existing vacation rental, or exploring rental arbitrage opportunities, understanding the Monforte d'Alba Airbnb data is crucial. Navigating the high regulation landscape is key to maximizing your short term rental income potential. Let's dive into the specifics.
Key Monforte d'Alba Airbnb Performance Metrics Overview
Monthly Airbnb Revenue Variations & Income Potential in Monforte d'Alba (2025)
Understanding the monthly revenue variations for Airbnb listings in Monforte d'Alba is key to maximizing your short term rental income potential. Seasonality significantly impacts earnings. Our analysis, based on data from the past 12 months, shows that the peak revenue month for STRs in Monforte d'Alba is typically July, while February often presents the lowest earnings, highlighting opportunities for strategic pricing adjustments during shoulder and low seasons. Explore the typical Airbnb income in Monforte d'Alba across different performance tiers:
- Best-in-class properties (Top 10%) achieve $4,066+ monthly, often utilizing dynamic pricing and superior guest experiences.
- Strong performing properties (Top 25%) earn $2,356 or more, indicating effective management and desirable locations/amenities.
- Typical properties (Median) generate around $1,207 per month, representing the average market performance.
- Entry-level properties (Bottom 25%) see earnings around $671, often with potential for optimization.
Average Monthly Airbnb Earnings Trend in Monforte d'Alba
Monforte d'Alba Airbnb Occupancy Rate Trends (2025)
Maximize your bookings by understanding the Monforte d'Alba STR occupancy trends. Seasonal demand shifts significantly influence how often properties are booked. Typically, Augustsees the highest demand (peak season occupancy), while February experiences the lowest (low season). Effective strategies, like adjusting minimum stays or offering promotions, can boost occupancy during slower periods. Here's how different property tiers perform in Monforte d'Alba:
- Best-in-class properties (Top 10%) achieve 70%+ occupancy, indicating high desirability and potentially optimized availability.
- Strong performing properties (Top 25%) maintain 49% or higher occupancy, suggesting good market fit and guest satisfaction.
- Typical properties (Median) have an occupancy rate around 31%.
- Entry-level properties (Bottom 25%) average 17% occupancy, potentially facing higher vacancy.
Average Monthly Occupancy Rate Trend in Monforte d'Alba
Average Daily Rate (ADR) Airbnb Trends in Monforte d'Alba (2025)
Effective short term rental pricing strategy in Monforte d'Alba involves understanding monthly ADR fluctuations. The Average Daily Rate (ADR) for Airbnb in Monforte d'Alba typically peaks in November and dips lowest during April. Leveraging Airbnb dynamic pricing tools or strategies based on this seasonality can significantly boost revenue. Here's a look at the typical nightly rates achieved:
- Best-in-class properties (Top 10%) command rates of $315+ per night, often due to premium features or locations.
- Strong performing properties (Top 25%) achieve nightly rates of $174 or more.
- Typical properties (Median) charge around $118 per night.
- Entry-level properties (Bottom 25%) earn around $95 per night.
Average Daily Rate (ADR) Trend by Month in Monforte d'Alba
Get Live Monforte d'Alba Market Intelligence 👇

Explore Real-time Analytics
Airbnb Seasonality Analysis & Trends in Monforte d'Alba (2025)
Peak Season (July, August, November)
- Revenue averages $2,785 per month
- Occupancy rates average 44.4%
- Daily rates average $217
Shoulder Season
- Revenue averages $2,007 per month
- Occupancy maintains around 34.3%
- Daily rates hold near $211
Low Season (January, February, March)
- Revenue drops to average $1,161 per month
- Occupancy decreases to average 27.8%
- Daily rates adjust to average $216
Seasonality Insights for Monforte d'Alba
- The Airbnb seasonality in Monforte d'Alba shows highly seasonal trends requiring careful strategy. While the sections above show seasonal averages, it's also insightful to look at the extremes:
- During the high season, the absolute peak month showcases Monforte d'Alba's highest earning potential, with monthly revenues capable of climbing to $3,358, occupancy reaching a high of 48.8%, and ADRs peaking at $233.
- Conversely, the slowest single month of the year, typically falling within the low season, marks the market's lowest point. In this month, revenue might dip to $785, occupancy could drop to 23.4%, and ADRs may adjust down to $206.
- Understanding both the seasonal averages and these monthly peaks and troughs in revenue, occupancy, and ADR is crucial for maximizing your Airbnb profit potential in Monforte d'Alba.
Seasonal Strategies for Maximizing Profit
- Peak Season: Maximize revenue through premium pricing and potentially longer minimum stays. Ensure high availability.
- Low Season: Offer competitive pricing, special promotions (e.g., extended stay discounts), and flexible cancellation policies. Target off-season travelers like remote workers or budget-conscious guests.
- Shoulder Seasons: Implement dynamic pricing that balances peak and low rates. Target weekend travelers or specific events. Offer slightly more flexible terms than peak season.
- Regularly analyze your own performance against these Monforte d'Alba seasonality benchmarks and adjust your pricing and availability strategy accordingly.
Best Areas for Airbnb Investment in Monforte d'Alba (2025)
Exploring the top neighborhoods for short-term rentals in Monforte d'Alba? This section highlights key areas, outlining why they are attractive for hosts and guests, along with notable local attractions. Consider these locations based on your target guest profile and investment strategy.
| Neighborhood / Area | Why Host Here? (Target Guests & Appeal) | Key Attractions & Landmarks |
|---|---|---|
| Centro Storico | The historic center of Monforte d'Alba, known for its charming streets, rich history, and local culture. A top destination for tourists interested in exploring the local tradition and historic sites. | Piazza Martiri, Church of San Francesco, Castello di Monforte, Wine cellars, Local restaurants |
| Langhe Region | Famous for its picturesque vineyards and rolling hills, the Langhe region is perfect for wine tourism. It's popular with visitors looking to explore wineries and enjoy the stunning scenery. | Vineyard tours, Tastings at renowned wineries, Barolo Wine Museum, Truffle hunting experiences, Scenic viewpoints |
| Neive | A nearby town that offers a quaint atmosphere and access to wine-producing areas. It attracts visitors looking for a peaceful experience coupled with excellent wine offerings. | Historic old town, Wine tasting experiences, Local festivals, Charming cafes, Scenic walks |
| Barolo | Known worldwide for its Barolo wine, this area draws wine enthusiasts and tourists eager to explore vineyards and taste the local specialty. | Barolo Castle, Wine cellars, Vigna del Sorbo vineyard, Barolo wine museum, Gastronomic restaurants |
| Grinzane Cavour | Another key area for wine tourism, hosting the annual wine festival and featuring a UNESCO World Heritage site. A great spot for visitors interested in culinary experiences. | Grinzane Cavour Castle, Wine festival, Local cuisine, Hiking trails, Wine tasting rooms |
| Serralunga d'Alba | Known for its medieval castle and beautiful vineyard scenery, this area is a draw for tourists interested in history and wine culture. | Serralunga d'Alba Castle, Vineyard tours, Nature walks, Local wineries, Authentic Piedmontese cuisine |
| Diano d'Alba | A small town that provides easy access to the surrounding vineyards and picturesque landscapes. It caters to travelers looking for a more rural or authentic experience. | Local markets, Historical architecture, Close proximity to vineyards, Agriturismos, Tranquil scenery |
| Cortemilia | Famous for its hazelnuts and picturesque landscapes, this location attracts those interested in gastronomy and outdoor activities. | Hazelnut festivals, Hiking in the surrounding hills, Culinary workshops, Historical sites, Local delicacies |
Understanding Airbnb License Requirements & STR Laws in Monforte d'Alba (2025)
Yes, Monforte d'Alba, Piedmont, Italy enforces high STR regulations. Obtaining a license and ensuring compliance is almost certainly required according to current 2025 STR laws. Always verify the latest short term rental regulations and Airbnb license requirements directly with local government authorities for Monforte d'Alba to ensure full compliance before hosting.
(Source: AirROI data, 2025, based on 67% licensed listings)
Top Performing Airbnb Properties in Monforte d'Alba (2025)
Benchmark your potential! Explore examples of top-performing Airbnb properties in Monforte d'Albabased on Trailing Twelve Month (TTM) revenue. Analyze their characteristics, revenue, occupancy rate, and ADR to understand what drives success in this market.
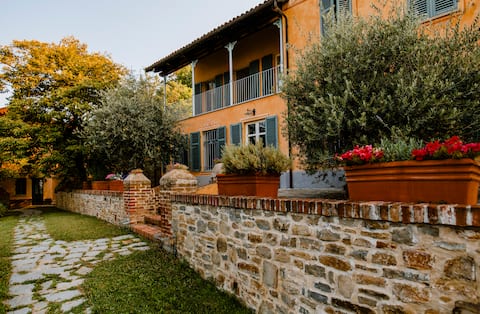
Villa Coste di Monforte D’Alba
Entire Place • 3 bedrooms

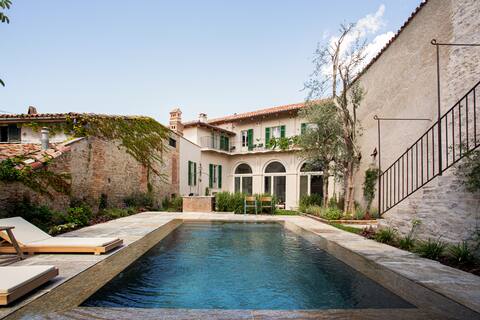
Monforte - Byhus 230m2 - Privat pool - I centrum
Entire Place • 3 bedrooms
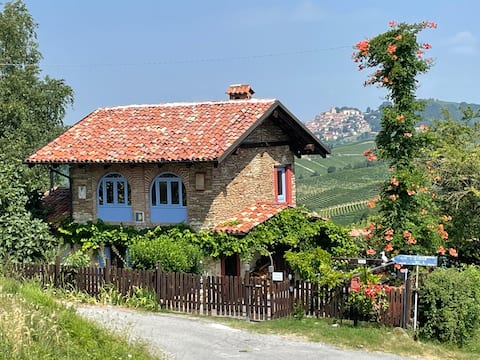
Villa Biancospino - Langhe
Entire Place • 1 bedroom
Casa MON - lo spirito autentico delle Langhe.
Entire Place • N/A

The View from Heaven
Entire Place • 2 bedrooms
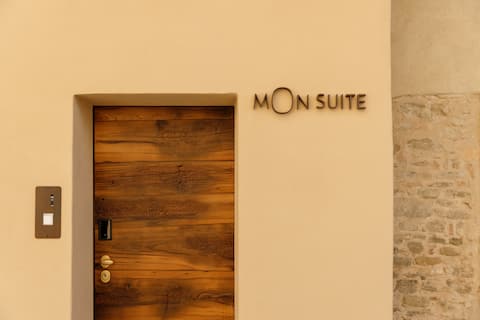
Welcome to MON SUITE
Entire Place • 2 bedrooms
Note: Performance varies based on location, size, amenities, seasonality, and management quality. Data reflects the past 12 months.
Top Performing Airbnb Hosts in Monforte d'Alba (2025)
Learn from the best! This table showcases top-performing Airbnb hosts in Monforte d'Alba based on the number of properties managed and estimated total revenue over the past year. Analyze their scale and performance metrics.
| Host Name | Properties | Grossing Revenue | Stay Reviews | Avg Rating |
|---|---|---|---|---|
| Kasia | 2 | $120,670 | 4 | 2.50/5.0 |
| Eugenia | 1 | $103,578 | 39 | 4.90/5.0 |
| Chiara | 4 | $96,795 | 218 | 4.86/5.0 |
| Henrik | 1 | $67,034 | 22 | 5.00/5.0 |
| Giulia | 1 | $66,439 | 24 | 4.92/5.0 |
| Gayle | 1 | $62,496 | 16 | 5.00/5.0 |
| Tatiana | 2 | $60,853 | 17 | 4.78/5.0 |
| Alberto | 3 | $57,401 | 21 | 3.29/5.0 |
| Rocca | 3 | $46,939 | 15 | 3.23/5.0 |
| Host #14621212 | 4 | $46,102 | 0 | 0.00/5.0 |
Analyzing the strategies of top hosts, such as their property selection, pricing, and guest communication, can offer valuable lessons for optimizing your own Airbnb operations in Monforte d'Alba.
Dive Deeper: Advanced Monforte d'Alba STR Market Data (2025)
Ready to unlock more insights? AirROI provides access to advanced metrics and comprehensive Airbnb data for Monforte d'Alba. Explore detailed analytics beyond this report to refine your investment strategy, optimize pricing, and maximize your vacation rental profits.
Explore Advanced MetricsMonforte d'Alba Short-Term Rental Market Composition (2025): Property & Room Types
Room Type Distribution
Property Type Distribution
Market Composition Insights for Monforte d'Alba
- The Monforte d'Alba Airbnb market composition is heavily skewed towards Entire Home/Apt listings, which make up 92.9% of the 70 active rentals. This indicates strong guest preference for privacy and space.
- Looking at the property type distribution in Monforte d'Alba, Apartment/Condo properties are the most common (60%), reflecting the local real estate landscape.
- Houses represent a significant 34.3% portion, catering likely to families or larger groups.
- Smaller segments like hotel/boutique, unique stays, others (combined 5.7%) offer potential for unique stay experiences.
Monforte d'Alba Airbnb Room Capacity Analysis (2025): Bedroom Distribution
Distribution of Listings by Number of Bedrooms
Room Capacity Insights for Monforte d'Alba
- The dominant room capacity in Monforte d'Alba is 1 bedroom listings, making up 45.7% of the market. This suggests a strong demand for properties suitable for couples or solo travelers.
- Together, 1 bedroom and 2 bedrooms properties represent 88.6% of the active Airbnb listings in Monforte d'Alba, indicating a high concentration in these sizes.
- Listings with 3+ bedrooms (7.2%) represent a smaller niche, potentially indicating an underserved market for larger group accommodations in Monforte d'Alba.
Monforte d'Alba Vacation Rental Guest Capacity Trends (2025)
Distribution of Listings by Guest Capacity
Guest Capacity Insights for Monforte d'Alba
- The most common guest capacity trend in Monforte d'Alba vacation rentals is listings accommodating 4 guests (44.3%). This suggests the primary traveler segment is likely small families or groups.
- Properties designed for 4 guests and 2 guests dominate the Monforte d'Alba STR market, accounting for 61.4% of listings.
- 21.4% of properties accommodate 6+ guests, serving the market segment for larger families or group travel in Monforte d'Alba.
- On average, properties in Monforte d'Alba are equipped to host 4.2 guests.
Monforte d'Alba Airbnb Booking Patterns (2025): Available vs. Booked Days
Available Days Distribution
Booked Days Distribution
Booking Pattern Insights for Monforte d'Alba
- The most common availability pattern in Monforte d'Alba falls within the 271-366 days range, representing 57.1% of listings. This suggests many properties have significant open periods on their calendars.
- Approximately 82.8% of listings show high availability (181+ days open annually), indicating potential for increased bookings or specific owner usage patterns.
- For booked days, the 31-90 days range is most frequent in Monforte d'Alba (41.4%), reflecting common guest stay durations or potential owner blocking patterns.
- A notable 18.6% of properties secure long booking periods (181+ days booked per year), highlighting successful long-term rental strategies or significant owner usage.
Monforte d'Alba Airbnb Minimum Stay Requirements Analysis
Distribution of Listings by Minimum Night Requirement
1 Night
13 listings
19.1% of total
2 Nights
28 listings
41.2% of total
3 Nights
5 listings
7.4% of total
4-6 Nights
4 listings
5.9% of total
7-29 Nights
7 listings
10.3% of total
30+ Nights
11 listings
16.2% of total
Key Insights
- The most prevalent minimum stay requirement in Monforte d'Alba is 2 Nights, adopted by 41.2% of listings. This highlights the market's preference for shorter, flexible bookings.
- A strong majority (60.3%) of the Monforte d'Alba Airbnb data shows acceptance of very short stays (1-2 nights), indicating a dynamic, high-turnover market.
- A significant segment (16.2%) caters to monthly stays (30+ nights) in Monforte d'Alba, pointing to opportunities in the extended-stay market.
Recommendations
- Align with the market by considering a 2 Nights minimum stay, as 41.2% of Monforte d'Alba hosts use this setting.
- If feasible, allowing 1-night stays, especially midweek or during low season, could capture last-minute bookings, as only 19.1% currently do.
- A 2-night minimum appears standard (41.2%). Consider this for weekends or peak periods.
- Explore offering discounts for stays of 30+ nights to attract the 16.2% of the market seeking extended stays.
- Adjust minimum nights based on seasonality – potentially shorter during low season and longer during peak demand periods in Monforte d'Alba.
Monforte d'Alba Airbnb Cancellation Policy Trends Analysis (2025)
Super Strict 30 Days
1 listings
1.7% of total
Flexible
21 listings
36.2% of total
Moderate
32 listings
55.2% of total
Strict
4 listings
6.9% of total
Cancellation Policy Insights for Monforte d'Alba
- The prevailing Airbnb cancellation policy trend in Monforte d'Alba is Moderate, used by 55.2% of listings.
- The market strongly favors guest-friendly terms, with 91.4% of listings offering Flexible or Moderate policies. This suggests guests in Monforte d'Alba may expect booking flexibility.
- Strict cancellation policies are quite rare (6.9%), potentially making listings with this policy less competitive unless justified by high demand or property type.
Recommendations for Hosts
- Consider adopting a Moderate policy to align with the 55.2% market standard in Monforte d'Alba.
- Using a Strict policy might deter some guests, as only 6.9% of listings use it. Evaluate if potential revenue protection outweighs possible lower booking rates.
- Regularly review your cancellation policy against competitors and market demand shifts in Monforte d'Alba.
Monforte d'Alba STR Booking Lead Time Analysis (2025)
Average Booking Lead Time by Month
Booking Lead Time Insights for Monforte d'Alba
- The overall average booking lead time for vacation rentals in Monforte d'Alba is 56 days.
- Guests book furthest in advance for stays during May (average 105 days), likely coinciding with peak travel demand or local events.
- The shortest booking windows occur for stays in December (average 35 days), indicating more last-minute travel plans during this time.
- Seasonally, Spring (77 days avg.) sees the longest lead times, while Winter (38 days avg.) has the shortest, reflecting typical travel planning cycles.
Recommendations for Hosts
- Use the overall average lead time (56 days) as a baseline for your pricing and availability strategy in Monforte d'Alba.
- For May stays, consider implementing length-of-stay discounts or slightly higher rates for bookings made less than 105 days out to capitalize on advance planning.
- Target marketing efforts for the Spring season well in advance (at least 77 days) to capture early planners.
- Monitor your own booking lead times against these Monforte d'Alba averages to identify opportunities for dynamic pricing adjustments.
Popular & Essential Airbnb Amenities in Monforte d'Alba (2025)
Amenity Prevalence
Amenity Insights for Monforte d'Alba
- Essential amenities in Monforte d'Alba that guests expect include: Heating, Wifi. Lacking these (any) could significantly impact bookings.
- Popular amenities like Kitchen, Essentials, Hangers are common but not universal. Offering these can provide a competitive edge.
Recommendations for Hosts
- Ensure your listing includes all essential amenities for Monforte d'Alba: Heating, Wifi.
- Prioritize adding missing essentials: Heating, Wifi.
- Consider adding popular differentiators like Kitchen or Essentials to increase appeal.
- Highlight unique or less common amenities you offer (e.g., hot tub, dedicated workspace, EV charger) in your listing description and photos.
- Regularly check competitor amenities in Monforte d'Alba to stay competitive.
Monforte d'Alba Airbnb Guest Demographics & Profile Analysis (2025)
Guest Profile Summary for Monforte d'Alba
- The typical guest profile for Airbnb in Monforte d'Alba consists of predominantly international visitors (80%), with top international origins including United States, typically belonging to the Post-2000s (Gen Z/Alpha) group (50%), primarily speaking English or French.
- Domestic travelers account for 19.9% of guests.
- Key international markets include Italy (19.9%) and United States (14.3%).
- Top languages spoken are English (38.8%) followed by French (13.6%).
- A significant demographic segment is the Post-2000s (Gen Z/Alpha) group, representing 50% of guests.
Recommendations for Hosts
- Focus marketing internationally, particularly towards travelers from United States.
- Tailor amenities and listing descriptions to appeal to the dominant Post-2000s (Gen Z/Alpha) demographic (e.g., highlight fast WiFi, smart home features, local guides).
- Highlight unique local experiences or amenities relevant to the primary guest profile.
- Consider seasonal promotions aligned with peak travel times for key origin markets.
Nearby Short-Term Rental Market Comparison
How does the Monforte d'Alba Airbnb market stack up against its neighbors? Compare key performance metrics like average monthly revenue, ADR, and occupancy rates in surrounding areas to understand the broader regional STR landscape.
| Market | Active Properties | Monthly Revenue | Daily Rate | Avg. Occupancy |
|---|---|---|---|---|
| Les Clefs | 30 | $5,741 | $323.11 | 44% |
| Monteu Roero | 16 | $4,432 | $540.14 | 36% |
| Manigod | 194 | $4,127 | $427.80 | 40% |
| Ramatuelle | 213 | $3,891 | $670.10 | 41% |
| Saint-Jean-Cap-Ferrat | 107 | $3,844 | $424.21 | 46% |
| Cossano Belbo | 13 | $3,632 | $284.21 | 42% |
| Saint-Tropez | 742 | $3,498 | $506.57 | 41% |
| Saint-Nicolas-la-Chapelle | 27 | $3,381 | $375.70 | 43% |
| Cassinasco | 18 | $3,219 | $545.40 | 41% |
| Charvonnex | 11 | $3,212 | $228.03 | 56% |