Villanova d'Albenga Airbnb Market Analysis 2025: Short Term Rental Data & Vacation Rental Statistics in Liguria, Italy
Is Airbnb profitable in Villanova d'Albenga in 2025? Explore comprehensive Airbnb analytics for Villanova d'Albenga, Liguria, Italy to uncover income potential. This 2025 STR market report for Villanova d'Albenga, based on AirROI data from April 2024 to March 2025, reveals key trends in the niche market of 17 active listings.
Whether you're considering an Airbnb investment in Villanova d'Albenga, optimizing your existing vacation rental, or exploring rental arbitrage opportunities, understanding the Villanova d'Albenga Airbnb data is crucial. Navigating the high regulation landscape is key to maximizing your short term rental income potential. Let's dive into the specifics.
Key Villanova d'Albenga Airbnb Performance Metrics Overview
Monthly Airbnb Revenue Variations & Income Potential in Villanova d'Albenga (2025)
Understanding the monthly revenue variations for Airbnb listings in Villanova d'Albenga is key to maximizing your short term rental income potential. Seasonality significantly impacts earnings. Our analysis, based on data from the past 12 months, shows that the peak revenue month for STRs in Villanova d'Albenga is typically August, while March often presents the lowest earnings, highlighting opportunities for strategic pricing adjustments during shoulder and low seasons. Explore the typical Airbnb income in Villanova d'Albenga across different performance tiers:
- Best-in-class properties (Top 10%) achieve $2,506+ monthly, often utilizing dynamic pricing and superior guest experiences.
- Strong performing properties (Top 25%) earn $1,658 or more, indicating effective management and desirable locations/amenities.
- Typical properties (Median) generate around $816 per month, representing the average market performance.
- Entry-level properties (Bottom 25%) see earnings around $340, often with potential for optimization.
Average Monthly Airbnb Earnings Trend in Villanova d'Albenga
Villanova d'Albenga Airbnb Occupancy Rate Trends (2025)
Maximize your bookings by understanding the Villanova d'Albenga STR occupancy trends. Seasonal demand shifts significantly influence how often properties are booked. Typically, Novembersees the highest demand (peak season occupancy), while March experiences the lowest (low season). Effective strategies, like adjusting minimum stays or offering promotions, can boost occupancy during slower periods. Here's how different property tiers perform in Villanova d'Albenga:
- Best-in-class properties (Top 10%) achieve 75%+ occupancy, indicating high desirability and potentially optimized availability.
- Strong performing properties (Top 25%) maintain 54% or higher occupancy, suggesting good market fit and guest satisfaction.
- Typical properties (Median) have an occupancy rate around 24%.
- Entry-level properties (Bottom 25%) average 12% occupancy, potentially facing higher vacancy.
Average Monthly Occupancy Rate Trend in Villanova d'Albenga
Average Daily Rate (ADR) Airbnb Trends in Villanova d'Albenga (2025)
Effective short term rental pricing strategy in Villanova d'Albenga involves understanding monthly ADR fluctuations. The Average Daily Rate (ADR) for Airbnb in Villanova d'Albenga typically peaks in November and dips lowest during June. Leveraging Airbnb dynamic pricing tools or strategies based on this seasonality can significantly boost revenue. Here's a look at the typical nightly rates achieved:
- Best-in-class properties (Top 10%) command rates of $146+ per night, often due to premium features or locations.
- Strong performing properties (Top 25%) achieve nightly rates of $126 or more.
- Typical properties (Median) charge around $82 per night.
- Entry-level properties (Bottom 25%) earn around $59 per night.
Average Daily Rate (ADR) Trend by Month in Villanova d'Albenga
Get Live Villanova d'Albenga Market Intelligence 👇

Explore Real-time Analytics
Airbnb Seasonality Analysis & Trends in Villanova d'Albenga (2025)
Peak Season (August, July, November)
- Revenue averages $1,766 per month
- Occupancy rates average 55.4%
- Daily rates average $104
Shoulder Season
- Revenue averages $1,110 per month
- Occupancy maintains around 32.2%
- Daily rates hold near $102
Low Season (February, March, October)
- Revenue drops to average $561 per month
- Occupancy decreases to average 23.5%
- Daily rates adjust to average $103
Seasonality Insights for Villanova d'Albenga
- The Airbnb seasonality in Villanova d'Albenga shows highly seasonal trends requiring careful strategy. While the sections above show seasonal averages, it's also insightful to look at the extremes:
- During the high season, the absolute peak month showcases Villanova d'Albenga's highest earning potential, with monthly revenues capable of climbing to $1,956, occupancy reaching a high of 57.5%, and ADRs peaking at $106.
- Conversely, the slowest single month of the year, typically falling within the low season, marks the market's lowest point. In this month, revenue might dip to $440, occupancy could drop to 17.8%, and ADRs may adjust down to $98.
- Understanding both the seasonal averages and these monthly peaks and troughs in revenue, occupancy, and ADR is crucial for maximizing your Airbnb profit potential in Villanova d'Albenga.
Seasonal Strategies for Maximizing Profit
- Peak Season: Maximize revenue through premium pricing and potentially longer minimum stays. Ensure high availability.
- Low Season: Offer competitive pricing, special promotions (e.g., extended stay discounts), and flexible cancellation policies. Target off-season travelers like remote workers or budget-conscious guests.
- Shoulder Seasons: Implement dynamic pricing that balances peak and low rates. Target weekend travelers or specific events. Offer slightly more flexible terms than peak season.
- Regularly analyze your own performance against these Villanova d'Albenga seasonality benchmarks and adjust your pricing and availability strategy accordingly.
Best Areas for Airbnb Investment in Villanova d'Albenga (2025)
Exploring the top neighborhoods for short-term rentals in Villanova d'Albenga? This section highlights key areas, outlining why they are attractive for hosts and guests, along with notable local attractions. Consider these locations based on your target guest profile and investment strategy.
| Neighborhood / Area | Why Host Here? (Target Guests & Appeal) | Key Attractions & Landmarks |
|---|---|---|
| Albenga Old Town | Historic town center with medieval architecture and charming streets. It attracts tourists for its rich history and local culture, making it perfect for vacation rentals. | Albenga Cathedral, Roman Aqueduct, Bishop's Palace, Museo Navale Romano, Piazza San Domenico |
| Villanova Beach | Close to the coastline, this area is appealing to tourists seeking a beach escape. Direct access to the beach activities and relaxed atmosphere. | Villanova di Albenga Beach, Water sports, Beach bars, Coastal walking trails |
| L'Isola Gallinara | A small island off the coast known for its natural beauty and tranquility. Attracts tourists looking for unique day trips and nature experiences. | Nature reserves, Snorkeling spots, Scenic views, Historical ruins |
| Borghetto Santo Spirito | A nearby coastal village known for its quiet beaches and family-friendly environment. Great for attracting families and longer stays. | Borghetto Beach, Seaside promenades, Local restaurants |
| Albenga Olive Groves | Surrounding landscape with olive groves offers a peaceful rural experience. Suitable for those looking for agritourism and nature lovers. | Olive oil tastings, Hiking trails, Scenic views |
| Verezzi | Picturesque village with stunning vistas of the Ligurian coast. Popular for hiking and cultural tourism. | Castello di Verezzi, Hiking trails, Viewpoints |
| Finalborgo | Historic village known for its medieval architecture and rich history, appealing to tourists interested in culture and history. | Finalborgo fortress, Artisan shops, Historical tours |
| Ceriale | A coastal town with beautiful beaches and family attractions. Popular for summer vacations and beach sports. | Ceriale Beach, Water park, Family-friendly activities, Local seafood cuisine |
Understanding Airbnb License Requirements & STR Laws in Villanova d'Albenga (2025)
Yes, Villanova d'Albenga, Liguria, Italy enforces high STR regulations. Obtaining a license and ensuring compliance is almost certainly required according to current 2025 STR laws. Always verify the latest short term rental regulations and Airbnb license requirements directly with local government authorities for Villanova d'Albenga to ensure full compliance before hosting.
(Source: AirROI data, 2025, based on 71% licensed listings)
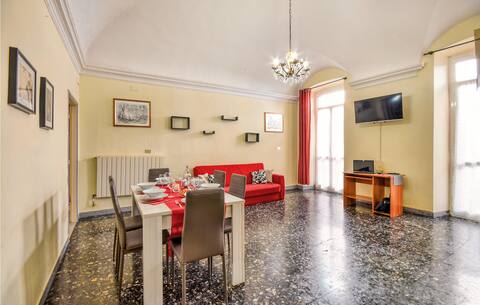
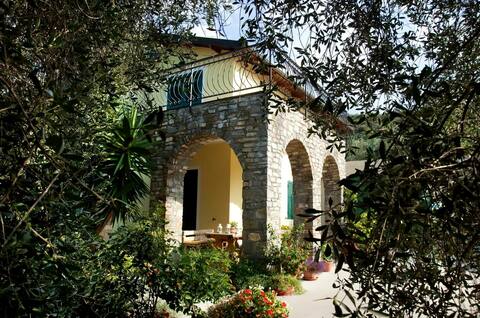
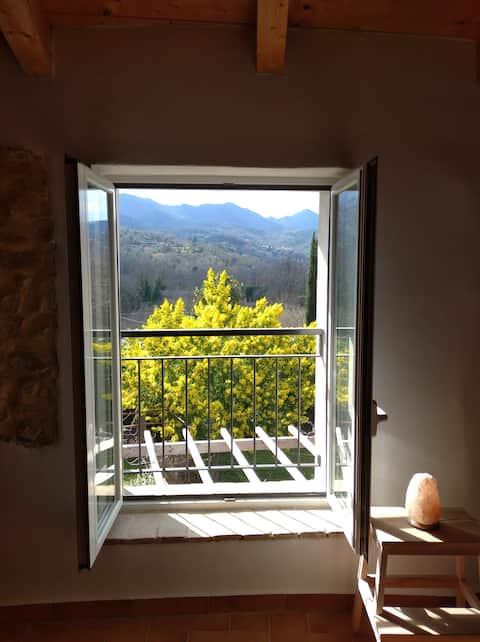
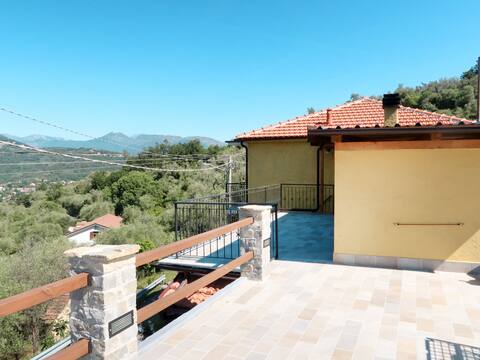
Top Performing Airbnb Properties in Villanova d'Albenga (2025)
Benchmark your potential! Explore examples of top-performing Airbnb properties in Villanova d'Albengabased on Trailing Twelve Month (TTM) revenue. Analyze their characteristics, revenue, occupancy rate, and ADR to understand what drives success in this market.
2 bedroom beautiful home in Villanova d'Albenga
Entire Place • 2 bedrooms
Countryside house
Entire Place • 2 bedrooms
Wabi Sabi Home Cir0068LT0019 CinIT009068C2MM88KSIQ
Entire Place • 1 bedroom

Casa Kitsch Cir009068LT0021 CinIT009068C2W7JFCI8H
Entire Place • 2 bedrooms
A Ca' Gialla (AEG100) by Interhome
Entire Place • 2 bedrooms
monolocale 009068-LT-0028
Entire Place • 1 bedroom
Note: Performance varies based on location, size, amenities, seasonality, and management quality. Data reflects the past 12 months.
Top Performing Airbnb Hosts in Villanova d'Albenga (2025)
Learn from the best! This table showcases top-performing Airbnb hosts in Villanova d'Albenga based on the number of properties managed and estimated total revenue over the past year. Analyze their scale and performance metrics.
| Host Name | Properties | Grossing Revenue | Stay Reviews | Avg Rating |
|---|---|---|---|---|
| Antonio | 2 | $27,153 | 87 | 4.83/5.0 |
| Novasol | 1 | $25,216 | 4 | 4.75/5.0 |
| Patrizia | 1 | $17,917 | 61 | 4.97/5.0 |
| Sandra - Interhome Group | 2 | $13,382 | 9 | 4.83/5.0 |
| Marcello | 2 | $12,713 | 48 | 4.57/5.0 |
| Isabel | 1 | $9,494 | 31 | 4.74/5.0 |
| Domenico | 1 | $9,303 | 9 | 5.00/5.0 |
| Tommaso | 1 | $3,101 | 6 | 3.67/5.0 |
| Luci | 1 | $2,310 | 7 | 5.00/5.0 |
| Crose Snc Di Orlandi Milena | 1 | $2,057 | 7 | 4.71/5.0 |
Analyzing the strategies of top hosts, such as their property selection, pricing, and guest communication, can offer valuable lessons for optimizing your own Airbnb operations in Villanova d'Albenga.
Dive Deeper: Advanced Villanova d'Albenga STR Market Data (2025)
Ready to unlock more insights? AirROI provides access to advanced metrics and comprehensive Airbnb data for Villanova d'Albenga. Explore detailed analytics beyond this report to refine your investment strategy, optimize pricing, and maximize your vacation rental profits.
Explore Advanced MetricsVillanova d'Albenga Short-Term Rental Market Composition (2025): Property & Room Types
Room Type Distribution
Property Type Distribution
Market Composition Insights for Villanova d'Albenga
- The Villanova d'Albenga Airbnb market composition is heavily skewed towards Entire Home/Apt listings, which make up 94.1% of the 17 active rentals. This indicates strong guest preference for privacy and space.
- Looking at the property type distribution in Villanova d'Albenga, House properties are the most common (47.1%), reflecting the local real estate landscape.
- Houses represent a significant 47.1% portion, catering likely to families or larger groups.
- The presence of 5.9% Hotel/Boutique listings indicates integration with traditional hospitality.
Villanova d'Albenga Airbnb Room Capacity Analysis (2025): Bedroom Distribution
Distribution of Listings by Number of Bedrooms
Room Capacity Insights for Villanova d'Albenga
- The dominant room capacity in Villanova d'Albenga is 1 bedroom listings, making up 52.9% of the market. This suggests a strong demand for properties suitable for couples or solo travelers.
- Together, 1 bedroom and 2 bedrooms properties represent 94.1% of the active Airbnb listings in Villanova d'Albenga, indicating a high concentration in these sizes.
- With over half the market (52.9%) consisting of studios or 1-bedroom units, Villanova d'Albenga is particularly well-suited for individuals or couples.
Villanova d'Albenga Vacation Rental Guest Capacity Trends (2025)
Distribution of Listings by Guest Capacity
Guest Capacity Insights for Villanova d'Albenga
- The most common guest capacity trend in Villanova d'Albenga vacation rentals is listings accommodating 4 guests (29.4%). This suggests the primary traveler segment is likely small families or groups.
- Properties designed for 4 guests and 3 guests dominate the Villanova d'Albenga STR market, accounting for 52.9% of listings.
- 17.6% of properties accommodate 6+ guests, serving the market segment for larger families or group travel in Villanova d'Albenga.
- On average, properties in Villanova d'Albenga are equipped to host 3.9 guests.
Villanova d'Albenga Airbnb Booking Patterns (2025): Available vs. Booked Days
Available Days Distribution
Booked Days Distribution
Booking Pattern Insights for Villanova d'Albenga
- The most common availability pattern in Villanova d'Albenga falls within the 271-366 days range, representing 64.7% of listings. This suggests many properties have significant open periods on their calendars.
- Approximately 82.3% of listings show high availability (181+ days open annually), indicating potential for increased bookings or specific owner usage patterns.
- For booked days, the 1-30 days range is most frequent in Villanova d'Albenga (47.1%), reflecting common guest stay durations or potential owner blocking patterns.
- A notable 17.6% of properties secure long booking periods (181+ days booked per year), highlighting successful long-term rental strategies or significant owner usage.
Villanova d'Albenga Airbnb Minimum Stay Requirements Analysis
Distribution of Listings by Minimum Night Requirement
1 Night
4 listings
23.5% of total
2 Nights
3 listings
17.6% of total
3 Nights
2 listings
11.8% of total
4-6 Nights
4 listings
23.5% of total
7-29 Nights
1 listings
5.9% of total
30+ Nights
3 listings
17.6% of total
Key Insights
- The most prevalent minimum stay requirement in Villanova d'Albenga is 1 Night, adopted by 23.5% of listings. This highlights the market's preference for shorter, flexible bookings.
- A significant segment (17.6%) caters to monthly stays (30+ nights) in Villanova d'Albenga, pointing to opportunities in the extended-stay market.
Recommendations
- Align with the market by considering a 1 Night minimum stay, as 23.5% of Villanova d'Albenga hosts use this setting.
- If feasible, allowing 1-night stays, especially midweek or during low season, could capture last-minute bookings, as only 23.5% currently do.
- Explore offering discounts for stays of 30+ nights to attract the 17.6% of the market seeking extended stays.
- Adjust minimum nights based on seasonality – potentially shorter during low season and longer during peak demand periods in Villanova d'Albenga.
Villanova d'Albenga Airbnb Cancellation Policy Trends Analysis (2025)
Super Strict 60 Days
1 listings
5.9% of total
Super Strict 30 Days
2 listings
11.8% of total
Flexible
5 listings
29.4% of total
Moderate
7 listings
41.2% of total
Strict
2 listings
11.8% of total
Cancellation Policy Insights for Villanova d'Albenga
- The prevailing Airbnb cancellation policy trend in Villanova d'Albenga is Moderate, used by 41.2% of listings.
- The market strongly favors guest-friendly terms, with 70.6% of listings offering Flexible or Moderate policies. This suggests guests in Villanova d'Albenga may expect booking flexibility.
Recommendations for Hosts
- Consider adopting a Moderate policy to align with the 41.2% market standard in Villanova d'Albenga.
- Using a Strict policy might deter some guests, as only 11.8% of listings use it. Evaluate if potential revenue protection outweighs possible lower booking rates.
- Regularly review your cancellation policy against competitors and market demand shifts in Villanova d'Albenga.
Villanova d'Albenga STR Booking Lead Time Analysis (2025)
Average Booking Lead Time by Month
Booking Lead Time Insights for Villanova d'Albenga
- The overall average booking lead time for vacation rentals in Villanova d'Albenga is 35 days.
- Guests book furthest in advance for stays during November (average 157 days), likely coinciding with peak travel demand or local events.
- The shortest booking windows occur for stays in December (average 26 days), indicating more last-minute travel plans during this time.
- Seasonally, Fall (84 days avg.) sees the longest lead times, while Winter (33 days avg.) has the shortest, reflecting typical travel planning cycles.
Recommendations for Hosts
- Use the overall average lead time (35 days) as a baseline for your pricing and availability strategy in Villanova d'Albenga.
- For November stays, consider implementing length-of-stay discounts or slightly higher rates for bookings made less than 157 days out to capitalize on advance planning.
- Target marketing efforts for the Fall season well in advance (at least 84 days) to capture early planners.
- Monitor your own booking lead times against these Villanova d'Albenga averages to identify opportunities for dynamic pricing adjustments.
Popular & Essential Airbnb Amenities in Villanova d'Albenga (2025)
Amenity Prevalence
Amenity Insights for Villanova d'Albenga
- Popular amenities like Hot water, Washer, Kitchen are common but not universal. Offering these can provide a competitive edge.
Recommendations for Hosts
- Consider adding popular differentiators like Hot water or Washer to increase appeal.
- Highlight unique or less common amenities you offer (e.g., hot tub, dedicated workspace, EV charger) in your listing description and photos.
- Regularly check competitor amenities in Villanova d'Albenga to stay competitive.
Villanova d'Albenga Airbnb Guest Demographics & Profile Analysis (2025)
Guest Profile Summary for Villanova d'Albenga
- The typical guest profile for Airbnb in Villanova d'Albenga consists of a mix of domestic (47%) and international guests, with top international origins including Germany, typically belonging to the Post-2000s (Gen Z/Alpha) group (50%), primarily speaking English or Italian.
- Domestic travelers account for 47.3% of guests.
- Key international markets include Italy (47.3%) and Germany (16.4%).
- Top languages spoken are English (32.3%) followed by Italian (21.5%).
- A significant demographic segment is the Post-2000s (Gen Z/Alpha) group, representing 50% of guests.
Recommendations for Hosts
- Balance marketing efforts between domestic and international channels based on the guest mix.
- Tailor amenities and listing descriptions to appeal to the dominant Post-2000s (Gen Z/Alpha) demographic (e.g., highlight fast WiFi, smart home features, local guides).
- Highlight unique local experiences or amenities relevant to the primary guest profile.
- Consider seasonal promotions aligned with peak travel times for key origin markets.
Nearby Short-Term Rental Market Comparison
How does the Villanova d'Albenga Airbnb market stack up against its neighbors? Compare key performance metrics like average monthly revenue, ADR, and occupancy rates in surrounding areas to understand the broader regional STR landscape.
| Market | Active Properties | Monthly Revenue | Daily Rate | Avg. Occupancy |
|---|---|---|---|---|
| Laglio | 64 | $4,873 | $463.61 | 47% |
| Monteu Roero | 16 | $4,432 | $540.14 | 36% |
| Portofino | 68 | $4,086 | $454.35 | 44% |
| Saint-Jean-Cap-Ferrat | 107 | $3,844 | $424.21 | 46% |
| Sala Comacina | 64 | $3,794 | $400.27 | 50% |
| Cossano Belbo | 13 | $3,632 | $284.21 | 42% |
| Bellagio | 373 | $3,630 | $328.26 | 55% |
| Oliveto Lario | 99 | $3,509 | $327.42 | 55% |
| Carate Urio | 71 | $3,379 | $331.90 | 44% |
| Brienno | 39 | $3,327 | $337.92 | 45% |