Sainte-Suzanne Airbnb Market Analysis 2025: Short Term Rental Data & Vacation Rental Statistics in Réunion, France
Is Airbnb profitable in Sainte-Suzanne in 2025? Explore comprehensive Airbnb analytics for Sainte-Suzanne, Réunion, France to uncover income potential. This 2025 STR market report for Sainte-Suzanne, based on AirROI data from April 2024 to March 2025, reveals key trends in the niche market of 39 active listings.
Whether you're considering an Airbnb investment in Sainte-Suzanne, optimizing your existing vacation rental, or exploring rental arbitrage opportunities, understanding the Sainte-Suzanne Airbnb data is crucial. Leveraging the low regulation environment is key to maximizing your short term rental income potential. Let's dive into the specifics.
Key Sainte-Suzanne Airbnb Performance Metrics Overview
Monthly Airbnb Revenue Variations & Income Potential in Sainte-Suzanne (2025)
Understanding the monthly revenue variations for Airbnb listings in Sainte-Suzanne is key to maximizing your short term rental income potential. Seasonality significantly impacts earnings. Our analysis, based on data from the past 12 months, shows that the peak revenue month for STRs in Sainte-Suzanne is typically November, while March often presents the lowest earnings, highlighting opportunities for strategic pricing adjustments during shoulder and low seasons. Explore the typical Airbnb income in Sainte-Suzanne across different performance tiers:
- Best-in-class properties (Top 10%) achieve $3,453+ monthly, often utilizing dynamic pricing and superior guest experiences.
- Strong performing properties (Top 25%) earn $2,216 or more, indicating effective management and desirable locations/amenities.
- Typical properties (Median) generate around $1,486 per month, representing the average market performance.
- Entry-level properties (Bottom 25%) see earnings around $743, often with potential for optimization.
Average Monthly Airbnb Earnings Trend in Sainte-Suzanne
Sainte-Suzanne Airbnb Occupancy Rate Trends (2025)
Maximize your bookings by understanding the Sainte-Suzanne STR occupancy trends. Seasonal demand shifts significantly influence how often properties are booked. Typically, Novembersees the highest demand (peak season occupancy), while June experiences the lowest (low season). Effective strategies, like adjusting minimum stays or offering promotions, can boost occupancy during slower periods. Here's how different property tiers perform in Sainte-Suzanne:
- Best-in-class properties (Top 10%) achieve 82%+ occupancy, indicating high desirability and potentially optimized availability.
- Strong performing properties (Top 25%) maintain 70% or higher occupancy, suggesting good market fit and guest satisfaction.
- Typical properties (Median) have an occupancy rate around 47%.
- Entry-level properties (Bottom 25%) average 24% occupancy, potentially facing higher vacancy.
Average Monthly Occupancy Rate Trend in Sainte-Suzanne
Average Daily Rate (ADR) Airbnb Trends in Sainte-Suzanne (2025)
Effective short term rental pricing strategy in Sainte-Suzanne involves understanding monthly ADR fluctuations. The Average Daily Rate (ADR) for Airbnb in Sainte-Suzanne typically peaks in October and dips lowest during March. Leveraging Airbnb dynamic pricing tools or strategies based on this seasonality can significantly boost revenue. Here's a look at the typical nightly rates achieved:
- Best-in-class properties (Top 10%) command rates of $240+ per night, often due to premium features or locations.
- Strong performing properties (Top 25%) achieve nightly rates of $138 or more.
- Typical properties (Median) charge around $95 per night.
- Entry-level properties (Bottom 25%) earn around $64 per night.
Average Daily Rate (ADR) Trend by Month in Sainte-Suzanne
Get Live Sainte-Suzanne Market Intelligence 👇

Explore Real-time Analytics
Airbnb Seasonality Analysis & Trends in Sainte-Suzanne (2025)
Peak Season (November, August, February)
- Revenue averages $1,902 per month
- Occupancy rates average 55.2%
- Daily rates average $116
Shoulder Season
- Revenue averages $1,712 per month
- Occupancy maintains around 47.7%
- Daily rates hold near $125
Low Season (March, June, September)
- Revenue drops to average $1,381 per month
- Occupancy decreases to average 41.2%
- Daily rates adjust to average $124
Seasonality Insights for Sainte-Suzanne
- The Airbnb seasonality in Sainte-Suzanne shows moderate seasonality with distinct peak and low periods. While the sections above show seasonal averages, it's also insightful to look at the extremes:
- During the high season, the absolute peak month showcases Sainte-Suzanne's highest earning potential, with monthly revenues capable of climbing to $1,972, occupancy reaching a high of 57.7%, and ADRs peaking at $135.
- Conversely, the slowest single month of the year, typically falling within the low season, marks the market's lowest point. In this month, revenue might dip to $1,282, occupancy could drop to 35.6%, and ADRs may adjust down to $106.
- Understanding both the seasonal averages and these monthly peaks and troughs in revenue, occupancy, and ADR is crucial for maximizing your Airbnb profit potential in Sainte-Suzanne.
Seasonal Strategies for Maximizing Profit
- Peak Season: Maximize revenue through premium pricing and potentially longer minimum stays. Ensure high availability.
- Low Season: Offer competitive pricing, special promotions (e.g., extended stay discounts), and flexible cancellation policies. Target off-season travelers like remote workers or budget-conscious guests.
- Shoulder Seasons: Implement dynamic pricing that balances peak and low rates. Target weekend travelers or specific events. Offer slightly more flexible terms than peak season.
- Regularly analyze your own performance against these Sainte-Suzanne seasonality benchmarks and adjust your pricing and availability strategy accordingly.
Best Areas for Airbnb Investment in Sainte-Suzanne (2025)
Exploring the top neighborhoods for short-term rentals in Sainte-Suzanne? This section highlights key areas, outlining why they are attractive for hosts and guests, along with notable local attractions. Consider these locations based on your target guest profile and investment strategy.
| Neighborhood / Area | Why Host Here? (Target Guests & Appeal) | Key Attractions & Landmarks |
|---|---|---|
| Saint-Gilles-les-Bains | Popular beach resort town known for its stunning beaches and vibrant nightlife. Ideal for tourists looking for relaxation and outdoor activities such as water sports. | Lagoon of Saint-Gilles, Boucan Canot Beach, Les Roches Noires, Saint-Gilles Port, Pointe au Sel |
| Saint-Denis | The capital city of Réunion, offering a mix of culture, history, and nature. Attracts business travelers and tourists interested in the local art scene and vibrant markets. | Jardin de l'État, Musée Léon Dierx, Le Barachois, Cathedral of Saint-Denis, Rue de Paris |
| Cilaos | A stunning highland village set in the mountains, known for its hiking trails and breathtaking scenery. Popular with nature lovers and those seeking a tranquil escape. | Cirque de Cilaos, Piton des Neiges, Thermal baths, Wine tasting at local vineyards, Hiking trails |
| La Possession | A picturesque coastal town with beautiful landscapes and access to hiking trails. Great for travelers looking for outdoor adventures. | Maïdo Mountain, Theakston Trail, Cascade de Grand Galet, Local markets, Diving spots |
| Saint-Leu | Known for its beautiful beaches and surfing spots. A laid-back atmosphere attracts surfers and families. | Lagoon of Saint-Leu, Kélonia (turtle museum), Surf spots, Cultural heritage sites, Coastal paths |
| Saint-Pierre | Vibrant town with a mix of cultures, known for its markets and lively seaside promenade. Good for tourists interested in local culture and cuisine. | Saint-Pierre Beach, Theatre Luc Donat, Local markets, Le Port de Saint-Pierre, Cultural festivals |
| L'Ermitage | Famous for its beach and coral reef, this area is perfect for watersports enthusiasts and families with kids who want to enjoy the calm sea. | Hermitage Lagoon, Coral reefs, Beachfront restaurants, Family-friendly beaches, Water activities |
| La Saline-les-Bains | A tranquil beach area ideal for tourists looking to relax and enjoy a quieter environment away from the busier resorts. | La Saline Beach, Protected marine area, Snorkeling spots, Local gastronomy, Quiet coastal paths |
Understanding Airbnb License Requirements & STR Laws in Sainte-Suzanne (2025)
While Sainte-Suzanne, Réunion, France currently shows low STR regulations, specific Airbnb license requirements might still exist or change. Always verify the latest short term rental regulations and Airbnb license requirements directly with local government authorities for Sainte-Suzanne to ensure full compliance before hosting.
(Source: AirROI data, 2025, finding no licensed listings among those analyzed)
Top Performing Airbnb Properties in Sainte-Suzanne (2025)
Benchmark your potential! Explore examples of top-performing Airbnb properties in Sainte-Suzannebased on Trailing Twelve Month (TTM) revenue. Analyze their characteristics, revenue, occupancy rate, and ADR to understand what drives success in this market.

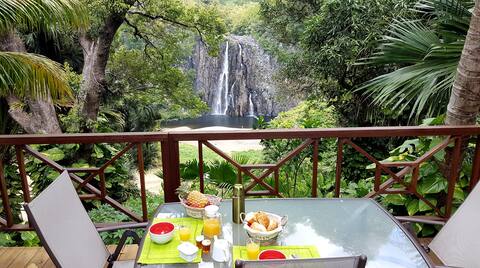
La Case Grondin, house 8 pers
Entire Place • 3 bedrooms
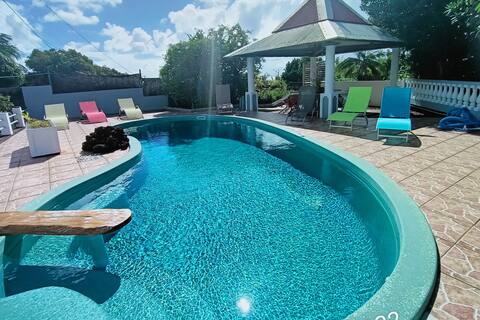
The Tec Tec - a comfortable creole guesthouse
Entire Place • 2 bedrooms

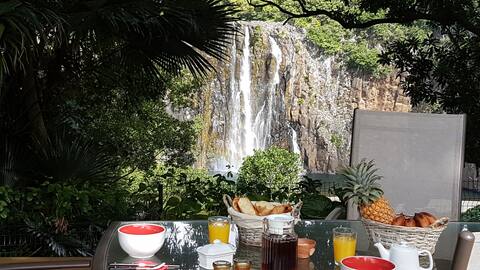
Le lodge origin
Entire Place • N/A
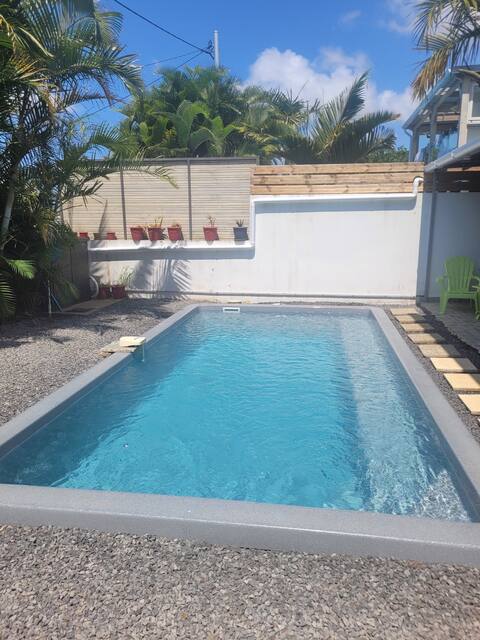
Le Camps des Evis - Quiet villa
Entire Place • 5 bedrooms
The Cardinal - comfortable creole guesthouse
Entire Place • 2 bedrooms
Gîte Les Caramboles
Entire Place • 2 bedrooms
Note: Performance varies based on location, size, amenities, seasonality, and management quality. Data reflects the past 12 months.
Top Performing Airbnb Hosts in Sainte-Suzanne (2025)
Learn from the best! This table showcases top-performing Airbnb hosts in Sainte-Suzanne based on the number of properties managed and estimated total revenue over the past year. Analyze their scale and performance metrics.
| Host Name | Properties | Grossing Revenue | Stay Reviews | Avg Rating |
|---|---|---|---|---|
| Christelle | 3 | $91,439 | 181 | 4.85/5.0 |
| Vivienne | 4 | $55,959 | 86 | 4.99/5.0 |
| Nelly | 3 | $54,260 | 583 | 4.90/5.0 |
| William | 1 | $43,364 | 22 | 4.91/5.0 |
| Sébastien | 1 | $37,176 | 408 | 4.95/5.0 |
| Frédérique | 1 | $36,219 | 18 | 4.78/5.0 |
| Sergine | 2 | $30,126 | 89 | 4.99/5.0 |
| Marie Vanessa | 1 | $28,099 | 8 | 4.88/5.0 |
| Jean Michel | 1 | $26,208 | 22 | 4.64/5.0 |
| René | 1 | $25,323 | 27 | 4.78/5.0 |
Analyzing the strategies of top hosts, such as their property selection, pricing, and guest communication, can offer valuable lessons for optimizing your own Airbnb operations in Sainte-Suzanne.
Dive Deeper: Advanced Sainte-Suzanne STR Market Data (2025)
Ready to unlock more insights? AirROI provides access to advanced metrics and comprehensive Airbnb data for Sainte-Suzanne. Explore detailed analytics beyond this report to refine your investment strategy, optimize pricing, and maximize your vacation rental profits.
Explore Advanced MetricsSainte-Suzanne Short-Term Rental Market Composition (2025): Property & Room Types
Room Type Distribution
Property Type Distribution
Market Composition Insights for Sainte-Suzanne
- The Sainte-Suzanne Airbnb market composition is heavily skewed towards Entire Home/Apt listings, which make up 94.9% of the 39 active rentals. This indicates strong guest preference for privacy and space.
- Looking at the property type distribution in Sainte-Suzanne, House properties are the most common (64.1%), reflecting the local real estate landscape.
- Houses represent a significant 64.1% portion, catering likely to families or larger groups.
- Smaller segments like outdoor/unique (combined 2.6%) offer potential for unique stay experiences.
Sainte-Suzanne Airbnb Room Capacity Analysis (2025): Bedroom Distribution
Distribution of Listings by Number of Bedrooms
Room Capacity Insights for Sainte-Suzanne
- The dominant room capacity in Sainte-Suzanne is 1 bedroom listings, making up 35.9% of the market. This suggests a strong demand for properties suitable for couples or solo travelers.
- Together, 1 bedroom and 2 bedrooms properties represent 61.5% of the active Airbnb listings in Sainte-Suzanne, indicating a high concentration in these sizes.
- A significant 20.6% of listings offer 3+ bedrooms, catering to larger groups and families seeking more space in Sainte-Suzanne.
Sainte-Suzanne Vacation Rental Guest Capacity Trends (2025)
Distribution of Listings by Guest Capacity
Guest Capacity Insights for Sainte-Suzanne
- The most common guest capacity trend in Sainte-Suzanne vacation rentals is listings accommodating 2 guests (38.5%). This suggests the primary traveler segment is likely couples or solo travelers.
- Properties designed for 2 guests and 4 guests dominate the Sainte-Suzanne STR market, accounting for 61.6% of listings.
- 23.1% of properties accommodate 6+ guests, serving the market segment for larger families or group travel in Sainte-Suzanne.
- On average, properties in Sainte-Suzanne are equipped to host 3.7 guests.
Sainte-Suzanne Airbnb Booking Patterns (2025): Available vs. Booked Days
Available Days Distribution
Booked Days Distribution
Booking Pattern Insights for Sainte-Suzanne
- The most common availability pattern in Sainte-Suzanne falls within the 181-270 days range, representing 33.3% of listings. This suggests many properties have significant open periods on their calendars.
- Approximately 61.5% of listings show high availability (181+ days open annually), indicating potential for increased bookings or specific owner usage patterns.
- For booked days, the 91-180 days range is most frequent in Sainte-Suzanne (33.3%), reflecting common guest stay durations or potential owner blocking patterns.
- A notable 38.5% of properties secure long booking periods (181+ days booked per year), highlighting successful long-term rental strategies or significant owner usage.
Sainte-Suzanne Airbnb Minimum Stay Requirements Analysis
Distribution of Listings by Minimum Night Requirement
1 Night
9 listings
23.1% of total
2 Nights
14 listings
35.9% of total
3 Nights
3 listings
7.7% of total
4-6 Nights
11 listings
28.2% of total
30+ Nights
2 listings
5.1% of total
Key Insights
- The most prevalent minimum stay requirement in Sainte-Suzanne is 2 Nights, adopted by 35.9% of listings. This highlights the market's preference for shorter, flexible bookings.
Recommendations
- Align with the market by considering a 2 Nights minimum stay, as 35.9% of Sainte-Suzanne hosts use this setting.
- If feasible, allowing 1-night stays, especially midweek or during low season, could capture last-minute bookings, as only 23.1% currently do.
- Explore offering discounts for stays of 30+ nights to attract the 5.1% of the market seeking extended stays.
- Adjust minimum nights based on seasonality – potentially shorter during low season and longer during peak demand periods in Sainte-Suzanne.
Sainte-Suzanne Airbnb Cancellation Policy Trends Analysis (2025)
Flexible
8 listings
21.1% of total
Moderate
14 listings
36.8% of total
Firm
9 listings
23.7% of total
Strict
7 listings
18.4% of total
Cancellation Policy Insights for Sainte-Suzanne
- The prevailing Airbnb cancellation policy trend in Sainte-Suzanne is Moderate, used by 36.8% of listings.
- There's a relatively balanced mix between guest-friendly (57.9%) and stricter (42.1%) policies, offering choices for different guest needs.
Recommendations for Hosts
- Consider adopting a Moderate policy to align with the 36.8% market standard in Sainte-Suzanne.
- Regularly review your cancellation policy against competitors and market demand shifts in Sainte-Suzanne.
Sainte-Suzanne STR Booking Lead Time Analysis (2025)
Average Booking Lead Time by Month
Booking Lead Time Insights for Sainte-Suzanne
- The overall average booking lead time for vacation rentals in Sainte-Suzanne is 53 days.
- Guests book furthest in advance for stays during November (average 89 days), likely coinciding with peak travel demand or local events.
- The shortest booking windows occur for stays in March (average 43 days), indicating more last-minute travel plans during this time.
- Seasonally, Fall (74 days avg.) sees the longest lead times, while Spring (54 days avg.) has the shortest, reflecting typical travel planning cycles.
Recommendations for Hosts
- Use the overall average lead time (53 days) as a baseline for your pricing and availability strategy in Sainte-Suzanne.
- For November stays, consider implementing length-of-stay discounts or slightly higher rates for bookings made less than 89 days out to capitalize on advance planning.
- Target marketing efforts for the Fall season well in advance (at least 74 days) to capture early planners.
- Monitor your own booking lead times against these Sainte-Suzanne averages to identify opportunities for dynamic pricing adjustments.
Popular & Essential Airbnb Amenities in Sainte-Suzanne (2025)
Amenity Prevalence
Amenity Insights for Sainte-Suzanne
- Essential amenities in Sainte-Suzanne that guests expect include: Dishes and silverware. Lacking these (this) could significantly impact bookings.
- Popular amenities like Wifi, Essentials, Cooking basics are common but not universal. Offering these can provide a competitive edge.
- Warning: Wifi is not universally provided but is considered essential globally. Ensure reliable Wifi is offered.
Recommendations for Hosts
- Ensure your listing includes all essential amenities for Sainte-Suzanne: Dishes and silverware.
- Consider adding popular differentiators like Wifi or Essentials to increase appeal.
- Highlight unique or less common amenities you offer (e.g., hot tub, dedicated workspace, EV charger) in your listing description and photos.
- Regularly check competitor amenities in Sainte-Suzanne to stay competitive.
Sainte-Suzanne Airbnb Guest Demographics & Profile Analysis (2025)
Guest Profile Summary for Sainte-Suzanne
- The typical guest profile for Airbnb in Sainte-Suzanne consists of primarily domestic travelers (75%), often arriving from nearby Paris, typically belonging to the Post-2000s (Gen Z/Alpha) group (50%), primarily speaking French or English.
- Domestic travelers account for 75.3% of guests.
- Key international markets include France (75.3%) and Réunion (8%).
- Top languages spoken are French (46.8%) followed by English (31.9%).
- A significant demographic segment is the Post-2000s (Gen Z/Alpha) group, representing 50% of guests.
Recommendations for Hosts
- Target domestic marketing efforts towards travelers from Paris and La Réunion.
- Tailor amenities and listing descriptions to appeal to the dominant Post-2000s (Gen Z/Alpha) demographic (e.g., highlight fast WiFi, smart home features, local guides).
- Highlight unique local experiences or amenities relevant to the primary guest profile.
- Consider seasonal promotions aligned with peak travel times for key origin markets.
Nearby Short-Term Rental Market Comparison
How does the Sainte-Suzanne Airbnb market stack up against its neighbors? Compare key performance metrics like average monthly revenue, ADR, and occupancy rates in surrounding areas to understand the broader regional STR landscape.
| Market | Active Properties | Monthly Revenue | Daily Rate | Avg. Occupancy |
|---|---|---|---|---|
| Cilaos | 150 | $1,799 | $132.28 | 49% |
| Salazie | 61 | $1,738 | $120.16 | 52% |
| Les Trois-Bassins | 72 | $1,705 | $179.01 | 45% |
| Saint-Paul | 1,856 | $1,590 | $151.70 | 50% |
| Sainte-Rose | 23 | $1,446 | $143.18 | 48% |
| L'Étang-Salé | 229 | $1,431 | $138.39 | 48% |
| Saint-Leu | 583 | $1,404 | $125.31 | 51% |
| Saint-Philippe | 29 | $1,374 | $102.33 | 45% |
| La Plaine-des-Palmistes | 50 | $1,360 | $153.36 | 37% |
| Saint-Joseph | 300 | $1,354 | $128.56 | 45% |