Saint-Paul Airbnb Market Analysis 2025: Short Term Rental Data & Vacation Rental Statistics in Réunion, France
Is Airbnb profitable in Saint-Paul in 2025? Explore comprehensive Airbnb analytics for Saint-Paul, Réunion, France to uncover income potential. This 2025 STR market report for Saint-Paul, based on AirROI data from April 2024 to March 2025, reveals key trends in the bustling market of 1,856 active listings.
Whether you're considering an Airbnb investment in Saint-Paul, optimizing your existing vacation rental, or exploring rental arbitrage opportunities, understanding the Saint-Paul Airbnb data is crucial. Leveraging the low regulation environment is key to maximizing your short term rental income potential. Let's dive into the specifics.
Key Saint-Paul Airbnb Performance Metrics Overview
Monthly Airbnb Revenue Variations & Income Potential in Saint-Paul (2025)
Understanding the monthly revenue variations for Airbnb listings in Saint-Paul is key to maximizing your short term rental income potential. Seasonality significantly impacts earnings. Our analysis, based on data from the past 12 months, shows that the peak revenue month for STRs in Saint-Paul is typically November, while March often presents the lowest earnings, highlighting opportunities for strategic pricing adjustments during shoulder and low seasons. Explore the typical Airbnb income in Saint-Paul across different performance tiers:
- Best-in-class properties (Top 10%) achieve $4,795+ monthly, often utilizing dynamic pricing and superior guest experiences.
- Strong performing properties (Top 25%) earn $2,811 or more, indicating effective management and desirable locations/amenities.
- Typical properties (Median) generate around $1,751 per month, representing the average market performance.
- Entry-level properties (Bottom 25%) see earnings around $963, often with potential for optimization.
Average Monthly Airbnb Earnings Trend in Saint-Paul
Saint-Paul Airbnb Occupancy Rate Trends (2025)
Maximize your bookings by understanding the Saint-Paul STR occupancy trends. Seasonal demand shifts significantly influence how often properties are booked. Typically, Novembersees the highest demand (peak season occupancy), while June experiences the lowest (low season). Effective strategies, like adjusting minimum stays or offering promotions, can boost occupancy during slower periods. Here's how different property tiers perform in Saint-Paul:
- Best-in-class properties (Top 10%) achieve 90%+ occupancy, indicating high desirability and potentially optimized availability.
- Strong performing properties (Top 25%) maintain 79% or higher occupancy, suggesting good market fit and guest satisfaction.
- Typical properties (Median) have an occupancy rate around 54%.
- Entry-level properties (Bottom 25%) average 28% occupancy, potentially facing higher vacancy.
Average Monthly Occupancy Rate Trend in Saint-Paul
Average Daily Rate (ADR) Airbnb Trends in Saint-Paul (2025)
Effective short term rental pricing strategy in Saint-Paul involves understanding monthly ADR fluctuations. The Average Daily Rate (ADR) for Airbnb in Saint-Paul typically peaks in December and dips lowest during September. Leveraging Airbnb dynamic pricing tools or strategies based on this seasonality can significantly boost revenue. Here's a look at the typical nightly rates achieved:
- Best-in-class properties (Top 10%) command rates of $317+ per night, often due to premium features or locations.
- Strong performing properties (Top 25%) achieve nightly rates of $185 or more.
- Typical properties (Median) charge around $102 per night.
- Entry-level properties (Bottom 25%) earn around $73 per night.
Average Daily Rate (ADR) Trend by Month in Saint-Paul
Get Live Saint-Paul Market Intelligence 👇

Explore Real-time Analytics
Airbnb Seasonality Analysis & Trends in Saint-Paul (2025)
Peak Season (November, October, December)
- Revenue averages $2,779 per month
- Occupancy rates average 62.3%
- Daily rates average $156
Shoulder Season
- Revenue averages $2,307 per month
- Occupancy maintains around 52.6%
- Daily rates hold near $149
Low Season (February, March, June)
- Revenue drops to average $1,806 per month
- Occupancy decreases to average 43.1%
- Daily rates adjust to average $150
Seasonality Insights for Saint-Paul
- The Airbnb seasonality in Saint-Paul shows moderate seasonality with distinct peak and low periods. While the sections above show seasonal averages, it's also insightful to look at the extremes:
- During the high season, the absolute peak month showcases Saint-Paul's highest earning potential, with monthly revenues capable of climbing to $2,892, occupancy reaching a high of 67.1%, and ADRs peaking at $159.
- Conversely, the slowest single month of the year, typically falling within the low season, marks the market's lowest point. In this month, revenue might dip to $1,654, occupancy could drop to 37.2%, and ADRs may adjust down to $146.
- Understanding both the seasonal averages and these monthly peaks and troughs in revenue, occupancy, and ADR is crucial for maximizing your Airbnb profit potential in Saint-Paul.
Seasonal Strategies for Maximizing Profit
- Peak Season: Maximize revenue through premium pricing and potentially longer minimum stays. Ensure high availability.
- Low Season: Offer competitive pricing, special promotions (e.g., extended stay discounts), and flexible cancellation policies. Target off-season travelers like remote workers or budget-conscious guests.
- Shoulder Seasons: Implement dynamic pricing that balances peak and low rates. Target weekend travelers or specific events. Offer slightly more flexible terms than peak season.
- Regularly analyze your own performance against these Saint-Paul seasonality benchmarks and adjust your pricing and availability strategy accordingly.
Best Areas for Airbnb Investment in Saint-Paul (2025)
Exploring the top neighborhoods for short-term rentals in Saint-Paul? This section highlights key areas, outlining why they are attractive for hosts and guests, along with notable local attractions. Consider these locations based on your target guest profile and investment strategy.
| Neighborhood / Area | Why Host Here? (Target Guests & Appeal) | Key Attractions & Landmarks |
|---|---|---|
| Saint-Gilles-les-Bains | The most popular resort town in Réunion known for its beautiful beaches and vibrant nightlife. Ideal for tourists looking for relaxation and entertainment by the coast. | Plage des Roches Noires, Aquarium de la Réunion, Les Aigrettes, Café de l'Est, La Plage de l'Ermitage |
| Saint-Paul | The historic and cultural capital of Réunion, offering a mix of heritage, local markets, and beautiful landscapes. A great place for travelers wanting to explore the island's culture. | Musée de Villèle, Le Maïdo, Saint-Paul Market, Les Sables de Saint-Paul, Church of Saint-Paul |
| Boucan Canot | A stunning beach area known for its clear waters and surf culture, attracting both locals and tourists who enjoy beach activities. | Boucan Canot Beach, Surf spots, Restaurants and beach bars, Scuba diving and snorkeling sites, Hiking trails nearby |
| La Possession | A more tranquil area with access to natural beauty and hiking trails, appealing to nature lovers and those looking for outdoor adventures. | Maïdo Mountain, Cirque de Mafate, Hiking trails, Scenic viewpoints, Local markets |
| Le Port | A vibrant port town with access to various marine activities, marine life, and a lively atmosphere. Attracts travelers interested in the local maritime culture. | Port of Saint-Denis, L'Église de Saint-Paul, Marina, Local seafood restaurants, Ferry to Île aux Serpents |
| Cilaos | A mountainous area famous for its natural beauty, perfect for hiking and outdoor sports enthusiasts. A unique retreat for visitors looking for a contrast to coastal areas. | Cilaos Cirque, Thermal baths, Hiking trails, Local wine tasting, Stunning mountain views |
| Savanne | Known for its lush greenery and diverse wildlife, appealing to eco-tourists and those looking to connect with nature. | Savanne Nature Reserve, Birdwatching spots, Local flora and fauna, Scenic drives, Photography opportunities |
| Saint-Denis | The capital of Réunion, featuring vibrant markets, historic sites, and a rich blend of cultures. Ideal for visitors interested in urban exploring and local culture. | Rue de Paris, Historic downtown area, Le Jardin de l'Etat, Local art galleries, Cultural festivals |
Understanding Airbnb License Requirements & STR Laws in Saint-Paul (2025)
While Saint-Paul, Réunion, France currently shows low STR regulations, specific Airbnb license requirements might still exist or change. Always verify the latest short term rental regulations and Airbnb license requirements directly with local government authorities for Saint-Paul to ensure full compliance before hosting.
(Source: AirROI data, 2025, based on 1% licensed listings)
Top Performing Airbnb Properties in Saint-Paul (2025)
Benchmark your potential! Explore examples of top-performing Airbnb properties in Saint-Paulbased on Trailing Twelve Month (TTM) revenue. Analyze their characteristics, revenue, occupancy rate, and ADR to understand what drives success in this market.

Villa des Sables du Lagon - Feet in the water
Entire Place • 5 bedrooms
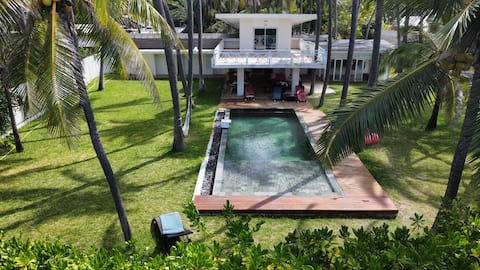
Beachfront villa on the lagoon
Entire Place • 4 bedrooms
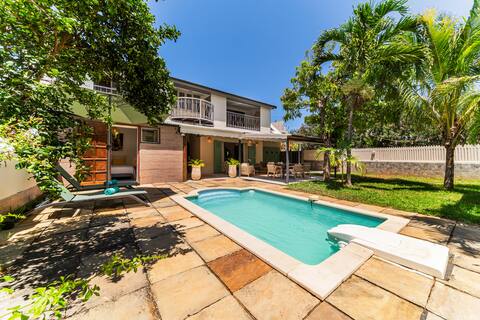
Villa ALMA - 13 people - QUIET - Close to the beach
Entire Place • 6 bedrooms
Le Hameau des Sables - Villa "Paille-En-Queue"
Entire Place • 3 bedrooms

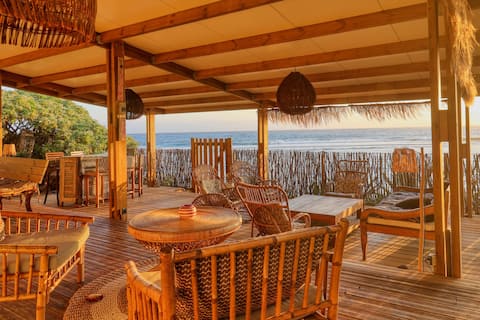
Villa Azur Saint-Gilles * **** - Pool, Beach & BBQ!
Entire Place • 4 bedrooms
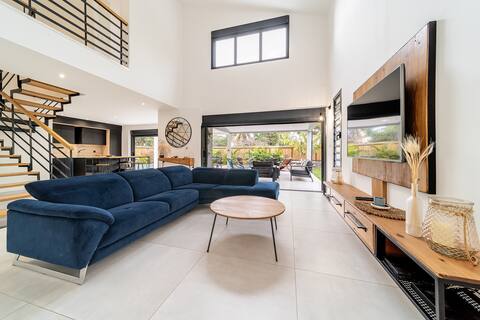
Villa Ilyana - 10 pers - near beach - pool
Entire Place • 4 bedrooms
Note: Performance varies based on location, size, amenities, seasonality, and management quality. Data reflects the past 12 months.
Top Performing Airbnb Hosts in Saint-Paul (2025)
Learn from the best! This table showcases top-performing Airbnb hosts in Saint-Paul based on the number of properties managed and estimated total revenue over the past year. Analyze their scale and performance metrics.
| Host Name | Properties | Grossing Revenue | Stay Reviews | Avg Rating |
|---|---|---|---|---|
| Marine | 21 | $901,281 | 229 | 3.70/5.0 |
| Charline | 29 | $726,946 | 612 | 4.52/5.0 |
| Yannis | 4 | $407,611 | 87 | 4.92/5.0 |
| Chris | 18 | $407,116 | 484 | 4.50/5.0 |
| Adopte Un Toit | 27 | $389,052 | 323 | 3.12/5.0 |
| Néri Et Julien | 13 | $377,065 | 365 | 4.07/5.0 |
| Marion | 10 | $335,374 | 32 | 1.94/5.0 |
| Frédéric | 45 | $315,317 | 88 | 1.07/5.0 |
| Guillaume | 4 | $302,682 | 110 | 4.80/5.0 |
| Authentic Stay | 8 | $297,640 | 217 | 4.59/5.0 |
Analyzing the strategies of top hosts, such as their property selection, pricing, and guest communication, can offer valuable lessons for optimizing your own Airbnb operations in Saint-Paul.
Dive Deeper: Advanced Saint-Paul STR Market Data (2025)
Ready to unlock more insights? AirROI provides access to advanced metrics and comprehensive Airbnb data for Saint-Paul. Explore detailed analytics beyond this report to refine your investment strategy, optimize pricing, and maximize your vacation rental profits.
Explore Advanced MetricsSaint-Paul Short-Term Rental Market Composition (2025): Property & Room Types
Room Type Distribution
Property Type Distribution
Market Composition Insights for Saint-Paul
- The Saint-Paul Airbnb market composition is heavily skewed towards Entire Home/Apt listings, which make up 92% of the 1,856 active rentals. This indicates strong guest preference for privacy and space.
- Looking at the property type distribution in Saint-Paul, Apartment/Condo properties are the most common (48.4%), reflecting the local real estate landscape.
- Houses represent a significant 44.5% portion, catering likely to families or larger groups.
- Smaller segments like hotel/boutique, others, outdoor/unique, unique stays (combined 7.1%) offer potential for unique stay experiences.
Saint-Paul Airbnb Room Capacity Analysis (2025): Bedroom Distribution
Distribution of Listings by Number of Bedrooms
Room Capacity Insights for Saint-Paul
- The dominant room capacity in Saint-Paul is 1 bedroom listings, making up 40% of the market. This suggests a strong demand for properties suitable for couples or solo travelers.
- Together, 1 bedroom and 2 bedrooms properties represent 59.6% of the active Airbnb listings in Saint-Paul, indicating a high concentration in these sizes.
- A significant 27.7% of listings offer 3+ bedrooms, catering to larger groups and families seeking more space in Saint-Paul.
Saint-Paul Vacation Rental Guest Capacity Trends (2025)
Distribution of Listings by Guest Capacity
Guest Capacity Insights for Saint-Paul
- The most common guest capacity trend in Saint-Paul vacation rentals is listings accommodating 4 guests (26.6%). This suggests the primary traveler segment is likely small families or groups.
- Properties designed for 4 guests and 2 guests dominate the Saint-Paul STR market, accounting for 53.0% of listings.
- 30.8% of properties accommodate 6+ guests, serving the market segment for larger families or group travel in Saint-Paul.
- On average, properties in Saint-Paul are equipped to host 4.1 guests.
Saint-Paul Airbnb Booking Patterns (2025): Available vs. Booked Days
Available Days Distribution
Booked Days Distribution
Booking Pattern Insights for Saint-Paul
- The most common availability pattern in Saint-Paul falls within the 271-366 days range, representing 37.6% of listings. This suggests many properties have significant open periods on their calendars.
- Approximately 63.1% of listings show high availability (181+ days open annually), indicating potential for increased bookings or specific owner usage patterns.
- For booked days, the 91-180 days range is most frequent in Saint-Paul (25.8%), reflecting common guest stay durations or potential owner blocking patterns.
- A notable 37.9% of properties secure long booking periods (181+ days booked per year), highlighting successful long-term rental strategies or significant owner usage.
Saint-Paul Airbnb Minimum Stay Requirements Analysis
Distribution of Listings by Minimum Night Requirement
1 Night
127 listings
7.3% of total
2 Nights
269 listings
15.4% of total
3 Nights
203 listings
11.6% of total
4-6 Nights
711 listings
40.7% of total
7-29 Nights
189 listings
10.8% of total
30+ Nights
247 listings
14.1% of total
Key Insights
- The most prevalent minimum stay requirement in Saint-Paul is 4-6 Nights, adopted by 40.7% of listings. This highlights the market's preference for longer commitments.
- A significant segment (14.1%) caters to monthly stays (30+ nights) in Saint-Paul, pointing to opportunities in the extended-stay market.
Recommendations
- Align with the market by considering a 4-6 Nights minimum stay, as 40.7% of Saint-Paul hosts use this setting.
- If feasible, allowing 1-night stays, especially midweek or during low season, could capture last-minute bookings, as only 7.3% currently do.
- Explore offering discounts for stays of 30+ nights to attract the 14.1% of the market seeking extended stays.
- Adjust minimum nights based on seasonality – potentially shorter during low season and longer during peak demand periods in Saint-Paul.
Saint-Paul Airbnb Cancellation Policy Trends Analysis (2025)
Super Strict 60 Days
4 listings
0.3% of total
Non-refundable
2 listings
0.1% of total
Refundable
2 listings
0.1% of total
Super Strict 30 Days
15 listings
1% of total
Flexible
333 listings
21.5% of total
Moderate
363 listings
23.4% of total
Firm
359 listings
23.1% of total
Strict
474 listings
30.5% of total
Cancellation Policy Insights for Saint-Paul
- The prevailing Airbnb cancellation policy trend in Saint-Paul is Strict, used by 30.5% of listings.
- A majority (53.6%) of hosts in Saint-Paul utilize Firm or Strict policies, indicating a market where hosts prioritize booking security.
Recommendations for Hosts
- Consider adopting a Strict policy to align with the 30.5% market standard in Saint-Paul.
- With 30.5% using Strict terms, this is a viable option in Saint-Paul, particularly for high-value properties or during peak demand periods.
- Regularly review your cancellation policy against competitors and market demand shifts in Saint-Paul.
Saint-Paul STR Booking Lead Time Analysis (2025)
Average Booking Lead Time by Month
Booking Lead Time Insights for Saint-Paul
- The overall average booking lead time for vacation rentals in Saint-Paul is 80 days.
- Guests book furthest in advance for stays during November (average 111 days), likely coinciding with peak travel demand or local events.
- The shortest booking windows occur for stays in March (average 66 days), indicating more last-minute travel plans during this time.
- Seasonally, Fall (100 days avg.) sees the longest lead times, while Spring (78 days avg.) has the shortest, reflecting typical travel planning cycles.
Recommendations for Hosts
- Use the overall average lead time (80 days) as a baseline for your pricing and availability strategy in Saint-Paul.
- For November stays, consider implementing length-of-stay discounts or slightly higher rates for bookings made less than 111 days out to capitalize on advance planning.
- Target marketing efforts for the Fall season well in advance (at least 100 days) to capture early planners.
- Monitor your own booking lead times against these Saint-Paul averages to identify opportunities for dynamic pricing adjustments.
Popular & Essential Airbnb Amenities in Saint-Paul (2025)
Amenity Prevalence
Amenity Insights for Saint-Paul
- Essential amenities in Saint-Paul that guests expect include: Wifi, Kitchen. Lacking these (any) could significantly impact bookings.
- Popular amenities like Washer, Hot water, Air conditioning are common but not universal. Offering these can provide a competitive edge.
Recommendations for Hosts
- Ensure your listing includes all essential amenities for Saint-Paul: Wifi, Kitchen.
- Prioritize adding missing essentials: Wifi, Kitchen.
- Consider adding popular differentiators like Washer or Hot water to increase appeal.
- Highlight unique or less common amenities you offer (e.g., hot tub, dedicated workspace, EV charger) in your listing description and photos.
- Regularly check competitor amenities in Saint-Paul to stay competitive.
Saint-Paul Airbnb Guest Demographics & Profile Analysis (2025)
Guest Profile Summary for Saint-Paul
- The typical guest profile for Airbnb in Saint-Paul consists of primarily domestic travelers (79%), often arriving from nearby Paris, typically belonging to the Post-2000s (Gen Z/Alpha) group (50%), primarily speaking French or English.
- Domestic travelers account for 78.6% of guests.
- Key international markets include France (78.6%) and Réunion (8.5%).
- Top languages spoken are French (45.8%) followed by English (33.6%).
- A significant demographic segment is the Post-2000s (Gen Z/Alpha) group, representing 50% of guests.
Recommendations for Hosts
- Target domestic marketing efforts towards travelers from Paris and Saint-Denis.
- Tailor amenities and listing descriptions to appeal to the dominant Post-2000s (Gen Z/Alpha) demographic (e.g., highlight fast WiFi, smart home features, local guides).
- Highlight unique local experiences or amenities relevant to the primary guest profile.
- Consider seasonal promotions aligned with peak travel times for key origin markets.
Nearby Short-Term Rental Market Comparison
How does the Saint-Paul Airbnb market stack up against its neighbors? Compare key performance metrics like average monthly revenue, ADR, and occupancy rates in surrounding areas to understand the broader regional STR landscape.
| Market | Active Properties | Monthly Revenue | Daily Rate | Avg. Occupancy |
|---|---|---|---|---|
| Cilaos | 150 | $1,799 | $132.28 | 49% |
| Salazie | 61 | $1,738 | $120.16 | 52% |
| Les Trois-Bassins | 72 | $1,705 | $179.01 | 45% |
| Sainte-Rose | 23 | $1,446 | $143.18 | 48% |
| L'Étang-Salé | 229 | $1,431 | $138.39 | 48% |
| Saint-Leu | 583 | $1,404 | $125.31 | 51% |
| Saint-Philippe | 29 | $1,374 | $102.33 | 45% |
| La Plaine-des-Palmistes | 50 | $1,360 | $153.36 | 37% |
| Saint-Joseph | 300 | $1,354 | $128.56 | 45% |
| Petite-Île | 107 | $1,338 | $127.36 | 43% |