Saint-Louis Airbnb Market Analysis 2025: Short Term Rental Data & Vacation Rental Statistics in Réunion, France
Is Airbnb profitable in Saint-Louis in 2025? Explore comprehensive Airbnb analytics for Saint-Louis, Réunion, France to uncover income potential. This 2025 STR market report for Saint-Louis, based on AirROI data from April 2024 to March 2025, reveals key trends in the market of 235 active listings.
Whether you're considering an Airbnb investment in Saint-Louis, optimizing your existing vacation rental, or exploring rental arbitrage opportunities, understanding the Saint-Louis Airbnb data is crucial. Leveraging the low regulation environment is key to maximizing your short term rental income potential. Let's dive into the specifics.
Key Saint-Louis Airbnb Performance Metrics Overview
Monthly Airbnb Revenue Variations & Income Potential in Saint-Louis (2025)
Understanding the monthly revenue variations for Airbnb listings in Saint-Louis is key to maximizing your short term rental income potential. Seasonality significantly impacts earnings. Our analysis, based on data from the past 12 months, shows that the peak revenue month for STRs in Saint-Louis is typically October, while March often presents the lowest earnings, highlighting opportunities for strategic pricing adjustments during shoulder and low seasons. Explore the typical Airbnb income in Saint-Louis across different performance tiers:
- Best-in-class properties (Top 10%) achieve $3,846+ monthly, often utilizing dynamic pricing and superior guest experiences.
- Strong performing properties (Top 25%) earn $2,345 or more, indicating effective management and desirable locations/amenities.
- Typical properties (Median) generate around $1,211 per month, representing the average market performance.
- Entry-level properties (Bottom 25%) see earnings around $555, often with potential for optimization.
Average Monthly Airbnb Earnings Trend in Saint-Louis
Saint-Louis Airbnb Occupancy Rate Trends (2025)
Maximize your bookings by understanding the Saint-Louis STR occupancy trends. Seasonal demand shifts significantly influence how often properties are booked. Typically, Octobersees the highest demand (peak season occupancy), while June experiences the lowest (low season). Effective strategies, like adjusting minimum stays or offering promotions, can boost occupancy during slower periods. Here's how different property tiers perform in Saint-Louis:
- Best-in-class properties (Top 10%) achieve 85%+ occupancy, indicating high desirability and potentially optimized availability.
- Strong performing properties (Top 25%) maintain 67% or higher occupancy, suggesting good market fit and guest satisfaction.
- Typical properties (Median) have an occupancy rate around 40%.
- Entry-level properties (Bottom 25%) average 18% occupancy, potentially facing higher vacancy.
Average Monthly Occupancy Rate Trend in Saint-Louis
Average Daily Rate (ADR) Airbnb Trends in Saint-Louis (2025)
Effective short term rental pricing strategy in Saint-Louis involves understanding monthly ADR fluctuations. The Average Daily Rate (ADR) for Airbnb in Saint-Louis typically peaks in December and dips lowest during September. Leveraging Airbnb dynamic pricing tools or strategies based on this seasonality can significantly boost revenue. Here's a look at the typical nightly rates achieved:
- Best-in-class properties (Top 10%) command rates of $228+ per night, often due to premium features or locations.
- Strong performing properties (Top 25%) achieve nightly rates of $150 or more.
- Typical properties (Median) charge around $89 per night.
- Entry-level properties (Bottom 25%) earn around $58 per night.
Average Daily Rate (ADR) Trend by Month in Saint-Louis
Get Live Saint-Louis Market Intelligence 👇

Explore Real-time Analytics
Airbnb Seasonality Analysis & Trends in Saint-Louis (2025)
Peak Season (October, April, November)
- Revenue averages $2,020 per month
- Occupancy rates average 50.2%
- Daily rates average $118
Shoulder Season
- Revenue averages $1,744 per month
- Occupancy maintains around 42.2%
- Daily rates hold near $118
Low Season (February, March, September)
- Revenue drops to average $1,304 per month
- Occupancy decreases to average 38.3%
- Daily rates adjust to average $116
Seasonality Insights for Saint-Louis
- The Airbnb seasonality in Saint-Louis shows moderate seasonality with distinct peak and low periods. While the sections above show seasonal averages, it's also insightful to look at the extremes:
- During the high season, the absolute peak month showcases Saint-Louis's highest earning potential, with monthly revenues capable of climbing to $2,073, occupancy reaching a high of 56.2%, and ADRs peaking at $122.
- Conversely, the slowest single month of the year, typically falling within the low season, marks the market's lowest point. In this month, revenue might dip to $1,185, occupancy could drop to 31.8%, and ADRs may adjust down to $115.
- Understanding both the seasonal averages and these monthly peaks and troughs in revenue, occupancy, and ADR is crucial for maximizing your Airbnb profit potential in Saint-Louis.
Seasonal Strategies for Maximizing Profit
- Peak Season: Maximize revenue through premium pricing and potentially longer minimum stays. Ensure high availability.
- Low Season: Offer competitive pricing, special promotions (e.g., extended stay discounts), and flexible cancellation policies. Target off-season travelers like remote workers or budget-conscious guests.
- Shoulder Seasons: Implement dynamic pricing that balances peak and low rates. Target weekend travelers or specific events. Offer slightly more flexible terms than peak season.
- Regularly analyze your own performance against these Saint-Louis seasonality benchmarks and adjust your pricing and availability strategy accordingly.
Best Areas for Airbnb Investment in Saint-Louis (2025)
Exploring the top neighborhoods for short-term rentals in Saint-Louis? This section highlights key areas, outlining why they are attractive for hosts and guests, along with notable local attractions. Consider these locations based on your target guest profile and investment strategy.
| Neighborhood / Area | Why Host Here? (Target Guests & Appeal) | Key Attractions & Landmarks |
|---|---|---|
| Saint-Gilles-les-Bains | A popular coastal town known for its beautiful beaches and vibrant nightlife. Offers a variety of water sports and is a prime destination for tourists looking for seaside activities. | Plage des Brisants, Aquarium de la Réunion, Le Spa du Prince Maurice, Les Aigrettes, Bassin des Aigrettes |
| Saint-Denis | The capital city of Réunion, offering a rich cultural experience with historical sites, shopping, and dining. Ideal for guests interested in local culture and history. | Jardin de l'État, Musée Léon Dierx, Cathédrale de Saint-Denis, Rue de Paris, Parc de la Trinité |
| Cilaos | Famous for its stunning mountain scenery and hiking trails. Attracts nature lovers and adventure tourists looking for unique landscapes and outdoor activities. | Cilaos circuit, Piton des Neiges, Thermes de Cilaos, Local wine farms, Cilaos village |
| Saint-Pierre | Known for its port, beach, and vibrant dining scene. A great spot for tourists who enjoy local cuisines and maritime activities. | Plage de Saint-Pierre, Bassin Bleu, Marché couvert de Saint-Pierre, Le Maïdo, La Saga du Rhum |
| Salazie | Nestled in the mountains, Salazie is perfect for travelers who enjoy serenity and lush vegetation. It attracts those looking for a peaceful retreat in nature. | Voile de la Marie, Mafate, Cascade du Voile de la Marie, Cirque de Salazie, Le Belvedere |
| L'Etang-Salé | Famous for its black sand beaches and nature reserves. Ideal for visitors seeking a less crowded beach experience and natural beauty. | Plage de L'Etang-Salé, La Forêt de L'Etang-Salé, L'Etang-Salé Nature Reserve, Grain de Sable |
| La Plaine des Cafres | A rural area known for its agricultural landscape and peacefulness. Great for those looking for a slow-paced vacation and local experiences. | Parc animalier de la Réunion, Cirque de Cilaos, Le volcan Piton de la Fournaise, Marché de La Plaine des Cafres |
| Saint-Leu | Renowned for its stunning coastline and surfing spots. A fantastic destination for beach lovers and surf enthusiasts, providing a laid-back atmosphere. | Plage de Saint-Leu, Kélonia marine turtle observatory, Le souffleur, Musee Stella Matutina, Parc des Palmiers |
Understanding Airbnb License Requirements & STR Laws in Saint-Louis (2025)
While Saint-Louis, Réunion, France currently shows low STR regulations, specific Airbnb license requirements might still exist or change. Always verify the latest short term rental regulations and Airbnb license requirements directly with local government authorities for Saint-Louis to ensure full compliance before hosting.
(Source: AirROI data, 2025, finding no licensed listings among those analyzed)
Top Performing Airbnb Properties in Saint-Louis (2025)
Benchmark your potential! Explore examples of top-performing Airbnb properties in Saint-Louisbased on Trailing Twelve Month (TTM) revenue. Analyze their characteristics, revenue, occupancy rate, and ADR to understand what drives success in this market.

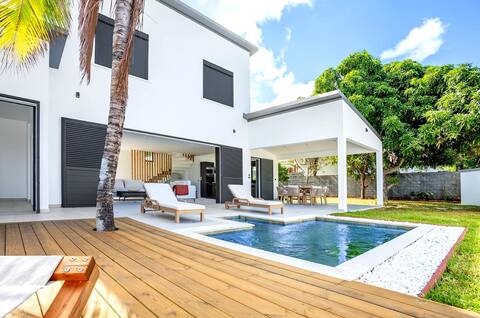
Change of scenery: sea/mountain view, swimming pool, parking
Entire Place • 4 bedrooms

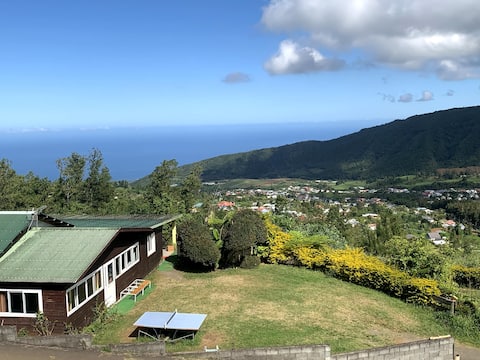
Villa coup de coeur in tropical garden
Entire Place • 5 bedrooms

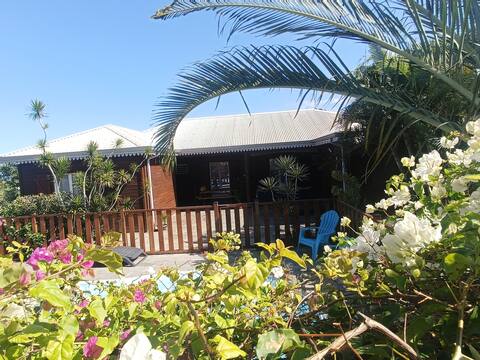
Villa Contemporaine Elodie's Home
Entire Place • 4 bedrooms
Villa Quartz
Entire Place • 3 bedrooms
Gîte aux Makes 18 couchages
Entire Place • 3 bedrooms
Vacation rental "Bois d 'Arnette"
Entire Place • 4 bedrooms
Note: Performance varies based on location, size, amenities, seasonality, and management quality. Data reflects the past 12 months.
Top Performing Airbnb Hosts in Saint-Louis (2025)
Learn from the best! This table showcases top-performing Airbnb hosts in Saint-Louis based on the number of properties managed and estimated total revenue over the past year. Analyze their scale and performance metrics.
| Host Name | Properties | Grossing Revenue | Stay Reviews | Avg Rating |
|---|---|---|---|---|
| Romain | 2 | $119,207 | 29 | 4.88/5.0 |
| Vanessa | 2 | $81,000 | 58 | 4.99/5.0 |
| Nicolas | 1 | $69,352 | 35 | 4.77/5.0 |
| Marie | 4 | $63,490 | 67 | 4.88/5.0 |
| Ô Ruisseau | 2 | $60,974 | 26 | 4.95/5.0 |
| David | 1 | $56,118 | 3 | 5.00/5.0 |
| Maud | 3 | $54,090 | 77 | 3.19/5.0 |
| Jeremy | 1 | $52,311 | 43 | 4.91/5.0 |
| Sebastien | 1 | $51,227 | 30 | 4.83/5.0 |
| Agnès | 2 | $49,550 | 364 | 4.97/5.0 |
Analyzing the strategies of top hosts, such as their property selection, pricing, and guest communication, can offer valuable lessons for optimizing your own Airbnb operations in Saint-Louis.
Dive Deeper: Advanced Saint-Louis STR Market Data (2025)
Ready to unlock more insights? AirROI provides access to advanced metrics and comprehensive Airbnb data for Saint-Louis. Explore detailed analytics beyond this report to refine your investment strategy, optimize pricing, and maximize your vacation rental profits.
Explore Advanced MetricsSaint-Louis Short-Term Rental Market Composition (2025): Property & Room Types
Room Type Distribution
Property Type Distribution
Market Composition Insights for Saint-Louis
- The Saint-Louis Airbnb market composition is heavily skewed towards Entire Home/Apt listings, which make up 88.5% of the 235 active rentals. This indicates strong guest preference for privacy and space.
- Looking at the property type distribution in Saint-Louis, House properties are the most common (66.8%), reflecting the local real estate landscape.
- Houses represent a significant 66.8% portion, catering likely to families or larger groups.
- The presence of 9.4% Hotel/Boutique listings indicates integration with traditional hospitality.
- Smaller segments like others, outdoor/unique, unique stays (combined 6.0%) offer potential for unique stay experiences.
Saint-Louis Airbnb Room Capacity Analysis (2025): Bedroom Distribution
Distribution of Listings by Number of Bedrooms
Room Capacity Insights for Saint-Louis
- The dominant room capacity in Saint-Louis is 1 bedroom listings, making up 31.1% of the market. This suggests a strong demand for properties suitable for couples or solo travelers.
- Together, 1 bedroom and 2 bedrooms properties represent 58.8% of the active Airbnb listings in Saint-Louis, indicating a high concentration in these sizes.
- A significant 30.6% of listings offer 3+ bedrooms, catering to larger groups and families seeking more space in Saint-Louis.
Saint-Louis Vacation Rental Guest Capacity Trends (2025)
Distribution of Listings by Guest Capacity
Guest Capacity Insights for Saint-Louis
- The most common guest capacity trend in Saint-Louis vacation rentals is listings accommodating 4 guests (24.3%). This suggests the primary traveler segment is likely small families or groups.
- Properties designed for 4 guests and 2 guests dominate the Saint-Louis STR market, accounting for 46.9% of listings.
- 36.2% of properties accommodate 6+ guests, serving the market segment for larger families or group travel in Saint-Louis.
- On average, properties in Saint-Louis are equipped to host 4.2 guests.
Saint-Louis Airbnb Booking Patterns (2025): Available vs. Booked Days
Available Days Distribution
Booked Days Distribution
Booking Pattern Insights for Saint-Louis
- The most common availability pattern in Saint-Louis falls within the 271-366 days range, representing 48.1% of listings. This suggests many properties have significant open periods on their calendars.
- Approximately 72.8% of listings show high availability (181+ days open annually), indicating potential for increased bookings or specific owner usage patterns.
- For booked days, the 91-180 days range is most frequent in Saint-Louis (26%), reflecting common guest stay durations or potential owner blocking patterns.
- A notable 27.3% of properties secure long booking periods (181+ days booked per year), highlighting successful long-term rental strategies or significant owner usage.
Saint-Louis Airbnb Minimum Stay Requirements Analysis
Distribution of Listings by Minimum Night Requirement
1 Night
39 listings
17.2% of total
2 Nights
66 listings
29.1% of total
3 Nights
26 listings
11.5% of total
4-6 Nights
67 listings
29.5% of total
7-29 Nights
15 listings
6.6% of total
30+ Nights
14 listings
6.2% of total
Key Insights
- The most prevalent minimum stay requirement in Saint-Louis is 4-6 Nights, adopted by 29.5% of listings. This highlights the market's preference for longer commitments.
Recommendations
- Align with the market by considering a 4-6 Nights minimum stay, as 29.5% of Saint-Louis hosts use this setting.
- If feasible, allowing 1-night stays, especially midweek or during low season, could capture last-minute bookings, as only 17.2% currently do.
- Explore offering discounts for stays of 30+ nights to attract the 6.2% of the market seeking extended stays.
- Adjust minimum nights based on seasonality – potentially shorter during low season and longer during peak demand periods in Saint-Louis.
Saint-Louis Airbnb Cancellation Policy Trends Analysis (2025)
Super Strict 30 Days
1 listings
0.5% of total
Super Strict 60 Days
2 listings
1% of total
Flexible
70 listings
35.4% of total
Moderate
46 listings
23.2% of total
Firm
44 listings
22.2% of total
Strict
35 listings
17.7% of total
Cancellation Policy Insights for Saint-Louis
- The prevailing Airbnb cancellation policy trend in Saint-Louis is Flexible, used by 35.4% of listings.
- There's a relatively balanced mix between guest-friendly (58.6%) and stricter (39.9%) policies, offering choices for different guest needs.
Recommendations for Hosts
- Consider adopting a Flexible policy to align with the 35.4% market standard in Saint-Louis.
- Regularly review your cancellation policy against competitors and market demand shifts in Saint-Louis.
Saint-Louis STR Booking Lead Time Analysis (2025)
Average Booking Lead Time by Month
Booking Lead Time Insights for Saint-Louis
- The overall average booking lead time for vacation rentals in Saint-Louis is 65 days.
- Guests book furthest in advance for stays during October (average 104 days), likely coinciding with peak travel demand or local events.
- The shortest booking windows occur for stays in March (average 56 days), indicating more last-minute travel plans during this time.
- Seasonally, Fall (86 days avg.) sees the longest lead times, while Winter (65 days avg.) has the shortest, reflecting typical travel planning cycles.
Recommendations for Hosts
- Use the overall average lead time (65 days) as a baseline for your pricing and availability strategy in Saint-Louis.
- For October stays, consider implementing length-of-stay discounts or slightly higher rates for bookings made less than 104 days out to capitalize on advance planning.
- Target marketing efforts for the Fall season well in advance (at least 86 days) to capture early planners.
- Monitor your own booking lead times against these Saint-Louis averages to identify opportunities for dynamic pricing adjustments.
Popular & Essential Airbnb Amenities in Saint-Louis (2025)
Amenity Prevalence
Amenity Insights for Saint-Louis
- Essential amenities in Saint-Louis that guests expect include: Kitchen. Lacking these (this) could significantly impact bookings.
- Popular amenities like Wifi, Free parking on premises, Hot water are common but not universal. Offering these can provide a competitive edge.
- Warning: Wifi is not universally provided but is considered essential globally. Ensure reliable Wifi is offered.
Recommendations for Hosts
- Ensure your listing includes all essential amenities for Saint-Louis: Kitchen.
- Prioritize adding missing essentials: Kitchen.
- Consider adding popular differentiators like Wifi or Free parking on premises to increase appeal.
- Highlight unique or less common amenities you offer (e.g., hot tub, dedicated workspace, EV charger) in your listing description and photos.
- Regularly check competitor amenities in Saint-Louis to stay competitive.
Saint-Louis Airbnb Guest Demographics & Profile Analysis (2025)
Guest Profile Summary for Saint-Louis
- The typical guest profile for Airbnb in Saint-Louis consists of primarily domestic travelers (70%), often arriving from nearby Paris, typically belonging to the Post-2000s (Gen Z/Alpha) group (50%), primarily speaking French or English.
- Domestic travelers account for 69.8% of guests.
- Key international markets include France (69.8%) and Réunion (17.4%).
- Top languages spoken are French (49.4%) followed by English (31.7%).
- A significant demographic segment is the Post-2000s (Gen Z/Alpha) group, representing 50% of guests.
Recommendations for Hosts
- Target domestic marketing efforts towards travelers from Paris and Saint-Denis.
- Tailor amenities and listing descriptions to appeal to the dominant Post-2000s (Gen Z/Alpha) demographic (e.g., highlight fast WiFi, smart home features, local guides).
- Highlight unique local experiences or amenities relevant to the primary guest profile.
- Consider seasonal promotions aligned with peak travel times for key origin markets.
Nearby Short-Term Rental Market Comparison
How does the Saint-Louis Airbnb market stack up against its neighbors? Compare key performance metrics like average monthly revenue, ADR, and occupancy rates in surrounding areas to understand the broader regional STR landscape.
| Market | Active Properties | Monthly Revenue | Daily Rate | Avg. Occupancy |
|---|---|---|---|---|
| Cilaos | 150 | $1,799 | $132.28 | 49% |
| Salazie | 61 | $1,738 | $120.16 | 52% |
| Les Trois-Bassins | 72 | $1,705 | $179.01 | 45% |
| Saint-Paul | 1,856 | $1,590 | $151.70 | 50% |
| Sainte-Rose | 23 | $1,446 | $143.18 | 48% |
| L'Étang-Salé | 229 | $1,431 | $138.39 | 48% |
| Saint-Leu | 583 | $1,404 | $125.31 | 51% |
| Saint-Philippe | 29 | $1,374 | $102.33 | 45% |
| La Plaine-des-Palmistes | 50 | $1,360 | $153.36 | 37% |
| Saint-Joseph | 300 | $1,354 | $128.56 | 45% |